
Grafana reporting: How we improved the UX in Grafana
Behind every feature in Grafana, no matter how big or small, lies a lot of hard work, commitment, and attention to detail. At Grafana Labs, we use a cross-functional team approach to come up with ideas and solutions that ultimately make our products more usable, resilient, and adaptable to user needs. To achieve this, we work collaboratively across the UX, product, and engineering disciplines.
We recently applied this approach to updating the UX for the reporting functionality for Grafana Enterprise and Grafana CloudPro and Advanced users. In this blog post, I’m going to outline the UX improvements we introduced with the release of Grafana 9.0 and the methods we used to get there.
Grafana reporting rule no. 1: Nobody likes long forms
Reporting is one of the most important premium features of Grafana Enterprise, Grafana Cloud Pro and Grafana Cloud Advanced. It allows users to generate PDFs with data from any of their dashboards and share them outside Grafana, such as sending reports to key decision makers within an organization or sharing them during critical watch periods. Reporting democratizes data by making insights available even to non-Grafana users.
However, as Grafana has become increasingly powerful with each new release, the reporting feature started to lag behind. The PDF reports didn’t clearly convey all the information necessary to analyze the data from dashboards (for example, they didn’t contain template variables) so non-Grafana users still needed to use Grafana to thoroughly explore their data.
Research and customer insights made it clear that we needed to make reporting more powerful by including more data from dashboards, by offering more flexible scheduling options, by adding new formats for exporting data, as well as introducing other enhancements. However, when we started ideating on which of these new functionalities we could add and how, we realized reporting was quickly turning into one really long form (see below).
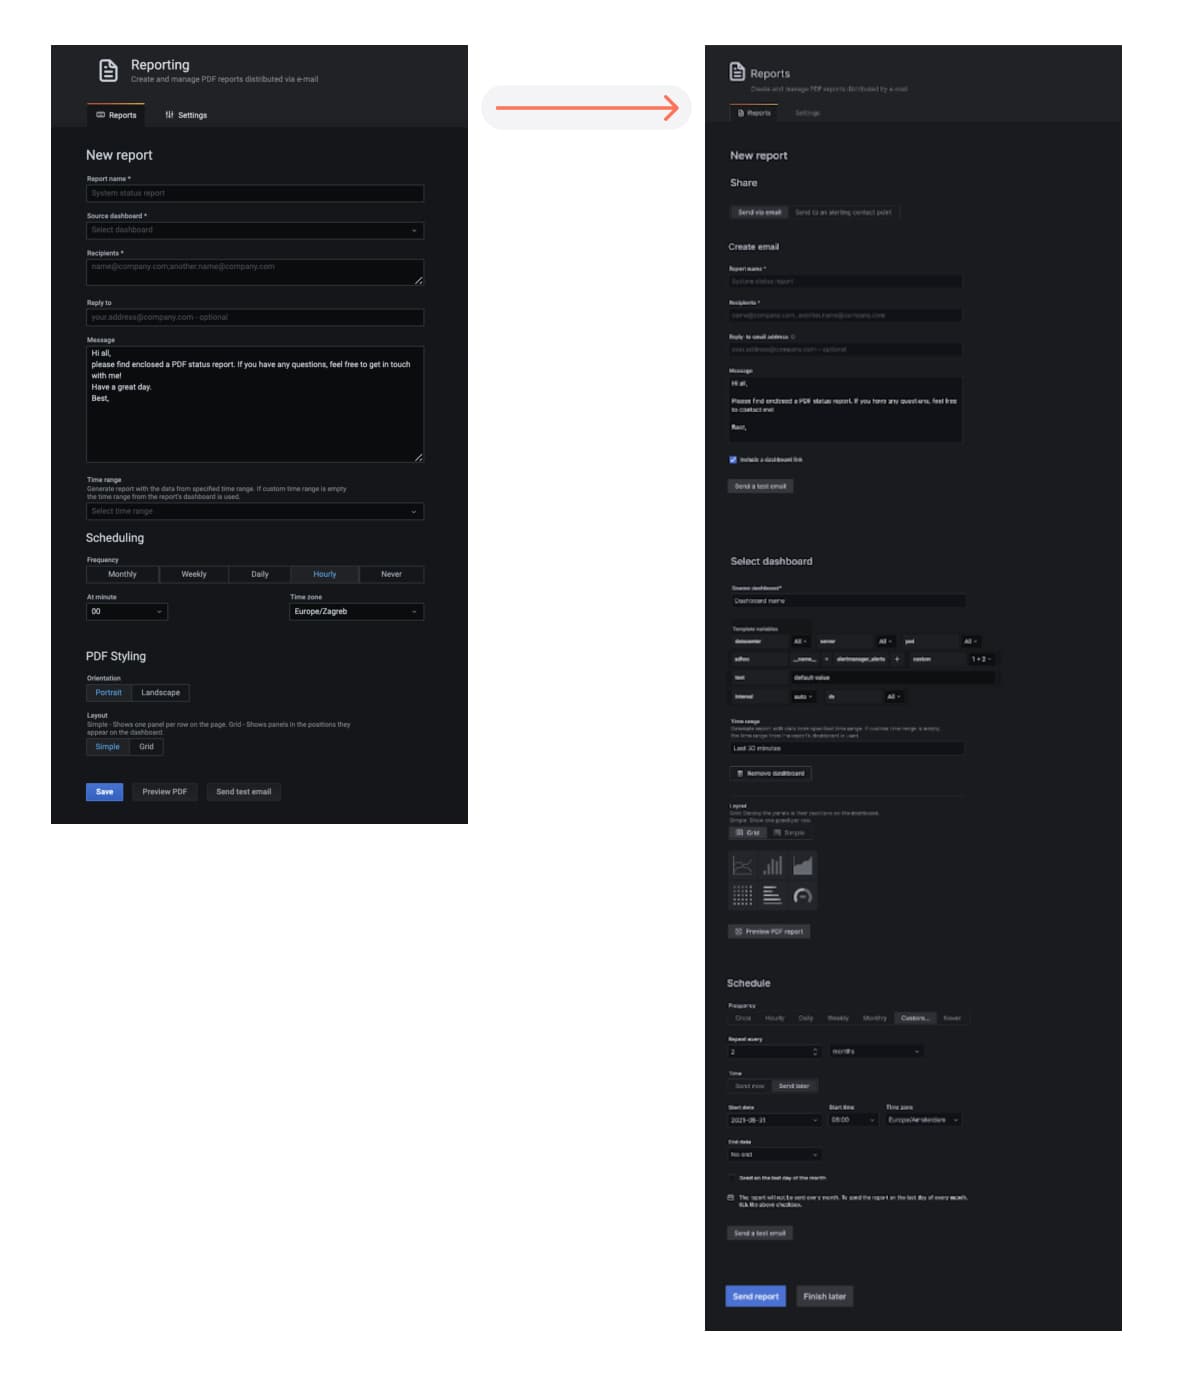
At left, the reporting form before new features were introduced. At right, the reporting form after adding new functionalities without rethinking the UX pattern.
Although a long form might seem unavoidable, it is typically not very usable, increases the occurrence of errors, can be overwhelming, can increase cognitive load, and let’s face it — people simply don’t like filling out long forms!
Introducing the new UX for Grafana reporting
Following lean and agile development principles, we started to roll out the new UX for Grafana reporting over the last year and have introduced several iterations since then.
In the initial launch, users were able to use our upgraded scheduler. Previously, reports could only be sent immediately after creation, recurrence options were limited, and there was no start date, no end date, no one-off reports. With the first upgrade, we decided to implement a more flexible report scheduler, allowing users to:
- Schedule a report for a limited period of time during critical watch periods by setting a start and end date.
- Set custom recurrence time ranges (e.g. every 4 hours for periods of increased activity).
- Opt in to receive reports only between Monday and Friday, in case you don’t want to read reports on the weekends.
As we continued to improve the UX, we also made it possible to:
- Report on multiple dashboards in a single report.
- Select template variables.
- Send a .CSV file along with the PDF for users who want to dig through dashboard data in a tool like Excel.
- Embed a report as an image in the body of an email for users who don’t allow attachments for security reasons.
- Pause a report.
- Check the status of your report – scheduled, paused, or expired – on the reports list page.
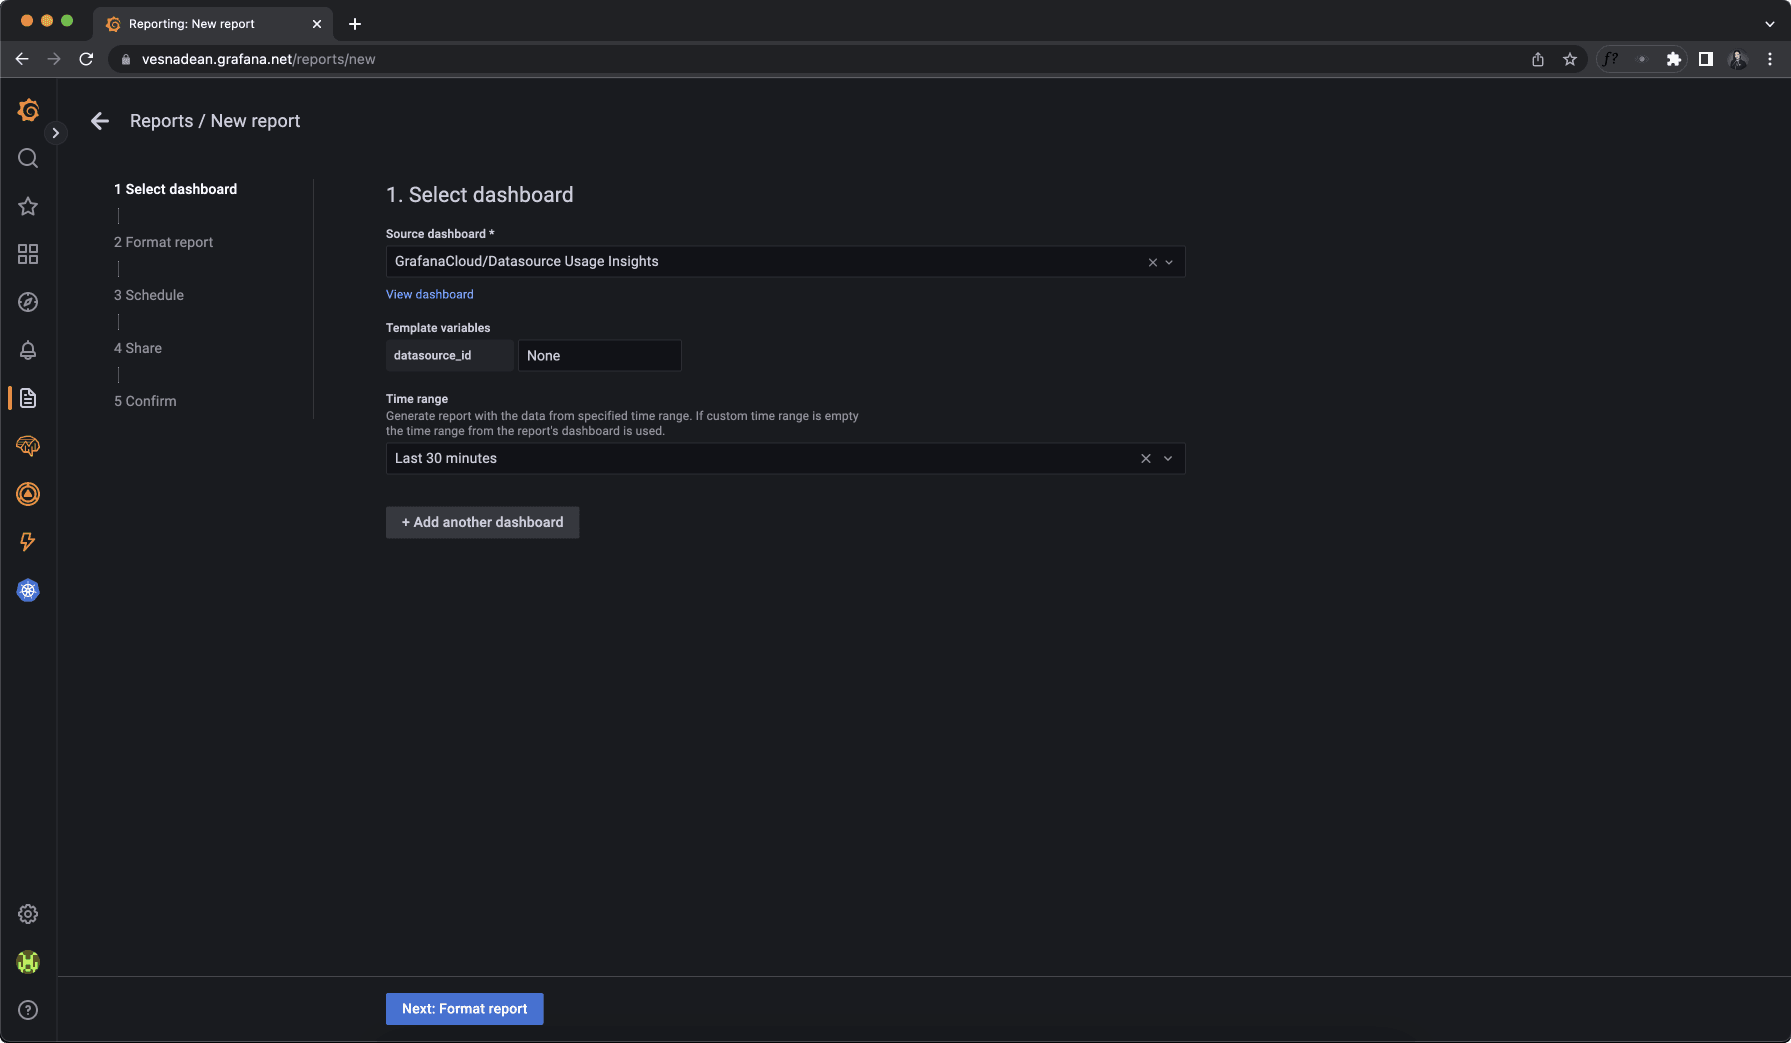
Here is where we landed:
How we got here: Our UX design approach
Research
At Grafana Labs, we rely on user research to fuel insights and breakthroughs. We generate ideas and conceptualize by keeping an eye out on what users need now and what they might need in the future. This is why we perform a lot of remote interviews and usability tests with our users, and gather customer support tickets in order to uncover their needs, pain points, and frustrations, and then come up with solutions that fit user needs.
Grafana reporting solution … a wizard?

Recently, we decided to reimagine the entire report creation flow. We based this on one of the biggest insights we uncovered in usability testing: The first thing users want to select is a dashboard to report on, not create an email. So when mapping out the steps of the form, we switched them around to match the way users actually approach creating reports. Next, we decided to break down the form into a multi-step process: a wizard.
As we already mentioned, people hate filling out long forms. They often seem daunting and can lead users to overestimate the amount of effort involved in the process. Wizards, however, cause users to feel less overwhelmed by the process, reduce errors by providing less information at a time, and minimize cognitive load by breaking processes into bite-size, logical chunks. And they work well with processes that are performed occasionally, such as creating a report.
UX words of wisdom: Respect the user’s level of expertise
Wizards are awesome, but they can also be evil when they are designed poorly.
It is commonly believed that wizards are useful in that they control the flow of the dialogue between the user and the system. However, we mustn’t forget that many Grafana users are power users who want to stay in control every step of the way. For this reason, it was crucial to:
- Allow users to freely navigate between the steps of the wizard, without forcing them to complete each step before moving to the next.
- Map the correct sequence of steps and understand the most common user flow.
How we validated the Grafana reporting solution
Usability testing is a UX research method where we try to understand how easy it is to use a feature or product by observing how users interact with it. It creates loads of rich, qualitative data that we take into consideration when we iterate on our ideas.
To assess the usability of the new reporting design, we ran a total of 11 usability tests with Grafana users. We wanted to understand what didn’t work in the previous version of reporting, to validate our solution, and find areas for improvement.
Overall, all users reacted positively to the wizard concept and successfully completed all tasks in the interface. Some users helped us uncover a small number of usability issues that were taken care of in the following iterations before we arrived at the current offering.
What’s next for Grafana reporting
We hope the updated UX of Grafana reporting is serving you well. In the spirit of continuous iteration, we will be working on making it even better with features such as saving a report draft without scheduling or sending it.
To learn more, check out our Reporting documentation.
Do you have a strong opinion about reporting? Get in touch with us on the Grafana Labs Community Slack.
If you’re not already using Grafana Cloud — the easiest way to get started with observability — sign up now for a free 14-day trial of Grafana Cloud Pro, with unlimited metrics, logs, traces, and users, long-term retention, and access to one Enterprise plugin.

