
How to send logs to Grafana Loki with the OpenTelemetry Collector using Fluent Forward and Filelog receivers
In this guide, we’ll set up an OpenTelemetry Collector that collects logs and sends them to Grafana Loki running in Grafana Cloud.
We will consider two examples for sending logs to Loki via OpenTelemetry Collector. The first one shows how to collect container logs with a Fluent Forward receiver. The second one shows how to collect system logs with a Filelog receiver.
Prerequisites
Before we start, we need to have Grafana Loki and Grafana running. You can download and run Loki and Grafana yourself, or you can use Grafana Cloud, which has a generous free forever tier as well as plans for every use case that you can sign up for today. In this guide, we will go with Grafana Cloud.
Set up a Grafana Cloud account
Log in to your Grafana Cloud account if you already have one, or sign up for a free account.
Open https://grafana.com/ and click on My Account. Scroll down to the Manage your Grafana Cloud Stack section. Find the Loki block and click the Send Logs button.

Scroll down to the section Sending logs from a standalone host. Click the Generate now link to generate your API Key.
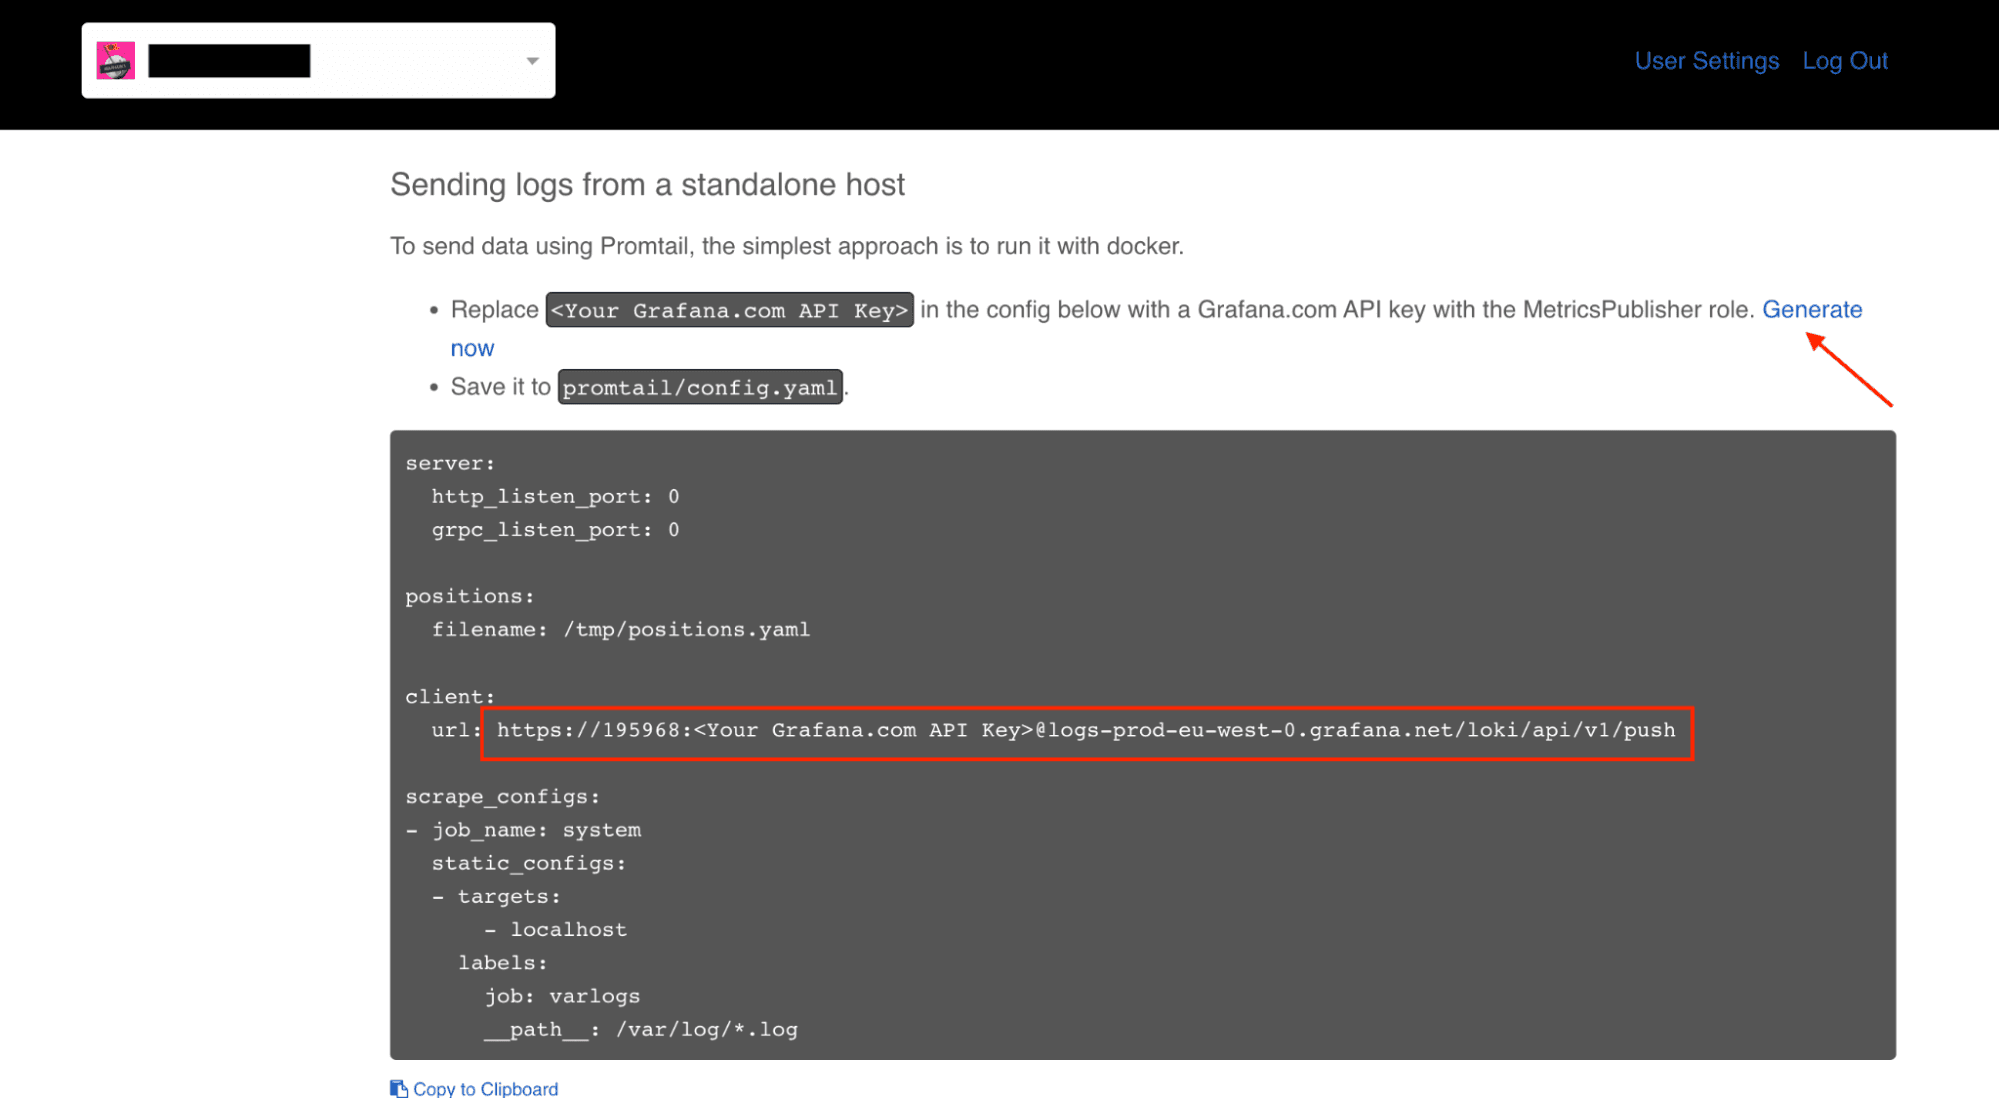
You will see a pop-up with Create an API Key form. Enter the key name and choose the Metrics Publisher role from the select box. After the API Key is generated, the client URL in the config sample will be modified. The proper API Key would substitute \ string. Copy the url https://<User>:<API Key>@logs-prod-eu-west-0.grafana.net/loki/api/v1/push. We will use it in the OpenTelemetry Collector config file later.
Download the last version of OpenTelemetry Collector
You can download the binary for most architectures/OS on GitHub for v0.49.0 or later versions, if available.
In this guilde, I’m using Mac OS as an example:
$ wget https://github.com/open-telemetry/opentelemetry-collector-releases/releases/download/v0.49.0/otelcol-contrib_0.49.0_darwin_amd64.tar.gz
$ gunzip -c otelcol-contrib_0.49.0_darwin_amd64.tar.gz | tar xopf -
{ .overflow-wrap-anywhere }
Fluent Forward receiver
This receiver runs a TCP server that accepts events via the Fluent Forward protocol. In this example, we will collect logs from the Docker container and send them to Grafana Loki.
Prepare OpenTelemetry Collector config file
Create file config.yaml:
receivers:
    fluentforward:
        endpoint: 127.0.0.1:24224

processors:
    batch:

exporters:
    logging:
        logLevel: debug

    loki:
        endpoint: "https://<User>:<Your Grafana.com API Key>@logs-prod-eu-west-0.grafana.net/loki/api/v1/push"
        tenant_id: "example1"
        labels:
            attributes:
                container_name: ""
                container_id: ""
service:
    pipelines:
        logs:
            receivers: [fluentforward]
            processors: [batch]
            exporters: [logging, loki]
Attributes container_name and container_id are valid Loki labels, that’s why mapping is not needed, and we can leave empty strings. Then run:
$ ./otelcol-contrib --config ./config.yaml
Now OpenTelemetry Collector is running.
Set up Docker container to send logs to Grafana Loki
Let’s run the Ubuntu image in the Docker container, which will produce logs to stdout each second.
For Mac OS and Windows:
$ docker run --rm --log-driver=fluentd --log-opt fluentd-address=host.docker.internal:24224 ubuntu sh -c "while true; do echo Hi Loki \$(date); sleep 1; done"
{ .overflow-wrap-anywhere }
Now you can open Grafana in Grafana Cloud, go to Explore, choose Loki, and see logs:

Filelog receiver
Filelog receiver tails and parses logs from files. In this example, we will tail system logs and send them to Grafana Loki.
Prepare OpenTelemetry Collector config file
Create file config.yaml:
receivers:
    filelog:
        include: [/var/log/*.log]

processors:
    batch:

exporters:
    logging:
        logLevel: debug

    loki:
        endpoint: "https://<User>:<Your Grafana.com API Key>@logs-prod-eu-west-0.grafana.net/loki/api/v1/push"
        tenant_id: "example2"
        labels:
            attributes:
                log.file.name: "filename"
service:
    pipelines:
        logs:
            receivers: [filelog]
            processors: [batch]
            exporters: [logging, loki]
We specified attributes mapping here log.file.name: "filename". Because Loki only accepts labels that match ^\[a-zA-Z_]*$, we need to provide mapping from record attribute name to Loki label. It can be any string that matches the regex. I chose "filename".
Then run:
$ ./otelcol-contrib --config ./config.yaml
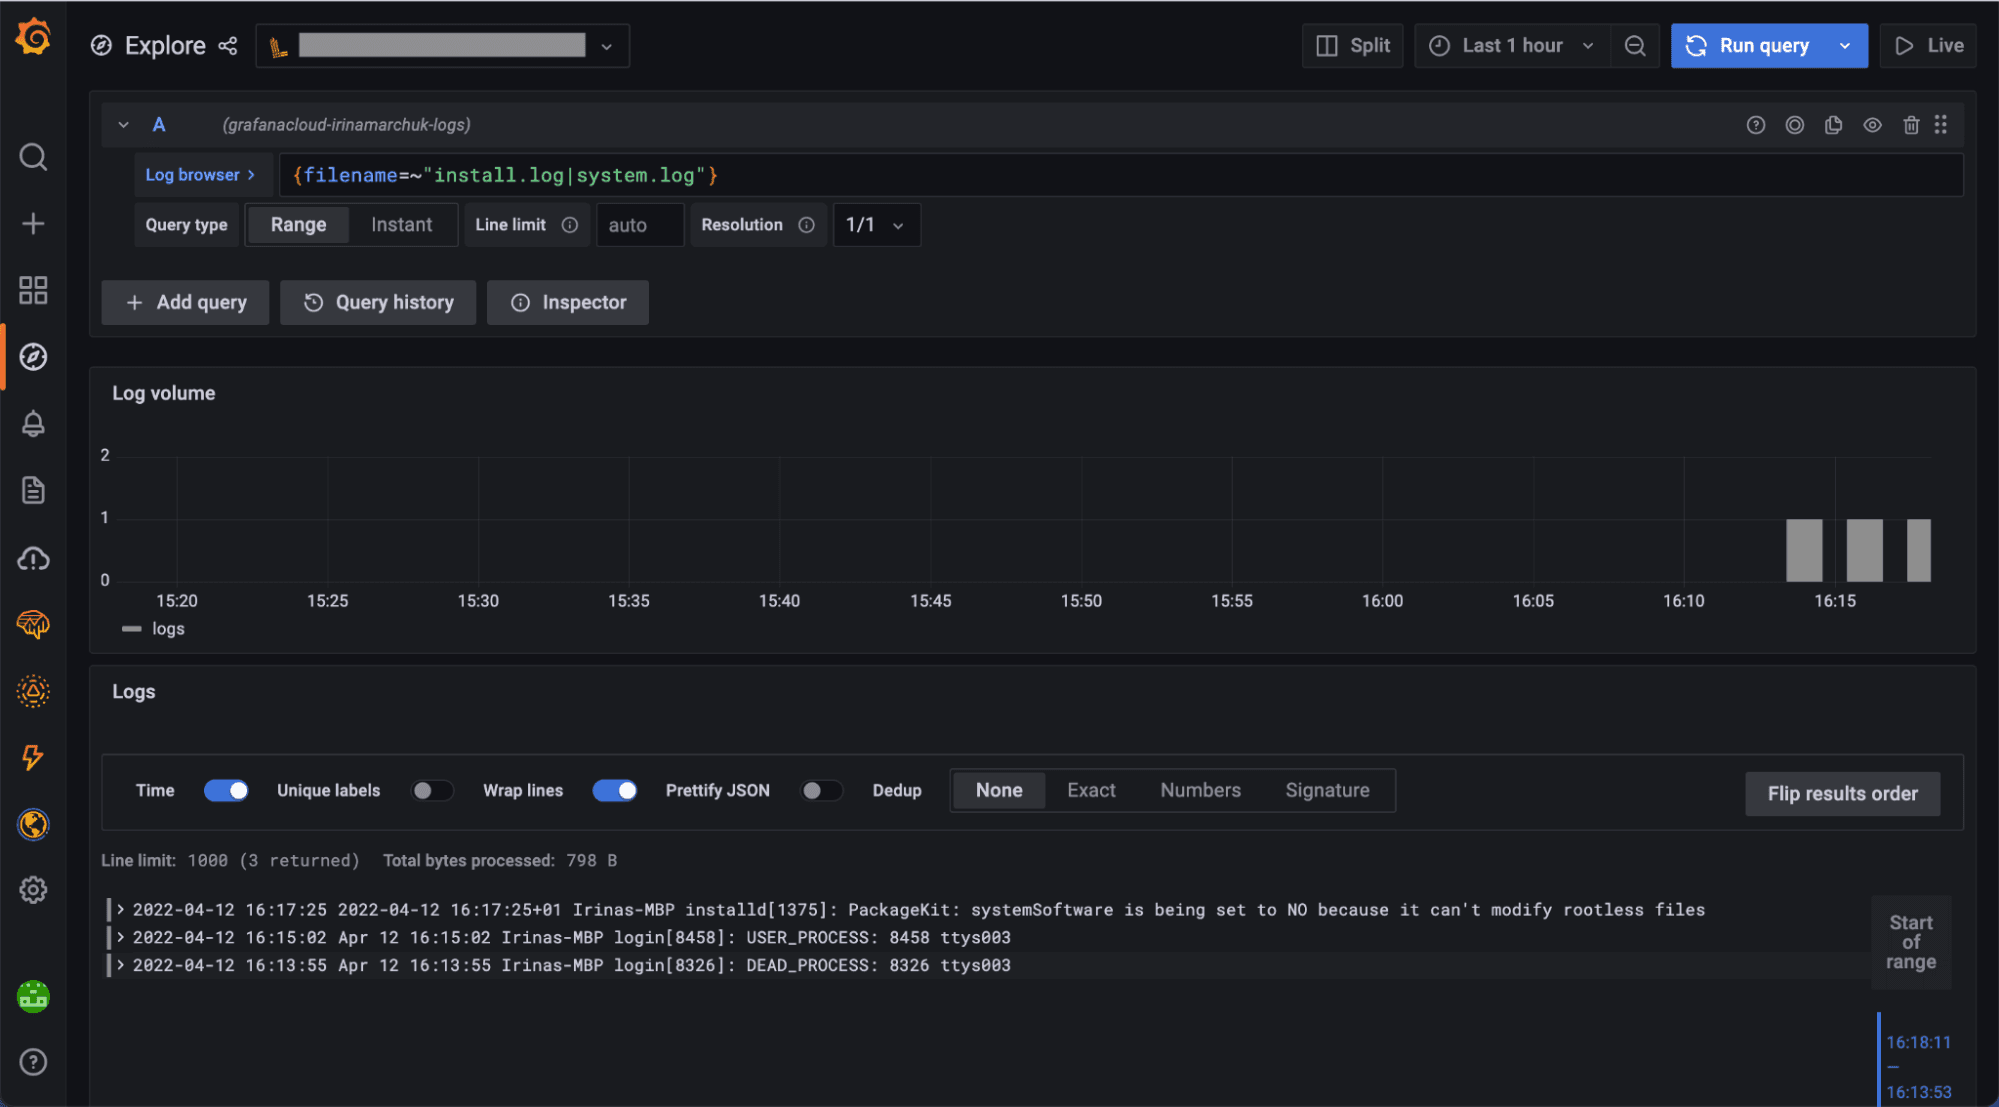
Now you can open Grafana in Grafana Cloud, go to Explore, choose Loki, and see logs:
Using both Fluent Forward and Filelog receivers
The OpenTelemetry Collector can use more than one receiver. The config with both receivers will look like:
receivers:
  filelog:
    include: [/var/log/*.log]
  fluentforward:
    endpoint: 127.0.0.1:24224

processors:
  batch:

exporters:
  logging:
    logLevel: debug

  loki:
    endpoint: "https://<User>:<Your Grafana.com API Key>@logs-prod-eu-west-0.grafana.net/loki/api/v1/push"
    tenant_id: "example2"
    labels:
      attributes:
        log.file.name: "filename"
      container_id: "",
      container_name: ""
service:
  pipelines:
    logs:
      receivers: [filelog, fluentforward]
      processors: [batch]
      exporters: [logging, loki]
Then run:
$ ./otelcol-contrib --config ./config.yaml
Now you can open Grafana in Cloud, go to Explore, choose Loki, and see logs coming from both the Fluent Forward and the Filelog receivers.
Summary
In this guide, we provided all the steps you need to configure the OpenTelemetry Collector to collect container logs and system logs with Fluent Forward and Filelog receivers and send them to Grafana Loki in Grafana Cloud.
This should be a good start to adopting the OpenTelemetry Collector for collecting logs. The OpenTelemetry Collector can also be used for distributed tracing with Grafana Tempo and forcollecting metrics to round out your observability story.
If you’re not already using Grafana Cloud — the easiest way to get started with observability — sign up now for a free 14-day trial of Grafana Cloud Pro, with unlimited metrics, logs, traces, and users, long-term retention, and access to one Enterprise plugin.

