GrafanaCONline 2022 Day 2 recap: Grafana 9, Grafana Mimir, Grafana Tempo demos, new hackathon projects, and more
The excitement around GrafanaCONline 2022 continues to soar after another day filled with demos of new features and functionalities in Grafana 9, Grafana Mimir, and Grafana Tempo. Plus we learned how a mini arcade turned into a Grafana display; how Grafana transformed into a health tracker, and how, yes, Grafana can run Doom.
You can still tune into GrafanaCONline 2022 live (for free!) for today’s lineup of awesome speakers, or you can sign up to get notified about on-demand access to all our session recordings, which will be available after GrafanaCONline ends.
If you didn’t get a chance to watch all of the incredible talks on Day 2 of GrafanaCONline 2022, here’s what you missed.
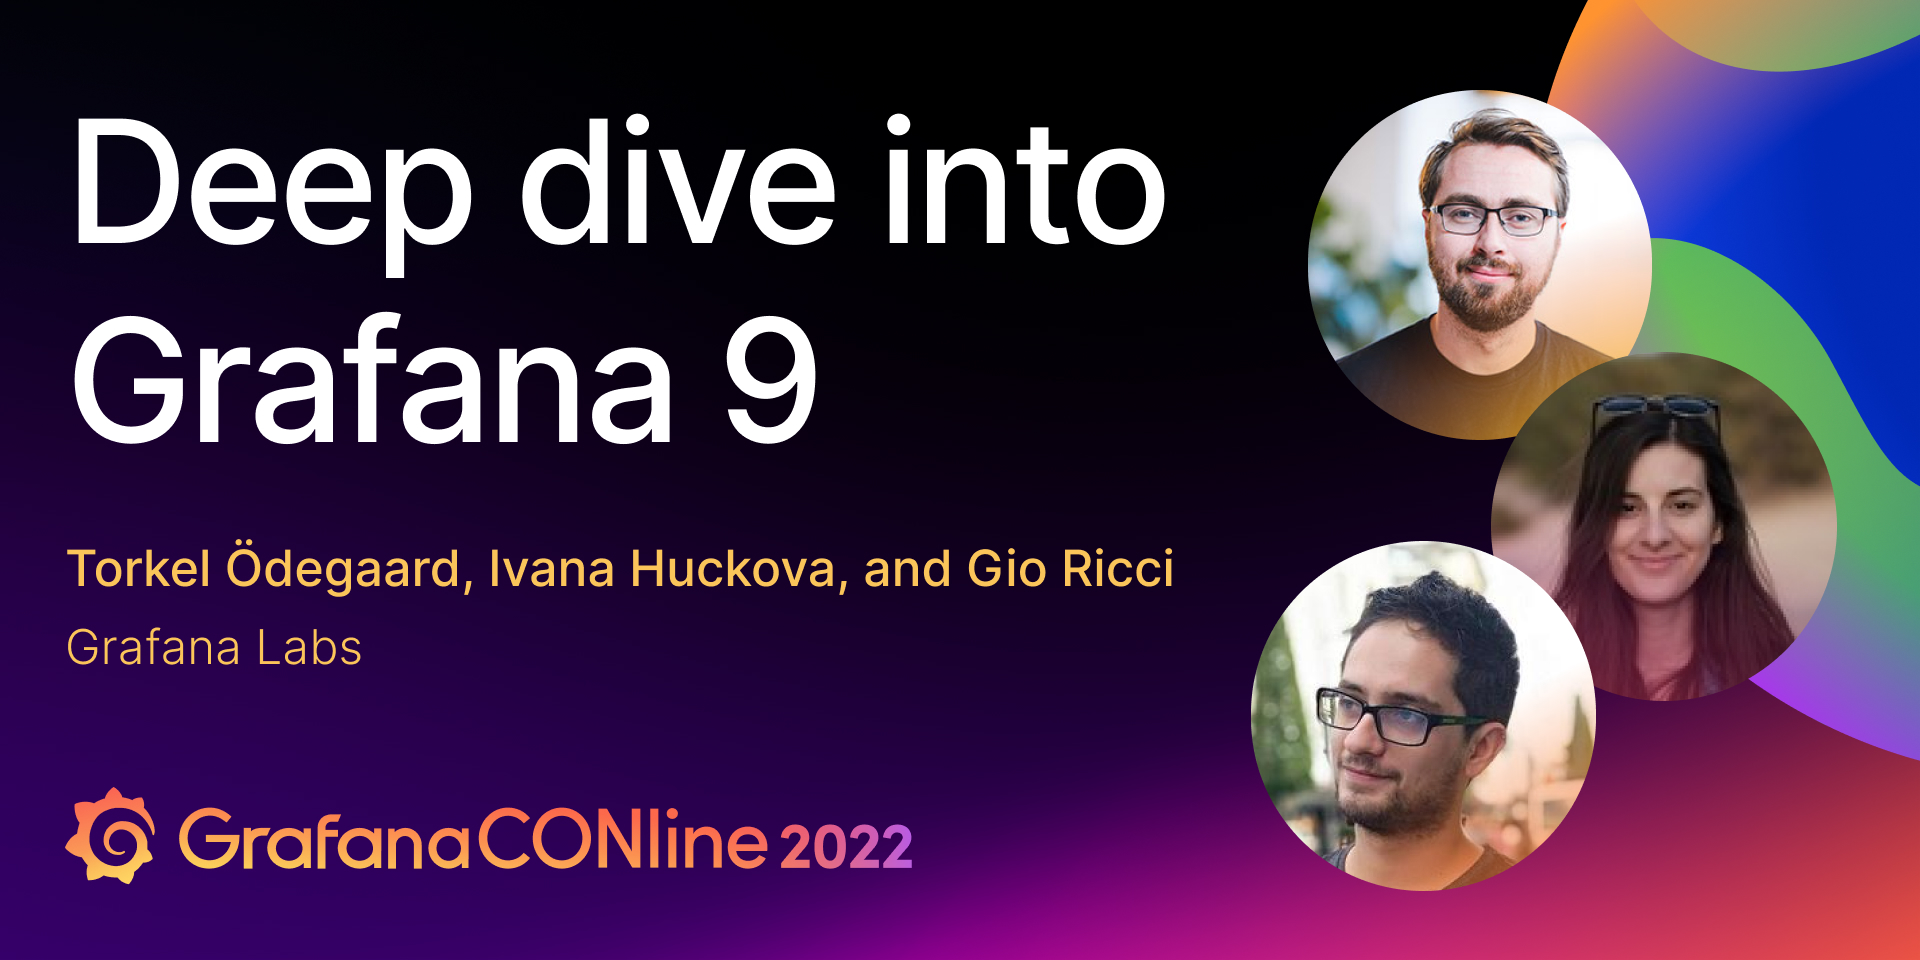
Deep dive into Grafana 9
After the official release of Grafana 9.0 during the opening keynote of GrafanaCONline 2022, Grafana creator and Grafana Labs CGO and Co-founder Torkel Ödegaard returned to showcase all the latest and greatest features in Grafana 9.0. (He even created his entire presentation inside Grafana!) Joined by Ivana Huckova and Giordano Ricci, the team walked through the four main pillars behind the latest release: ease of use, visualization, reporting, and security.
In this Grafana 9 session, you’ll see how the latest search, navigation, and accessibility improvements will make monitoring, observability, and data visualization easier and more accessible to more users. Visualization suggestions and the new Prometheus and Grafana Loki query builders will help you build even better and more impactful dashboards. There are also demos of the command palette, full-range log volumes, and much, much more.
Sign up for on-demand access.
Using Grafana and machine learning for real-time microscopy image analysis
Theia Scientific provides real-time image and data analysis automation technology for scientists and engineers who conduct research utilizing optical, electron, and X-ray-based microscopy instrumentation in network- and time-constrained environments.
Here, Theia’s production team demonstrated the deployment of machine learning (ML) models on an edge computing device for real-time microscopy image analysis, using Balena for remote device management and Grafana for application control and visualization. Custom panel plugins and dashboards packaged as a Grafana application are combined with a container-based, multi-service architecture to present scientists and engineers using electron microscopes with a coherent and customizable platform for automated image analysis. With the help of Grafana, the project cut labor costs by 80%, reduced training time and operational expertise needed, and accelerated the delivery of unbiased results from years, months, and days to just seconds.
Sign up for on-demand access.

For billion-series scale or home IoT projects, get started in minutes with Grafana Mimir
Grafana Mimir is a new open source distributed TSDB for Prometheus that lets you scale your metrics to a billion active series and beyond. Grafana Mimir offers high availability, horizontal scalability, multi-tenancy, durable storage, and blazing fast query performance over long periods of time. In this session, the project’s maintainers will show how to get started with Mimir, migrate your metrics in minutes, and they’ll also talk about the engineering and technical documentation work that went into ensuring that Mimir is easy to operate.
Sign up for on-demand access.

A beginner’s guide to hacking electronics to display Grafana dashboards
You never know what swag you’re going to bring home from a conference. For a Wix internal conference, employees were given a mini arcade machine, which has since collected dust on the desk of Wix Infrastructure Team Lead Yonatan Mevorach.
While working from home during the pandemic, the Wix.com team launched a new service, and it was important for Yonatan to keep tabs on its metrics. The problem was that he didn’t have a second monitor just for Grafana dashboards like they did in the office. The solution? Yonatan decided to transform the mini arcade machine into a Grafana monitor. Even though he knew nothing about electronics, soldering, or tinkering with hardware in general, Yontan transformed into a hardware hacker and built a Raspberry Pi Grafana arcade machine — and he shared tips on how you can do the same. Game on!
Sign up for on-demand access.

Beyond tracing with Grafana Tempo: What do we do with all this data?
From the beginning, Grafana Tempo established itself as a high-volume, low-cost tracing store. However, it was limited in that it could only retrieve traces by ID. Traces are inherently rich with data about the state of applications that Tempo largely ignored. Today this changes!
Watch this session to see a stack of new Tempo OSS features that dig deep into the data and give you insights into your applications that are only achievable via distributed tracing. You can also see demos on:
- Metrics derived from traces to build service graphs and drive new Grafana visualizations.
- Deep dive into upcoming columnar formats using Apache Parquet that will enable rich trace analysis using Tempo and other tooling.
- A new query language to search and derive metrics from traces.
Sign up for on-demand access.
How Optum uses Grafana Enterprise for a top-to-bottom view of its healthcare website
Less than 3 seconds. That’s the amount of time the portal monitoring team at Optum has to load a page before losing customers on their healthcare website and taking a hit in their customer satisfaction score.
In this presentation, Mark Smith, Team Lead for the Portal Monitoring team at Optum, showed how his team uses Grafana Enterprise and a variety of Enterprise data source plugins (Datadog, New Relic, Elasticsearch, ServiceNow, Splunk, and more) for a project that looks at the website, starting with the user experience (page level) down to the infrastructure and visualizes different performance metrics with Grafana. Mark also talked through the direct correlation between technical capabilities and business success and how he proves that the technology investments within the company provide incredible value. “If you have a high customer satisfaction rating, your company’s financial performance does better,” says Mark.
Sign up for on-demand access.
How Grafana helped me get healthier
If you can use Grafana to monitor metrics on your websites, why not use it for metrics about yourself? Senior Software Engineer Kristina Durivage discussed how to use a body composition scale for a IoT project that brings data into Grafana and displays it so you can monitor your progress toward whatever your fitness goals may be.
Sign up for on-demand access.
Grafana Labs hackathon showcase: Doomfana, real-time drone tracking, and a panel plugin for geospatially aware data
Over the past year, Grafana Labs has held regular company-wide hackathons: a week for Grafanistas to unlock their creativity and think outside the box (but often within a panel). During the hackathons, Grafanistas from all over the org joined forces to invent, build, and solve challenging technical problems related to our products, community, and business. In this session, three teams shared demos of their fantastic hackathon projects:
- Can Grafana run Doom? You bet! (Can the Grafana blog run a story about it? Yes, we did.)
- Real-time drone tracking and management, leveraging Grafana Live.
- Panel plugin for enriched, geospatially aware data.
Sign up for on-demand access.
Don’t miss today’s GrafanaCONline 2022 sessions!
Alerting in Grafana 9: What’s new and improved
8:00 PDT, 17:00 CEST, 15:00 UTC
with Farhan Manjiyani and Gilles De Mey from Grafana Labs
How Grafana unified alerting powers Torqata’s data health scorecard system
8:30 PDT, 17:30 CEST, 15:30 UTC
with Marie-Claire Kore and AJ Pryor from Torqata
Grafana Loki: The road to higher scales and lower latencies for logs
9:00 PDT, 18:00 CEST, 16:00 UTC
with Owen Diehl and Cyril Tovena from Grafana Labs
Monitoring battery-operated NBIoT sensors with Grafana and Grafana Loki
9:30 PDT, 18:30 CEST, 16:30 UTC
with Ioannis Nikolaou and Marios Klavdianos from Fuelics
UX best practices for a dashing dashboard
10:45 PDT, 19:45 CEST, 17:45 UTC
with Joe Kim, Pauric O’Callaghan, and Leah Ujda from Grafana Labs
Formula 1 telemetry analysis with Microsoft Azure Data Explorer (ADX) and Grafana Cloud
11:15 PDT, 20:15 CEST, 18:15 UTC
with Anshul Sharma from Microsoft
On Medallia’s journey to centralized observability, Grafana dashboards united it all
11:45 PDT, 20:45 CEST, 18:45 UTC
with David Howard, Vic Thomas, and Anugrah Vijay with Medallia
Check out the full GrafanaCONline 2022 schedule here.
And don’t forget you can connect with the Grafana community and get the latest updates from the Grafana Labs team during the event on the Grafana Labs Community Slack. Join the #grafanacon channel.

