How I installed Grafana Mimir on my homelab cluster
When I started at Grafana in January, I was accustomed to working with private clouds and on-prem infrastructure, so nearly everything in my role here as a senior software engineer for the Grafana Mimir customer squad was new to me. I was new to Golang, Docker, Kubernetes, gRPC, public cloud services, etc.
Kubernetes has been especially challenging. In my work on Grafana Mimir and Grafana Enterprise Metrics, I experience k8s in one of two extremes. For local development, I spin up everything in Docker or k3d. I can break or debug whatever I want, which is great for code development, but I don’t get the feel of working with a “real” cluster.
On the other extreme, I work with our cloud clusters, which are very real and quite performant. However, the goal is to meet our SLOs and not break things, so the interactions I have with these clusters tend to be in carefully planned rollouts of new releases and changes.
What I needed was a middle ground to accelerate my Kubernetes competency: a physical multi-node cluster where I could run things at a small but non-trivial scale and break stuff repeatedly.
Enter my homelab cluster, a.k.a. the “beehive.”
Homelab configuration
This is the “beehive.”

It’s so named because of the Beelink Mini PCs and the custom Lego rack my son helped me build. I think a beehive is also an appropriate metaphor to describe a Kubernetes cluster. A flurry of activity with each microservice (bee) performing its assigned role, each pod (honeycomb cell) isolated with the resources it needs, and the whole thing is invisibly orchestrated and highly efficient.
Hardware configuration
I originally intended to build a Raspberry Pi-based cluster; however, currently RPi’s are nearly impossible to procure, unless you’re willing to pay significantly higher than retail. Instead, I purchased 4 Beelink Mini PC’s to use as Kubernetes nodes. Each unit is roughly equivalent to a Raspberry Pi 4:
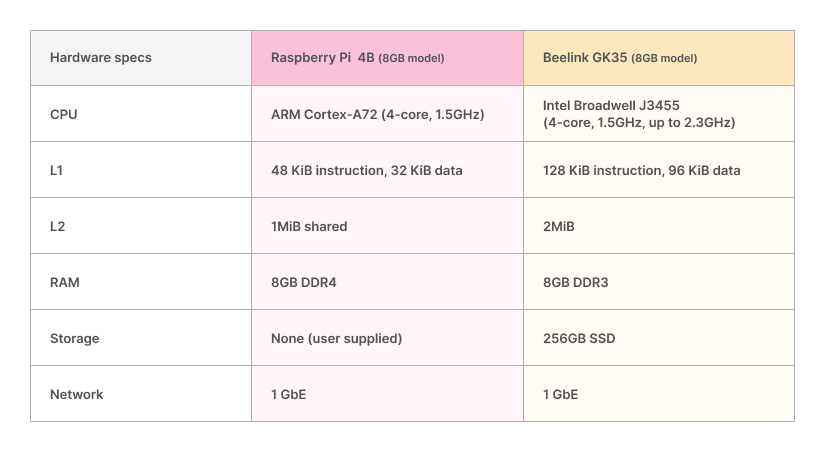
I was unfamiliar with Beelink, so the table above is a handy guide to compare specs with the well-known Raspberry Pi 4B. In the end, I’m glad I ended up with the Beelink units for the following reasons:
- The price was higher than the retail price of the 8GB Raspberry Pi 4B, but similar or less than the current price from RPi resellers in today’s supply constrained market.
- I’m pleased with the CPU performance. With turbo enabled, the frequency is 53% higher on the Beelink. Just as important, the Beelink has larger L1 and L2 caches. The hit performance from these caches is critical to the overall CPU performance of microservices.
- Related to the previous point, by using an x86_64 micro-architecture, workloads can take advantage of vectorized operations through SSE, AVX, etc. Much of the software we use is compiled to use these SIMD optimizations for x86_64 CPUs. Modern ARM-based CPU’s have a SIMD unit called Neon, but code must be compiled to use it. Operations like crc32 are ubiquitous in RPC and storage-based workloads, and they are greatly sped up by vectorized instructions.
- The Beelink comes with an SSD, one less thing to buy.
- The Beelink comes with a chassis, fans, etc. The only thing I had to build was the Lego “rack.”
The other crucial piece of my homelab infrastructure is a TrueNAS server I built last year. Besides having 70TB of storage (42TB usable), it provides S3 storage for Grafana Mimir, NFS storage for Kubernetes volumes, a Nexus private Docker registry, and has VM’s for Pi-Hole (DNS) and Traefik (reverse proxy). Below is a diagram showing my homelab configuration:

Installing Kubernetes
Being completely new to Kubernetes, I started by joining the #homelab Slack group at Grafana Labs and asking my coworkers questions. Ed Welch gave me a lot of good advice. In fact, I got the idea to build a homelab cluster after seeing his 5-node RPi cluster in the background during meetings. He suggested I use the k3s distribution, which is optimized for resource-constrained nodes.
After settling on k3s, I watched lots of YouTube videos. It’s like that old adage, “measure twice, cut once,” but with YouTube tutorials it’s “watch thrice, deploy twice,” because you’ll definitely get it wrong the first time. In particular two channels were immensely helpful:
- Techno Tim - All things homelab, k3s bring-up
- TechWorld with Nana - All things k8s
I installed an Ubuntu Server on the Beelink nodes. I then used the Ansible-based approach described in the video below to install a fully configured k3s HA cluster with extra goodies like kube-vip and MetalLB.
Both kube-vip and MetalLB solved problems I experienced during earlier attempts at bringing up k3s more manually, namely having a single IP to represent the cluster on the frontend which load balances among the control plane, and a pool of IPs to assign to services via the LoadBalancer type so they can be accessed from outside the cluster.
At this point I had a fully functioning cluster, so I experimented with adding MySQL and MongoDB via Helm charts. I actually started using the MySQL deployment by populating weather and air quality data from Go programs using the OpenWeatherMap API that I had written earlier.
This is what the cluster looked like before moving on to the Prometheus and Mimir installation:

Installing Prometheus
I decided to install the Prometheus operator via Helm. Just as with the k3s install, with Prometheus it took a couple of attempts and restarts to get everything the way I wanted it. I ended up following the steps in this video:
The only change I made to the default chart values was to set up the remote write config since I knew I would be installing Grafana Mimir next.

The remote write config contained:

There are two advantages to deploying Prometheus with the kube-prometheus-stack Helm chart:
- It comes pre-configured with a number of exporters and dashboards meant to monitor Kubernetes and the nodes. It ships with a Grafana pod that has all of the dashboards ready to view. I ended up using this same pod for my Mimir and personal dashboards.
- It’s easy to add additional exporters and have their metrics scraped by Prometheus via ServiceMonitor configs. There is a “Part 2” video to the one linked above that goes through the process of setting this up for MongoDB. I was able to follow that tutorial then use the same process to add MySQL metrics to Prometheus. The Mimir Helm chart also uses a ServiceMonitor to feed metrics to Prometheus.
Once the operator and additional exporters were installed, I verified that I could connect to both Prometheus and the Grafana pods via port-forwarding and execute some queries. Finally, it was time for Grafana Mimir.
Installing Grafana Mimir
Installing the Mimir Helm chart is a simple two liner:
❯ helm repo add grafana
https://grafana.github.io/helm-charts ❯ helm install mimir grafana/mimir-distributed -f mimir.yamlHowever, there are some configuration details to override in the values file that will be specific to your cluster. In my case, these were the areas to configure:
- ServiceMonitor for Prometheus
- Object storage
- Features & component counts
ServiceMonitor
Let’s start with the ServiceMonitor as it was the most straightforward. Below is the relevant section in the values file.
serviceMonitor:
  enabled: true
  namespace: default
  namespaceSelector:
    matchNames:
      - default
  labels:

    release: kube-prometheus-stack
The key part here is the label release: kube-prometheus-stack, which is what allows the Prometheus operator to discover which exporter services to scrape. This portion may be a little different depending on how Prometheus is deployed.
Once this was installed, I verified through the Prometheus interface that the Mimir metrics were being scraped. Then I followed the instructions in the Grafana Mimir documentation to build the Mimir dashboards. This produced a set of JSON files that I could import into the Grafana pod that was created by the Prometheus operator.
Object storage
The storage configuration can be altered by copying and pasting the full multi-line string in the mimir->config section of the values file, then making changes as necessary. There are three parts to configure, corresponding to the three components that use object storage: alertmanager_storage, blocks_storage, and ruler_storage. It’s the same process for each, but I’ll show the ruler_storage stanza as it’s short.
Here’s what the default stanza looks like
{{- if .Values.minio.enabled }}
ruler_storage:
  backend: s3
  s3:
    endpoint: {{ .Release.Name }}-minio.{{ .Release.Namespace }}.svc:9000
    bucket_name: {{ include "mimir.minioBucketPrefix" . }}-ruler
    access_key_id: {{ .Values.minio.accessKey }}
    secret_access_key: {{ .Values.minio.secretKey }}
    insecure: true

{{- end }}
and here is what it looks like after customizing for the S3 bucket on my TrueNAS server:
ruler_storage:
  backend: s3
  s3:
    endpoint: 192.168.4.200:29000
    bucket_name: mimir-ruler
    access_key_id: mimir
    secret_access_key: NOT_MY_ACTUAL_SECRET_KEY

    insecure: true
As you can see, I removed the Go templating and used the endpoint, bucket name, and S3 credentials I configured in my TrueNAS server. I configured three separate buckets named mimir-alert, mimir-ruler, and mimir-tsdb.
After installing the Helm chart and waiting awhile, I could see data starting to show up in the bucket from my object store web interface:

Features & component counts
I experimented with enabling memcached and with the number of ingesters. The former can be enabled/disabled individually in the memcached, memcached-queries, and memcached-metadata sections of the values file. In the end, my nodes were quite unhappy about memcached. There was simply not enough headroom with only 8GB of RAM per node. I definitely don’t need memcached either with the low load level I’ll be putting on the system.
The component count was really a bit of a mystery to me, as I had only ever used Mimir on a laptop or an enterprise-level cluster. There are some nice templates in the Helm chart repo for various sized clusters. For simplicity, I settled on the default values, and so far it has worked well, albeit a bit overkill for my small cluster.
At last, I had Grafana Mimir up and running on the beehive.
Kicking the tires
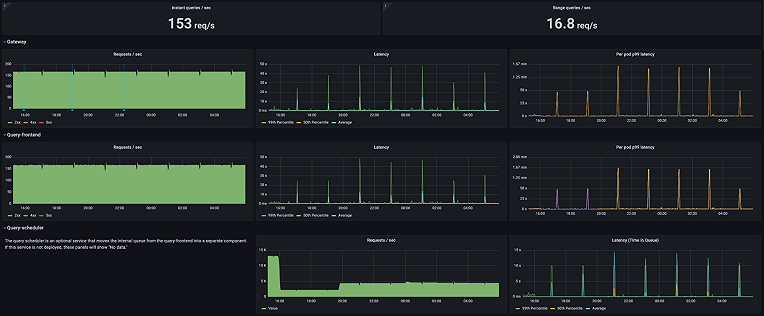
After looking through the Mimir dashboards and watching the object store start to fill up, I decided to create an overall status dashboard. The dashboard (below) showed overall hardware utilization metrics, temperatures, and component counts and other basic info for Grafana Mimir.

Besides giving me a quick view of cluster and Mimir health, having the dashboard off to one side and refreshing every 30 seconds also put some query load on Mimir. (BTW, ignore the active series number, my query was incorrect.)
As of this writing, I’ve torn down the old config, and I’m experimenting with a slightly different Prometheus + Grafana Mimir setup. As you can see from the memory usage, there was an imbalance, and beehive3 had both the Prometheus operator and an ingester, which I don’t like. That’s the great part about having a homelab cluster like this, I can tear it down and build it up as many times as I want, and I’ll learn something new each time.
Summary
Bringing up a Kubernetes cluster from scratch and installing Grafana Mimir gave me a deeper understanding of our newest open source product and the value it adds. Operationally, it gave me a good baseline for performance expectations based on cluster size. When I look at our cloud clusters, I have more insight into how data flows through the components, and more respect for how well everything scales.
Lastly, I had a lot of fun.
Thanks to everyone who helped answer my numerous questions, especially Ed Welch, Patrick Oyarzun, Krajo Krajcsovits, Tyler Reid, and my manager, Matt Mendick.
Grafana Cloud is the easiest way to get started with metrics, logs, traces, and dashboards. We have a generous free forever tier and plans for every use case. Sign up for free now!