
Grafana for business intelligence: How Grafana Labs uses dashboards for more than observability data
Having joined Grafana Labs as one of our first data & analytics hires, I spent much of my time in the first few months considering how we should structure our data stack to optimize for a quick path to value, while allowing our small data team to scale going forward.
The challenges we faced were a perfect fit for the modern data stack (MDS), a recent term within data & analytics encompassing cloud-native tools that take care of the infrastructure previously associated with building data pipelines, warehousing, and transformation and allow analysts and engineers to focus more of their time on delivering business value.
Here’s how we’ve implemented the modern data stack at Grafana Labs, and in particular, why we decided to incorporate Grafana for business intelligence as our visualization layer.
Before we get started … what is Grafana?
Grafana is an open source visualization toolthat allows users to query, dashboard, alert on, and understand your data, no matter where it is stored. This “big tent” philosophy — that we strive for interoperability regardless if your data is stored with Grafana or a different vendor — is ingrained in our culture and company values.
Grafana’s origins were primarily in observability, providing developers and devops engineers tools to analyze, visualize, and alert on their systems data; however, as an extensible platform for querying multiple data sources, we’ve always seen customers pull relevant business metrics to complement their observability data:
Internally at Grafana Labs we set out to take this elusive “single pane of glass” to the extreme and lean on Grafana for business intelligence as our main solution.

Above: A demo dashboard we created using dbt, BigQuery, and Grafana Cloud using data about Citi Bike usage in New York City. See details below
Why do we use Grafana for business intelligence at Grafana Labs?
- Dogfooding - We very often leverage our own products at Grafana Labs, and using Grafana for business intelligence was no different. It allowed us to test our product capabilities and provide feedback on Grafana panels and data sources.
- Meet our users where they are - Our engineering teams were already using Grafana on a daily basis for our systems data so we extended this “single-pane-of-glass” approach to our business data.
- Integration with our modern data stack - By using Grafana for business intelligence, we extend “SQL as the language of data” from BigQuery and dbt to our data visualization layer.
- Interactive dashboards out of the box - Grafana dashboard panels have interactivity built in by default (e.g., hover tools, time selection via click & drag, show/hide series), and can be easily augmented with dashboard variables.
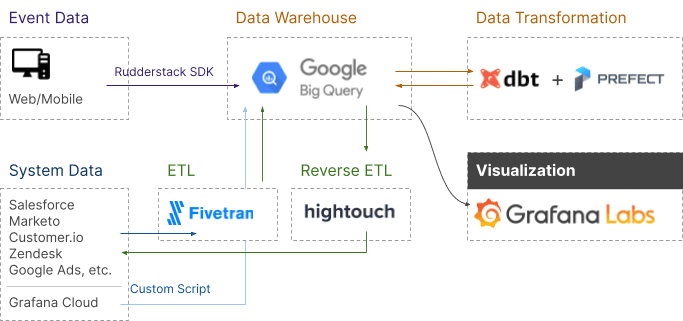
Architecture behind Grafana Labs’ modern data stack
At Grafana Labs, we decided on a modern data stack for many of the same reasons other teams do: It allowed us to quickly get up and running to prove value with just our small initial team. Additionally, it provided us a strong foundation to scale our data & analytics practice: standardized data definitions, version control/testing, modular code, and iterative improvements.
Our modern data stack consists of:
- ELT/ETL (extract, transform, load): Fivetran
- Event streaming: Rudderstack (self-hosted open source)
- Data warehouse: BigQuery
- Data transformation: dbt CLI (self-hosted open source)
- Orchestration: Prefect (self-hosted open source)
- Reverse ETL: Hightouch
- Visualization: Grafana Cloud
Here is a diagram of our data stack:
How Grafana integrates with our modern data stack
Our “big tent” philosophy encourages users to connect their data, no matter where it lives. In our modern data stack, we’ve used BigQuery as our data warehouse, and thus leverage our recently released Grafana BigQuery data source to bring data to our dashboard panels.

Above: Grafana’s BigQuery data source allows users to use SQL to bring in data for visualization.
Additionally, using Grafana for the visualization layer has also allowed us to have a distinct “separation of duties” — leveraging dbt for its strengths in modeling our raw data and allowing the SQL in Grafana to focus solely on data visualization.
Lastly, Grafana also has a number of features that we’ve used for data governance and discovery:
- Teams - manage user permissions and access to dashboard folders
- Dashboard tags - group dashboards for greater data discovery (e.g., related dashboards)
- Custom homepage - single starting point for quick access to curated business intelligence dashboards
- Annotations - easily highlight notable commentary
- Collaboration features like team presence
Demo Grafana dashboard
If you want to jump right in and see a demo dashboard we created, it is hosted on Grafana Play, our public facing demo Grafana instance.
Data set: Citi Bikes in New York City
For this demo dashboard we used BigQuery’s free tier and public data set (bigquery-public-data.new_york_citibike), dbt Cloud free developer tier, and Grafana Cloud’s forever free plan.
This dashboard shows some high-level stats on the NYC Citi Bike program from April 2017 to May 2018 and is intended to highlight some of the features and interactivity that you get with Grafana dashboards.
From Google’s BigQuery docs:
“Citi Bike is the nation’s largest bike share program, with 10,000 bikes and 600 stations across Manhattan, Brooklyn, Queens, and Jersey City. This data set includes Citi Bike trips since Citi Bike launched in September 2013 and is updated daily. The data is processed by Citi Bike to remove trips that are taken by staff to service and inspect the system and any trips below 60 seconds in length, which are considered false starts.”
How the demo works

If you’d like to see more details about how we set up the dashboard, the hosted version allows you to enter edit mode and view the SQL and the options we’ve selected. Additionally, you can reference the dbt project.
We’d love your feedback
Lastly, we’d love to hear from you! Grafana is open source, and we highly encourage community participation. Additionally, our BigQuery plugin has recently been released, and we are actively seeking user feedback & interviews. If you’re interested in sharing your thoughts, please find us on the Grafana Labs Community Slackin the #business-intelligence channel.

