
Scaling Grafana Mimir to 500 million active series on customer infrastructure with Grafana Enterprise Metrics
Update: For those who want reproduce the load test within this blog post, you can find the k6 script on GitHub.
At Grafana Labs, we’ve seen an increasing number of customers who are scraping hundreds of millions of active time series but need a solution to reliably store and query such a huge amount of data.
So in March, we announced our new open source TSDB, Grafana Mimir, the most scalable, most performant open source time series database in the world. We wanted to make sure that Grafana Cloud, which runs on Mimir, could comfortably support metrics at a massive scale before unlocking it for our customers, so in 2021, we performed extensive load testing on Mimir with 1 billion active series (yes, 1 billion).
We also had the opportunity to test the limits of Grafana Enterprise Metrics, which runs on Mimir as well. Grafana Labs was approached by a customer with extremely high scalability requirements that wanted to stress test a sustained load of 500 million active series for 2 weeks in a stable state. No other vendor had been able to meet these requirements for this customer, giving Grafana Labs an opportunity to partner with them as the experts on Prometheus at scale. In February 2022, we met with the GEM customer and established the goals for our test:
- 500 million active series with up to 5 million cardinality per metric
- 10,000 queries per minute
- 72 hours of sustained operations
In this blog post, we will run through each stage of how we worked cooperatively with the customer on a large-scale test and successfully scaled Grafana Mimir on the customer’s infrastructure using Grafana Enterprise Metrics.
First load test: 50M active series, 100 queries per minute
For this customer, we learned that using our cloud was off limits. Instead, we would need to run Grafana Enterprise Metrics, our on-prem enterprise metrics solution based on Grafana Mimir. We needed to use the customer’s cloud so we decided to build out a mirror environment in AWS using an EKS cluster with a similar configuration to the customer’s environment, just smaller. And we started by first deploying GEM via Tanka and running a basic load test at 50M active series.
To reach our first benchmark, we decided to increase the internal load incrementally using Grafana k6 Cloud testing along with error and latency results from Grafana k6, tweaking things along the way to stabilize the cluster. Note that we now offer Grafana Cloud k6: our performance testing solution in Grafana Cloud.
Ultimately, we ended up running ingesters with 10x the normal active series we usually run — 15M vs 1.5M — to reduce the number of replicas required. Reducing the number of replicas required is important for two reasons: It reduces pressure on the gossip cluster used to store the ingester’s ring, and it reduces the time taken to roll out configuration updates to every ingester. We knew we’d be tweaking the ingester configuration a bit as we scaled up to 500M, so having relatively quick rollouts would be vital to making progress efficiently. (For reference, when we performed load testing for 1 billion active series, we ran with 5M active series per ingester.)
We were able to deliver an initial set of Kubernetes manifests to the customer that showed we were capable of running with 50M active series and 100qpm. So we thought the next steps were simple: From here we just 10x the scale and 🤞… right?
Differences between testing Grafana Mimir on GEM vs. Grafana Cloud
It’s worth pointing out some of the major differences between how we scaled Grafana Mimir to 500M active series with GEM vs. 1 billion active series with Grafana Cloud.
While both technically use the same binary, Grafana Cloud has layers of automation and an entire Grafana Labs team dedicated to maintaining the platform. So for this 500M active series test, it was not only important to hit our goal. We also wanted to see how well we could enable the customer’s operations team to run GEM on-prem on their infrastructure, which did not have all of the same features as the infrastructure used for Grafana Cloud.
For instance, Grafana Cloud has a custom authorization layer to support billing and other aspects of running Mimir as a SaaS product. By using GEM, this customer’s 500M active series test had to work with GEM’s built-in authentication. As the test scaled, we pushed GEM’s authentication to its limits and discovered a bug in the way GEM caches authentication-related errors. Once identified, we were able to develop a fix and roll out a new GEM image the next day.
Finally for this customer, we partnered closely with the Grafana k6 Cloud engineering team to make significant performance improvements to the Grafana k6 remote write package. This ultimately lead to saving big on infrastructure-related costs since the final incarnation of the test was able to run on just 3 underlying AWS EC2 instances instead of requiring the 12 we initially estimated based on previous tests.
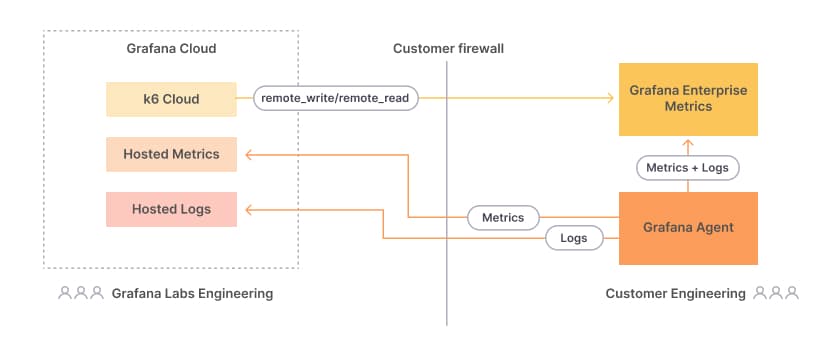
Configuring the customer’s Mimir test cluster
The test cluster (shown below) was configured by matching the customer’s GEM configuration on their infrastructure to our internal test cluster. We allowed traffic to flow from Grafana k6 Cloud IPs to facilitate the load testing. Finally, we also sent metrics and logs to a Grafana Cloud stack, which proved to be incredibly valuable. There would have been no way to successfully test on the customer’s infrastructure without the visibility and valuable insight into GEM that we got from having metrics and logs sent to Grafana Cloud.
Second load test: 300M active series, 2,000 queries per minute
The next touchstone was to hit 300M active series and 2,000 qpm.
To get there, we first scaled up our load testing on the customer side to 150M active series with 1,500 qpm. At this point, we found a bug in the way GEM caches authentication errors (as referenced in the Grafana Cloud vs. GEM box above). We also increased ingester memory as well as ingesters, store-gateway, and compactor disks.
At each load test phase prior to this one, we scaled the customer’s cluster up just enough to handle the ingest volume for the respective test. However, now that 500M active series was within reach, we decided to jump ahead and scale the cluster for 500M active series before running the 300M active series test. This worked out to 100+ each of the ingester, distributor, and querier components along with 30 compactors, 50 store-gateways, and 20 query-frontends. Due to this rapid scale-up, we ran into AWS quota limits for the EBS volumes necessary to run ingesters and compactors. This blocked the scale up for a couple days as those issues were resolved with AWS support.
We also increased compactor disk space and enabled compaction sharding with Grafana Mimir’s split-and-merge compactor, the component responsible for compacting multiple TSDB blocks uploaded by ingesters into a single larger block. Scaling to this point and beyond is directly enabled by the split-and-merge compaction algorithm. Due to the new algorithm’s incredible performance, we mostly forgot about the compactor and only checked to verify that it was working during each test.
Third load test: 500M active series, 10,000 queries per minute
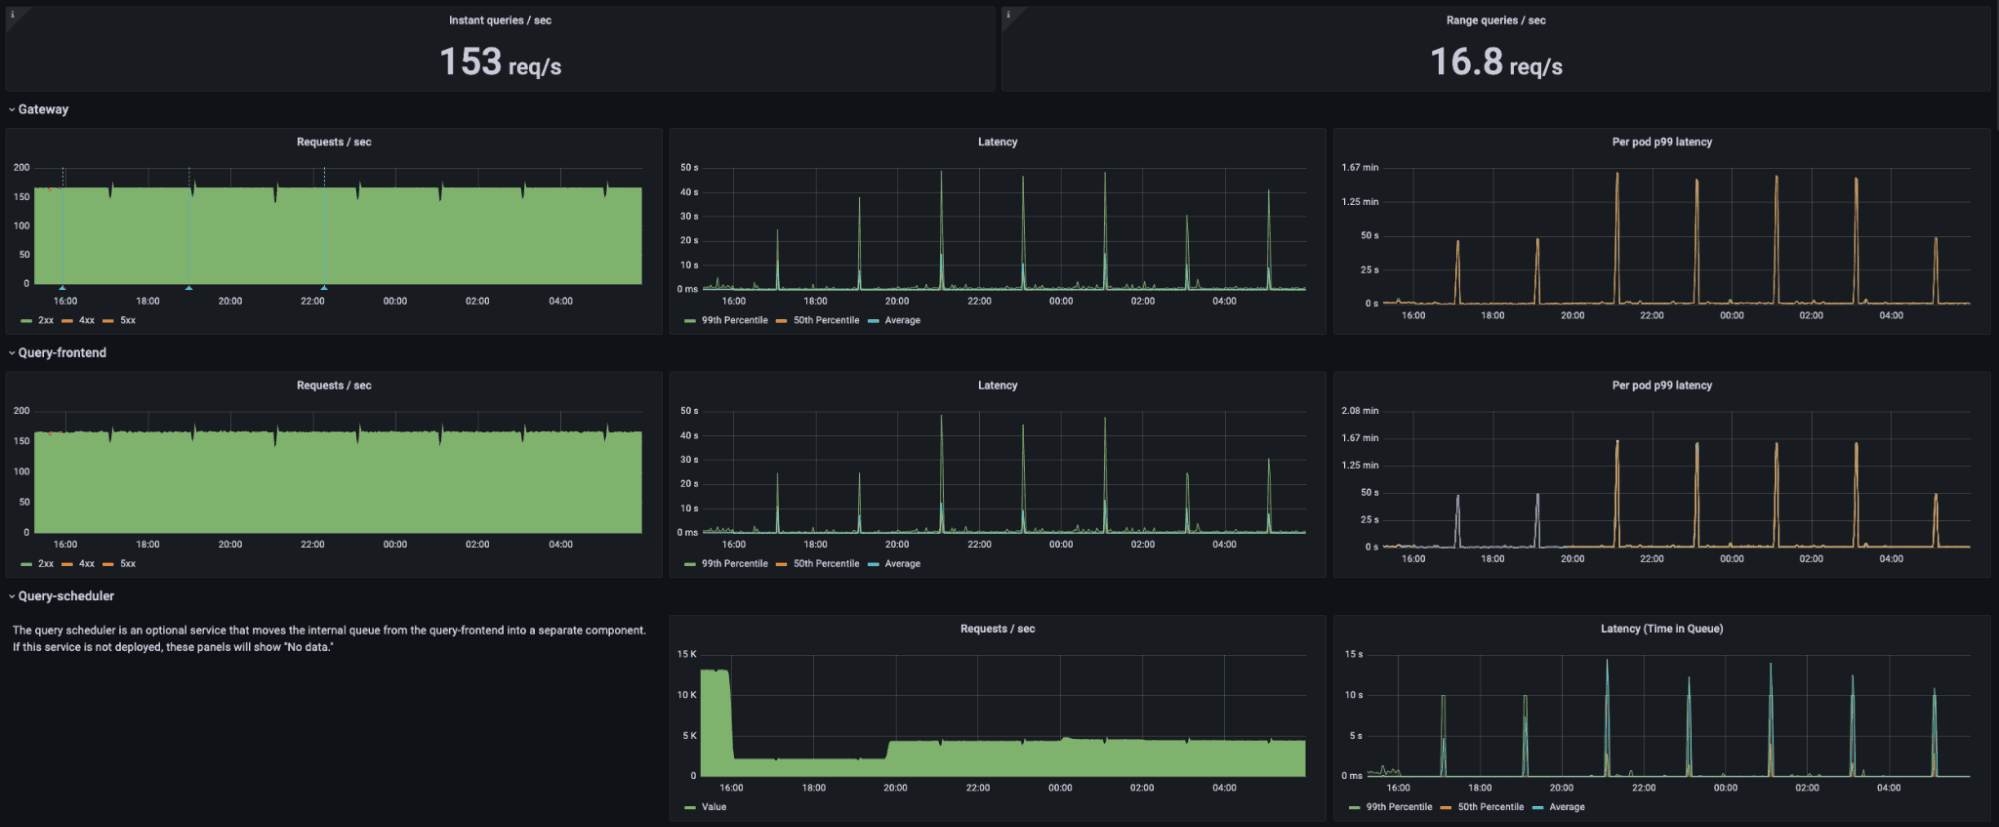
When it was time to scale up load testing on the customer side to 500M active series and 10,000 qpm, we initially ran into a strange issue: a small number of queries were failing consistently and every 2 hours we would see a large spike in error rates.
In the screenshot above, the red dips in the graphs on the left show the spikes of failed queries occurring like clockwork every two hours. You may also notice that the spikes in error rate occur perfectly in time with spikes in p99 query latency. It turns out that this was triggered by the TSDB head compaction on the ingesters. This is a process that occurs every 2 hours in order to cut a new TSDB block for long-term storage from the samples currently in memory. During this time, it’s normal for query latency to increase slightly, especially for queries that need recent data from ingesters.
At this point, it’s worth going into a little more detail about the read test being performed. As stated before, we run 10,000 queries per minute. Each time a query is scheduled to execute, our k6 Cloud test randomly chooses several parameters to decide what query is actually used. These parameters were agreed upon with the customer based on their expected usage of GEM.
The parameters each have several options, and each option has an associated probability of being chosen. For example, each query had a 1% chance of running with a label selector that would return 5M series. The other 99% of queries ran with a label selector that would return 1K series. Similar parameters were defined for the particular PromQL expression to compute whether the query should be an instant or range query and the length of time range to consider.
So the important factors in this test are:
- Some queries are very high cardinality
- All queries involve recent data within the last minute
- The particular PromQL expressions are slightly random but meant to replicate real-world usage
With all this information in mind, we made a few simple changes and reduced the error rate to negligible levels. First, we took a close look at the query sharding performance. It turned out that only around 50% of the queries were shardable due to the way they were written. For example, the query irate(test_metric[5m]) is not shardable. In the case of the high cardinality queries, this would actually return 5M distinct result series. It’s not surprising that this is slow to execute, since a huge amount of data must be loaded into a single querier pod before a result is produced.
The fix was straightforward: In practice, even queries of very high cardinality data are typically aggregated by some lower cardinality label before being visualized. We rewrote the query to sum by (label_with_50_values) (irate(test_metric[5m])). Instead of 5M distinct results, this now returns only 50 despite still processing all data under the metric named test_metric. GEM is now able to efficiently shard that query onto many querier pods at once, which dramatically improved query latency.
Second, we noticed that some queries were actually being transformed into too many shards, which adds unnecessary overhead in the case of simple queries like those with a cardinality of only 1K. To address this, we reduced -query-frontend.query-sharding-total-shards down to 12 from 72. This dramatically reduced the number of requests being handled by ingesters without meaningfully impacting query latency.
Lastly, now with a renewed look at the query scheduler behavior, we greatly increased the maximum query scheduler queue size to give the system a bit more flexibility during these temporary latency spikes. We calculated the maximum number of sharded queries that were expected to execute within the gateway timeout. This calculation was (10k qpm * 12 sharded queries / query * 2 minute timeout), which worked out to a maximum queue size of 240k.

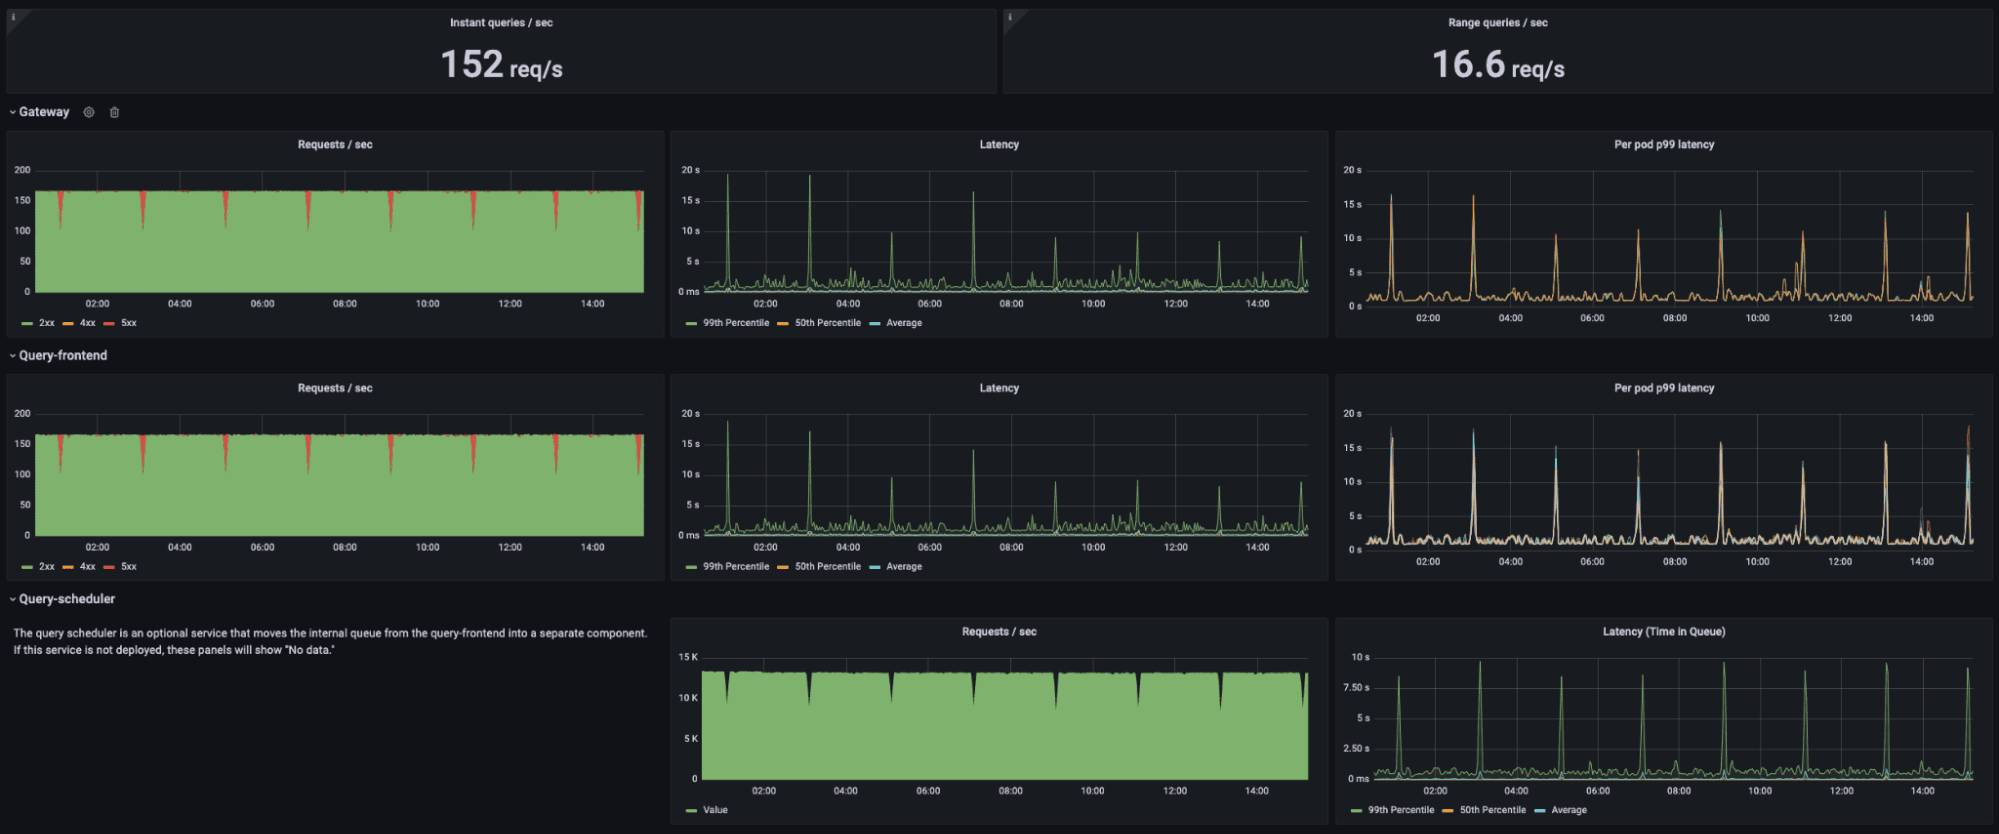
With all these changes in place, the dashboard tells a different story. While latency still spikes during the TSDB head compaction, there are no query failures at all. Instead, queries simply queue up in the query scheduler and are processed as soon as possible.
One final note, there is already an experimental feature in GEM to eliminate the head compaction latency spikes altogether. This is enabled via the -blocks-storage.tsdb.head-chunks-write-queue-size flag. We opted not to enable it during this test because we are still gathering data about real-world performance in Grafana Cloud, and we generally avoid recommending experimental features to our on-prem customers.
Final load test: rapid increase in sample ingestion rate
At this point in the engagement, we had successfully demonstrated GEM’s ability to scale up to 500M active series and saw no significant issues that would prevent scaling even higher. The customer asked that we run one final test to prove out a specific scenario: What happens when millions of active series are added to GEM over a short period of time?
Together we designed the following test scenario to demonstrate GEM’s ability to handle the following scenario:
- Send 400M active series for 1 hour
- Within 1 minute, ramp up to 500M active series
- Send 500M active series for 1 hour
- Within 1 minute, ramp down to 400M active series
- Send 400M active series for 1 hour
- Same 10k qpm during the entire 3 hours
With a few changes to our k6 Cloud test script, we added the ability to ramp up and down on an arbitrary set of intervals. We kicked off this final test early afternoon on Friday and by the weekend we had our result: GEM performed perfectly. The additional 100M active series were distributed evenly across ingesters and cleaned up at the next head compaction once the data stopped arriving.
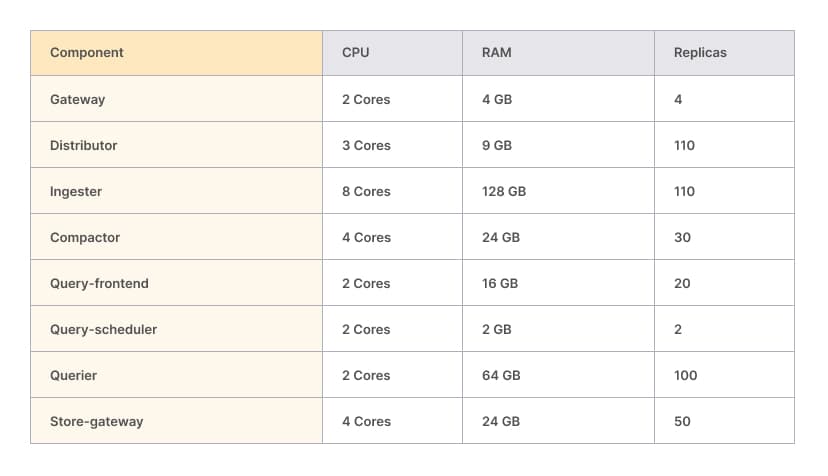
Final resource allocation
In the end, we ended up with the following scale across the cluster:
Conclusion
It’s important to note that this was run as a stress test of GEM’s architecture, and there are a few notable differences between the configuration described here and a recommended production environment:
- This test was run entirely in a single GEM tenant. We recommend splitting your usage across many tenants. Ideally tenants are not bigger than ~10M active series.
- In a multi-tenant environment, we recommend enabling shuffle sharding. This prevents one tenant from causing downtime for other tenants due to misconfiguration, malicious behavior, etc.
- We recommend enabling zone-aware replication. This enables faster rollouts via the Grafana Rollout Operator. It also prevents the loss of an availability zone from causing downtime in GEM.
In the end, we were able to show that Grafana Enterprise Metrics can help a customer scale their metrics to 500M active series and beyond while providing an on-prem solution that gives you the power to work within your existing infrastructure and own your data. To learn more about Grafana Enterprise Metrics, request a demo or more info from our team.
Understanding the capabilities of Grafana Mimir and Grafana Enterprise Metrics would not have been possible without Grafana k6, the modern open source load testing tool created by the Stockholm-based tech startup k6 which Grafana Labs acquired in 2021. To discover how you can deploy Grafana k6 for load testing within your organization, please reach out to our Grafana k6 team.

