How to correlate logs and metrics with the Linux Node integration for Grafana Cloud
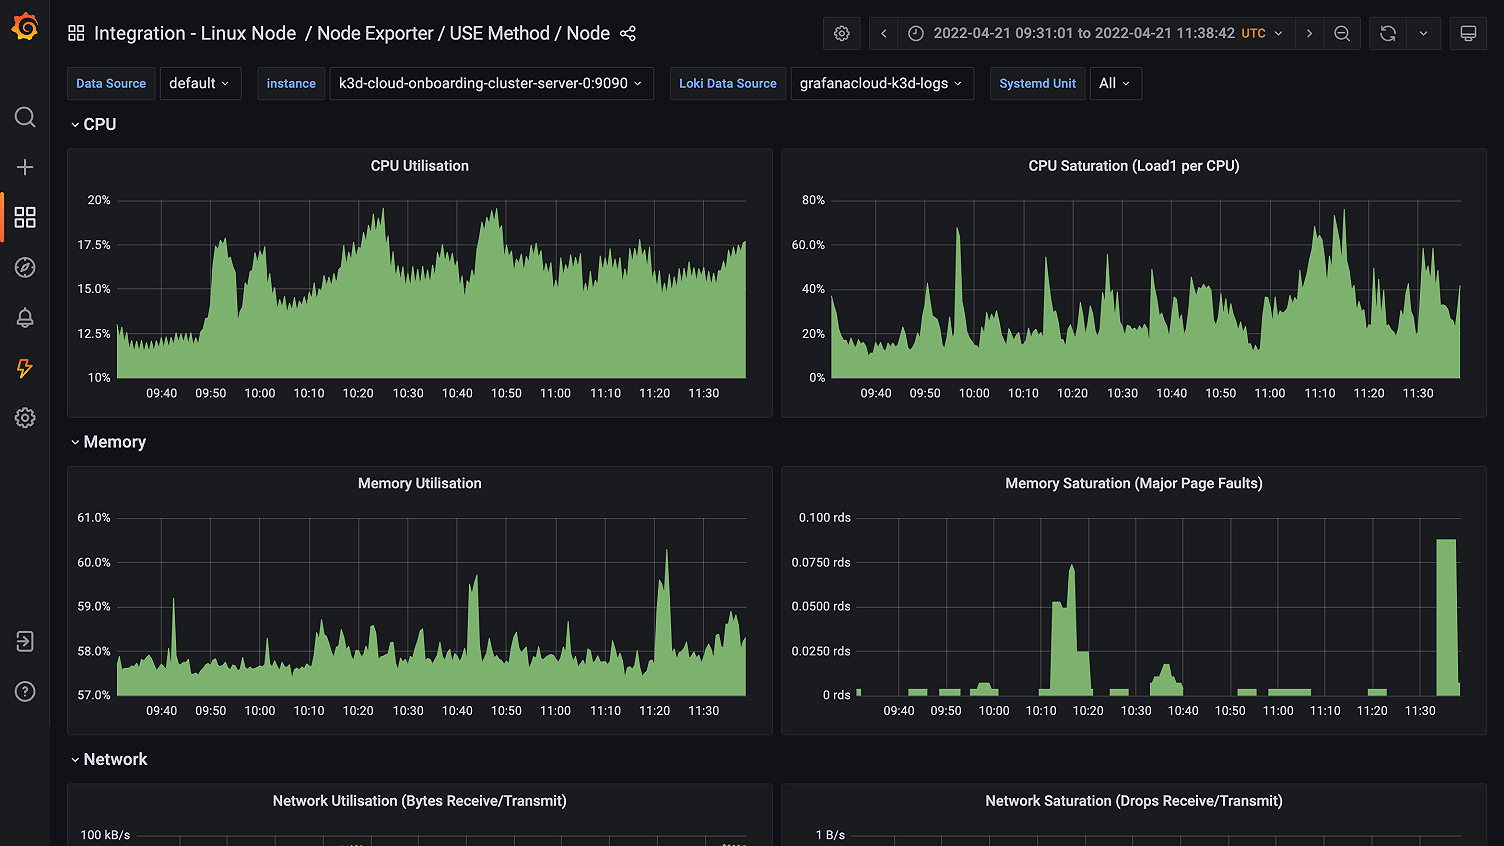
We are pleased to announce that an upgraded version of the Linux Node integration is available in Grafana Cloud, including the capability to visualize logs that are correlated with previously existing metrics. It also includes a new pre-configured dashboard based on the USE method, which focuses on showing resources utilization, saturation, and errors.

Why the Linux Node integration upgrade is awesome
This Linux Node integration upgrade is a game changer in terms of troubleshooting your Linux instance, because sometimes metrics alone are not enough. They may only highlight the problem symptoms while logs will actually show you what the root cause of an issue may be.
With the new logs capability enabled in all of the pre-built dashboards in the Linux Node integration, along with the 16 alerts that are also shipped, you can navigate to a specific point in time where your metrics started displaying erratic behavior and correlate it with your instance logs sourced from a handful of log files, depending on your distribution:
- Application log: /var/log/syslog or /var/log/messages
- Authentication log: /var/log/auth.log or /var/log/secure
- Kernel log: /var/log/kern.log
Additionally, we added the option to use systemd journal scrape, which gives you the ability to filter application logs pertaining to a specific unit. We recommend you enable this function to fully benefit from this feature.
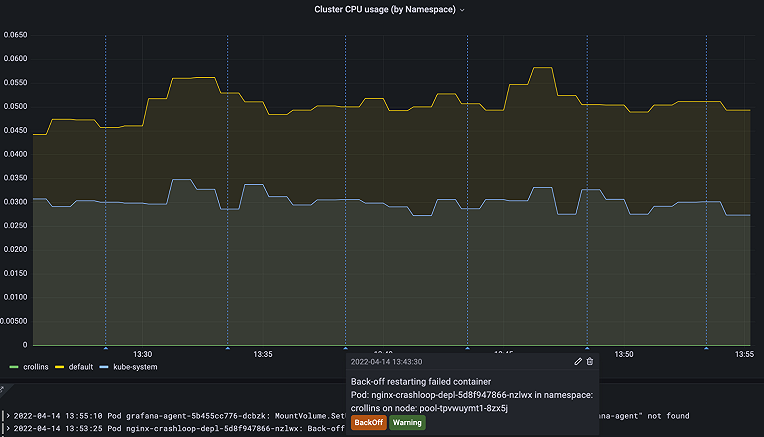
Here is what it looks like if the disk used by an application gets full. You can see that the Grafana Agent errors that indicate the disk is full start popping up, along with the disk usage metric going up.

Get started with the Linux Node integration
For details on how to configure your Grafana Agent to scrape your log files, please refer to our Linux Node integration documentation.
Give the newest version of the Linux Node integration for Grafana Cloud a try, and let us know what you think! You can reach out to us in our Grafana Labs Community Slack in the #integrations channel.
Grafana Cloud is the easiest way to get started with metrics, logs, traces, and dashboards. We have a generous forever-free tier and plans for every use case. Sign up for free now!