
An introduction to trace sampling with Grafana Tempo and Grafana Agent
This blog post was updated in August 2023 to reflect updates to the OpenTelemetry configurations for tail sampling, as well as the latest Grafana features.
Greetings friends, one and all!
Over here on the Field Engineering team, we’re often asked about tracing. Two questions that come up frequently: Do I need to sample my traces? and How do I sample my traces? The folks asking are usually using tracing stores where it’s simply not possible to store all of the traces being generated.
Those are great questions and the answers depend on a few different factors.
Grafana Tempo, Grafana Cloud Traces, and Grafana Enterprise Traces are highly scalable, cost-efficient solutions, specifically designed to store the majority of the traces in your infrastructure and applications without any sampling at all! They not only bring huge benefits to users who want to immediately observe how data is flowing through their services right now, but they also help engineers and SREs who might want to go back to last week, or a few weeks ago, to compare historical traces to that of the current state. This allows them to find potential optimizations as well as bottlenecks in the data flow.
There are times, however, when you don’t need all the traces. This could be because you’re not interested in particular requests through your system, such as ones that had a duration of less than an arbitrary amount of time; requests that didn’t result in an error; or even requests that came into a particular endpoint that you simply don’t care about.
Because of that, there are a few questions an organization should ask to determine if they need to sample:
- Is there a good reason not to store all of our traces?
- What might we miss if we don’t send all of our traces?
- Are there parts of our system or infrastructure that we never need traces for?
- Are there types of traces that we simply don’t care about?
If the answer to any of these is “Yes,” then you probably want to carry out trace sampling of some kind.
Of course, there’s a more fundamental question that you might have: What is trace sampling anyway?
An introduction to tail sampling
When an application is instrumented with a tracing SDK, such as the OpenTelemetry SDK, it emits spans that make up an individual trace. Usually traces are based around individual, unique requests entering a system, then being processed before a response is sent back to the requester. This allows for individual observation of every single request being received, which can be extremely helpful to find errors, latencies, and other factors that impact your users.
For example, if you have one request a second, this corresponds to 60 requests a minute or 86,400 requests a day. That’s . . . not a lot of requests. If we consider a SaaS solution that may comprise 20 individual microservices, with a couple of spans per service, and each span is about 300 bytes, that ends up to being around 40 spans per trace at 300 bytes a span — or 12KB a trace. So over the course of a day, you’d need about 1 GB of trace storage.
OK, 1 GB a day isn’t that much. You can store that and look through those traces easily enough. However, if you are only receiving 86,400 requests a day, then something very critical may happen: You’ll go out of business because you don’t have nearly enough customers.
Most common SaaS solutions receive tens or hundreds of thousands, if not millions, of requests a second. Twelve thousand bytes (for a single trace) times a million, times 60x60x24 is a number so big I’m not even going to put it into my calculator. To actually process this many traces and store them becomes expensive, not only in terms of CPU and memory resource, but also storage.
Because of this, a lot of tracing solutions today use sampling of some type to reduce the burden of both transmitting and storing traces. This can take the form of only capturing one trace out of a certain number — say, 1 in 100 — and is called probabilistic or randomsampling. The theory behind this is that with so many traces being emitted, sampling only a small amount of them will still ensure that you get to see traces that are relevant for you, such as requests that threw an error, or that were of a certain minimum duration.
A lot of solutions are more clever than this and actually use far more advanced sampling. They employ techniques that detect anomalies and deviations from what they see as “normal” traces to ensure that outliers are caught and stored. While this works well, there are occasions where this misses important traces, which is one of the reasons we at Grafana Labs believe capturing all of your traces is important.
Head sampling vs. tail sampling
Sampling usually comes in two distinct forms.

Head sampling usually occurs within an instrumented application. This type of sampling determines whether a trace should be captured very early into its lifecycle. For example, imagine that you have health check endpoints that simply return “ALIVE!” to any request. This is probably not code you really care about. (That’s a bit of a lie — you care about it, but given it’s probably not a very complex function. You just want to make sure it works, not trace it.)
When a new trace is created due to a request for that endpoint, you can write some code in your endpoint handler that instructs the trace instrumentor to simply not continue with the trace. No spans will be sent to whichever trace store you’re using, and any further spans created for that trace will be ignored. A decision has been made at the head of the trace to ignore it, regardless of any further spans.
As you may have already guessed, tail sampling occurs at the end of a trace — i.e., when all of the spans for a trace have been emitted and the trace finished. This does not usually occur in application instrumentation, as the complexity of microservices mean that a trace will probably finish in a downstream service from where the trace was initiated. Instead, tail sampling usually occurs in either trace store backends, or more commonly in locally running agents or trace collectors operating in your application infrastructure.
Because tail sampling waits until all of the spans for a trace have been received, it can make decisions based on the entire trace. Depending on all of the spans for a trace, it will only store traces that have exhibited errors in any of the spans that are stored; ones that have a minimum duration; or even traces whose spans include specific tags and attributes. It can even just do simplistic random sampling, too!
That said, even though tail sampling is a lot more flexible than head sampling, it’s also a lot more resource-heavy since it needs to work through all the spans of a trace to apply the logic for the type of sampling required. As such, it should be used sparingly.
Tail sampling with Grafana Agent
At this point, you probably have a good idea of whether you need to carry out sampling, and what to sample. So your next question might be: Can you sample before sending traces to Grafana Tempo, Grafana Enterprise Traces, or Grafana Cloud Traces?
Yes!
Grafana Agent is a general purpose observability collector that can scrape Prometheus metrics, capture logs, and send them to Loki, and receive traces from any Tempo compatible instrumentation SDK (e.g., OpenTelemetry, Jaeger, Zipkin, etc.).
Grafana Agent also includes a lot of functionality to process traces, such as emitting Rate, Error, and Duration (RED) metrics from incoming traces spans; automatically producing log lines for incoming traces; adding labels from popular autodiscovery (such as k8s details); and of course, tail sampling.
Because it conforms to the OpenTelemetry SDK standard, Grafana Agent includes all of the tail sampling policies that OpenTelemetry specifies as well. (You can find those here, although for the most up-to-date view of supported sampling policies it’s worth looking at the code here.)
Some popular sampling policies are:
- Trace duration
- Span tags/attribute values
- Spans with flagged errors
As I’ve noted already, being able to tail sample requires that all the spans for a trace are available. But what happens if your service is very large and you’re running multiple Agents? In that case, you probably want to run Grafana Agent in a round-robined (or other load balanced) configuration. This means that spans for a particular trace could be potentially sent to different agents. This quickly becomes a problem, because even though those spans can still be combined into a single trace by the backend store (Tempo, GET, Grafana Cloud Traces), it prevents tail sampling from occurring.
Fear not! Grafana Agent includes a configuration option to allow load balancing across all the known agents. It ensures that spans are always processed by a single agent and is configurable either as a static list of known Agents or via a DNS record returning a list of Agent IPs (such as in a headless Kubernetes service). This allows tail sampling to occur even with multiple Agent instances. One thing to note is that this does use extra resources — the span information can be sent up to two times for the correct Agent to process.
See the load_balancing section of the Grafana Agent configuration guide for more information.
Some worked examples
I’ve wittered on long enough, and you’re probably wondering, “When does he get to the good stuff?” Well, hold onto your hats, hair, or scalp, because we’re about to dive into some useful examples.
I’m very much a “see it, do it, remember it” kind of person. As a result, the examples here are interactive. If you don’t already have them, you’ll need to install:
- Git
- Docker (and, optionally, Docker Compose if you’re not using the latest version of Docker)
Once you’ve installed the tools, clone the git repository (this assumes you have an SSH key associated with Github):
git clone git+ssh://github.com/grafana/opentelemetry-trace-sampling-blogpost.git
cd opentelemetry-trace-sampling-blogpost
The repository features a Docker Compose file that includes:
- Grafana (visualizes data)
- Grafana Tempo (stores and queries traces
- Grafana Loki (stores and queries logs)
- Grafana Agent (processes trace data before sending it to Tempo)
- A demo application to show trace sampling, which:
- Sends traces to Grafana Agent
- Logs directly to Loki via the HTTP API(we could use the Docker driver for this, but it saves extra complication and lets us easily add some labels)
You can start it up the project from your command line by using the standard Docker Compose functionality:
docker compose up
This will stand up all of the components, build a small Docker image for the application, then execute it.
Let’s quickly look around Grafana. Once started, login to Grafana at: http://localhost:3000
Two data sources have been pre-provisioned: Tempo and Loki. Loki contains log output from the demo app — including trace IDs — and Tempo is storing the traces. At the start, all of the traces being emitted from the demo app are being stored. We can quickly verify that by going to the Explore page in Grafana and looking at all of the logs.

Let’s look at some traces by expanding some of the loglines, and then closing the log panel:


I’m not going to go into how traces are visualized here, as there are plenty of blog posts detailing tracing with Grafana, as well as our documentation.
Currently, all the traces from our application are being captured. Because we’re using Grafana Agent to collate and batch the traces before sending them onto Tempo, it’s really simple to configure the Agent to capture them and remote write them to the backend.
Find the agent/config.yaml file and open it in your favorite code editor. It’ll look like this:
server:
 log_level: debug

# Configure trace receiving.
traces:
 # Define a single trace configuration, named `server_traces`.
 configs:
 - name: server_traces
   # Define the protocols to receive traces on, OTLP HTTP on the default port (4318).
   # See https://grafana.com/docs/agent/latest/configuration/traces-config/ receivers.
   receivers:
     otlp:
       protocols:
         http:
           endpoint: "0.0.0.0:4318"

   # Send batched traces to the locally running Tempo service.
   remote_write:
     - endpoint: tempo:4317
       insecure: true
Put simply, this instructs the agent to log everything in debug mode and creates a new traces configuration section that will receive OTLP format traces from the application. It then writes them to the Tempo instance you have running.
We’re going to add a new section to the configuration file. Grafana Agent uses the OpenTelemetry tail sampling processor, and therefore supports all the sampling policies that the OpenTelemetry collector features.
Let’s make an obvious change that uses tail sampling to ensure we only receive traces which have errors.
How do you do that? Well, you need to know how to filter the span data for the traces coming into the Agent so it only flags those with errors. Luckily, there’s a convention in the OpenTelemetry specification that includes setting the status code for a span. This means that for any code you write where an error occurs, you can set an error status on a span being generated at that point, which will flag that an error has occurred. It’s also generally useful to set a specific error code and message to detail what went wrong.
If we take a quick look at the code for the application (the src/index.js file) below, we can see that this is exactly what occurs:
let spanStatus = api.SpanStatusCode.OK;
if (dbError) {
   spanStatus = api.SpanStatusCode.ERROR;
   dbSpan.setAttributes({
       'db.error': 'INVALID_DATA',
       'db.error_message': 'Invalid data sent to Database',
   });
   …
}
dbSpan.setStatus({ code: spanStatus });
I specifically set the error code status on this span, as well as the extra error information as attributes. That also ensures that the parent spans have an error set on them to percolate this up the chain. It can be seen later on in the code.
We can take a look at this in action by searching for errors using the span search functionality on the Tempo data source in Grafana. By searching for spans that have the appropriate status code set, you can see all of the traces that have errors thrown within them.

This translates very easily into a filter for tail sampling in the Agent. Go back to its open configuration (the agent/config.yaml file), and add a new section (note that this needs to line up with the same section for the remote_write):
    tail_sampling:
      policies:
        - type: status_code
          status_code:
            status_codes:
              - ERROR
This configuration block does a few things. It starts by denoting that we’re defining a tail_sampling section, and then that it will include one or more policies (you can define multiple policies at the same time). The status_code policy takes a block called status_codes, which is what defines the codes that need to be present to store the trace. Currently these values are: UNSET, ERROR and OK. In this case, we only want to store traces which have spans with the ERROR code set. Finally, we could have named this policy (with a name property), and probably would if we were applying other policies to ensure we can easily identify it, but in this case, there’s no real need to.
In a different command line terminal, restart the Agent by running the following:
docker compose restart agent
That will restart the Agent with the new tail sampling policy. At this point, it’s probably worth making a cup of tea (or your beverage of choice), both for a small break and also because if you leave the system running for a few minutes it’ll be a lot clearer that you’re now only collecting traces with errors in them!
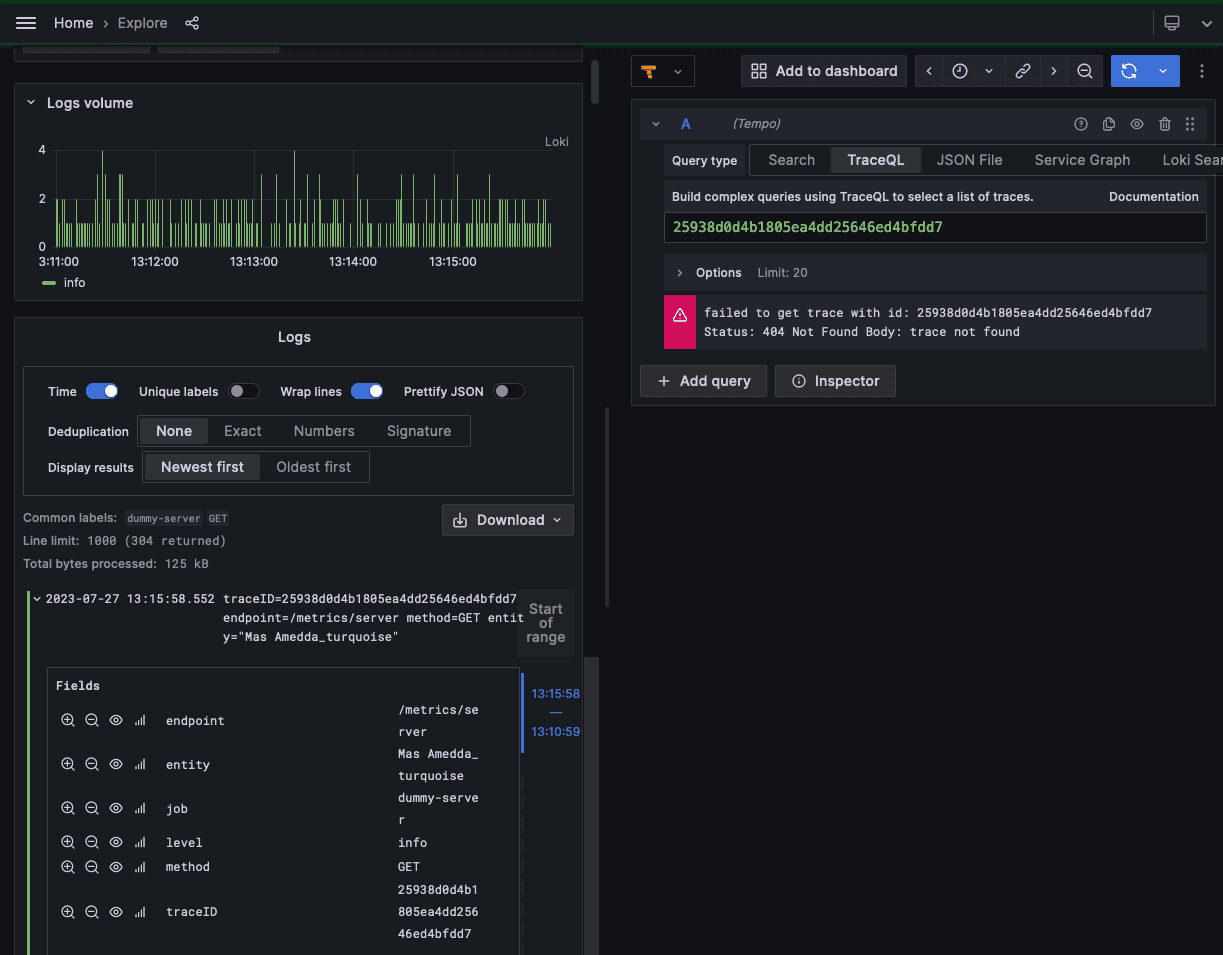
Let’s go back to the Grafana instance to see the changes. We’ll be looking at the logs for the traces (although also we could have easily used the span search functionality ‘Search’ or ‘TraceQL’ in the Tempo visualizer, as we did before). Expand the details for a log line where an error didn’t occur (any green entry). Click on the ‘Tempo’ button for that log entry and you’ll see something like this:

Even though we have a log line denoting an event and the trace was instrumented by the application, the reason you’re seeing a query error in the Tempo panel is because Grafana Agent used its tail sampling policy to discard the trace since none of the spans within it had its status code set as an error. You can prove we’re still collecting traces by finding a log line flagged with an error (denoted by a red entry) and selecting the Tempo button to go to the relevant trace, which will exist:

Filtering by span tags
Another helpful filter is one that will only collect traces for endpoints which are useful. Most services have health check (or “ping”) endpoints that can be used to determine if the service is up or not. One of the endpoints our application is tracing is /healthcheck. We’ve also got a couple of metrics endpoints — again something we’re not too concerned about tracing. So let’s create another tail sampling policy that ignores both of these.
Go back to the Grafana Agent configuration in your editor, and remove the policy we created for capturing errors. Instead, replace it with the following block:
    tail_sampling:
      policies:
        - type: string_attribute
          string_attribute:
            key: http.target
            values:
              - ^\/(?:metrics\/.*|healthcheck)$
            enabled_regex_matching: true
            invert_match: true
This defines a new policy of type string_attribute. This policy requires a span tag/attribute key to filter on, and in this case looks for the http.target attribute which denotes the endpoint that’s been requested. The values array allows you to set one or more values which are matched against the value of the string attribute’s key. If there’s a match, then the trace is stored. In this case, we’ve decided to match against the /metrics/* and /healthcheck endpoints.
Now, at this point you’re probably thinking, “Hang on — If the match occurs on these values, then these traces will get stored . . . which is actually the reverse of what we want!”
That’s right! Happily, this policy type includes an invert_match boolean selector, which means that only traces with spans that don’t match our values will get stored. The traces for the health check and metrics endpoints will actually be discarded.
You can restart the agent again from a command-line terminal with:
docker compose restart agent
Again, let the system run for a couple of minutes, and then let’s find some traces for the health check and metrics endpoints in Loki using LogQL:
This LogQL query ensures you only find log lines pertaining to /healthcheck or /metrics/*. Selecting any of these entries and then trying to find the traces associated with it will fail, because you’ve filtered out these traces.
If you look for any other log lines, using an inversion of the LogQL query we’ve used, and then select any of the logged traces, you’ll find that all traces for the other endpoints have been stored.
Great! You now know how to create two separate policies that collect errors and filter out specific endpoints. But how do you ensure you only see errors on the endpoints you care about?
Well, OpenTelemetry also contains a couple of policies that allow you to combine other policies. One of these is the “and” policy, which as the name suggests, allows you to AND policies together into a super-policy.
Edit the Agent configuration file again, and replace the tail sampling block with the following:
 tail_sampling:
      policies:
        - type: and
          and:
            and_sub_policy:
            - name: and_tag_policy
              type: string_attribute
              string_attribute:
                key: http.target
                values:
                    - ^\/(?:metrics\/.*|healthcheck)$
                enabled_regex_matching: true
                invert_match: true
            - name: and_error_policy
              type: status_code
              status_code:
                status_codes:
                  - ERROR
Here, you use the “and” policy to combine both of your previous policies into a single one. You will now only ever see traces that have spans denoting that an error occurred that aren’t on either a metrics or health check endpoint.
Again, restart the agent in another terminal window with:
docker compose restart agent
Now you can safely ensure that only errors from endpoints you care about are stored! You can easily check this is working by going back to Grafana. You should see that only traces for errors that aren’t occurring on the health check and metrics endpoints are available.
We can verify this by using a TraceQL query that searches for traces containing an error, with either the /metrics or /healthcheck HTTP endpoint prefix:

Conversely, searching for any trace with an error that doesn’t have the /metrics or /healthcheck endpoint prefixes will show a list of many captured traces:

More trace sampling policies
That was a fairly whistle-stop tour of tail sampling using Grafana Agent, but it’s worth noting that status code and span attribute policies are just two basic examples. In fact, there are a number of useful sampling policies:
- Probabilistic (sometimes known as random) sampling allows you to only store 1 in traces seen by the Agent.
- Latency filters ensure that only traces that take over a certain amount of time are stored.
- Numerical span attribute checking allows you to only store traces where attribute values are between a min and max value.
- Rate limiting stores up to a certain number of traces every second.
- Composite policies assign a percentage of the rate of incoming traces to sub-policies.
Those are more than enough to ensure you can carry out pretty much all the trace filtering you might need to do.
Happy sampling!
Grafana Cloud is the easiest way to get started with metrics, logs, traces, and dashboards. We have a generous free forever tier and plans for every use case. Sign up for free now!

