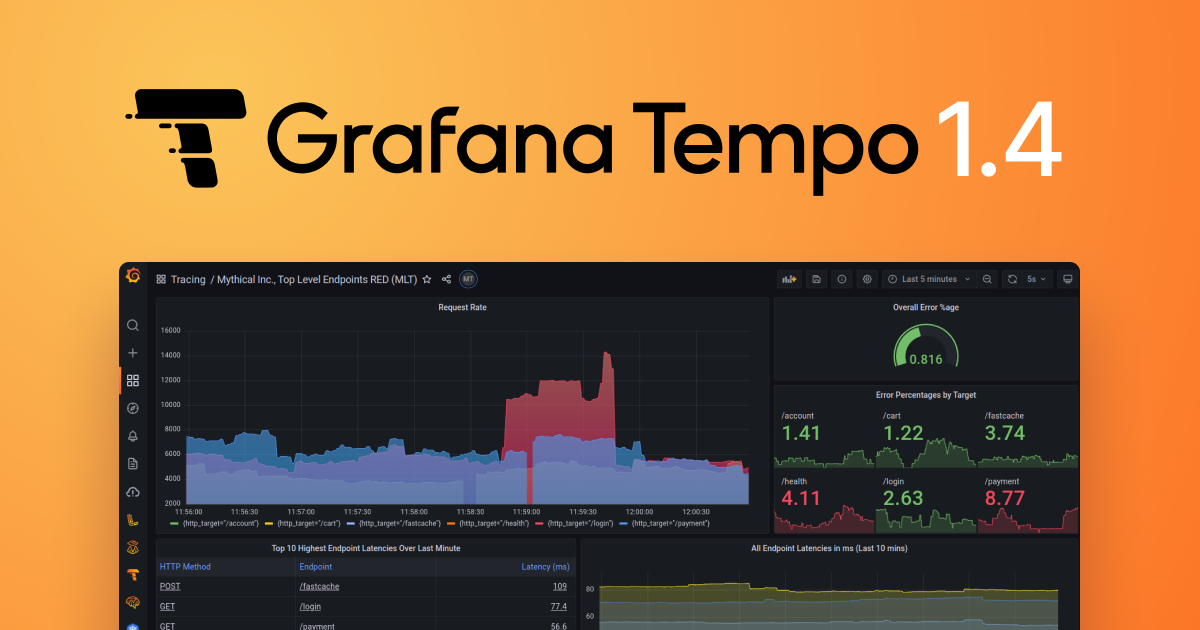
New in Grafana Tempo 1.4: Introducing the metrics generator
Grafana Tempo 1.4 has been released and features a new optional component: the metrics generator, which automatically generates RED metrics and service graphs from your traces.
We’re actively rolling out the metrics generator service to our own Grafana Cloud offering and are looking for Grafana Cloud Traces customers wanting early access. If interested, you can email our support team for more details.
The new features, updates, and bug fixes in the latest release of Grafana Tempo are also available in Grafana Enterprise Traces (GET) 1.3, the latest version of our self-hosted, Enterprise-ready version of Tempo.
If you want to dig through the nitty-gritty details, you can always check out the v1.4 changelog. If that’s too much, this post will cover the big ticket items.
You can also watch a demo of how to set up and scale Grafana Tempo in our “Getting started with tracing and Grafana Tempo” webinar, which is available on demand.
How the metrics generator works in Grafana Tempo 1.4
The metrics generator is a new optional component that consumes spans and creates metrics. Distributors load balance spans to metrics generators by trace id which then calculate and send metrics to any service that supports Prometheus remote write.

Above: Grafana Tempo service diagram
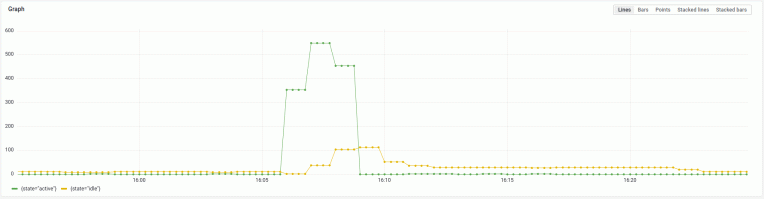
The metrics generator creates a number of new metrics used for tracking span durations, counts, and even tracks cross process calls to create service graph metrics. Feel free to dig into our server-side metrics documentation or just check out this awesome dashboard created entirely from the new Tempo metrics generator by our very own Heds Simons.

Above: Dashboard built on the output of the metrics generator.
Grafana also has beta support for building dependency graphs using the metrics generated by Tempo.

Above: Service graphs using Grafana Tempo server-side metrics.
Possibly the best feature of these new metrics is that Tempo will also write exemplars to the storage backend. This allows for jumping from metrics to traces without any change to your existing instrumentation. Just send your traces to Tempo, and it will do the rest!

Bug fixes
Tempo 1.4 comes with a few bug fixes worth calling out.
- PR 1390 Corrects issue where, in some cases, Azure “Blob Not Found” errors were not correctly handled by Tempo.
- PR 1314 Fixes the issues where block start/end times were based on trace ingestion instead of actual trace start/end times.
- PR 1387 Prevents a data race/ingester crash during searching by trace id.
- PR 1372 Fixes spurious “Failed to mark block compacted during retention” errors.
- PR 1379 Fixes error message “Writer is closed” by resetting compression writer correctly on the error path.
Breaking changes
Tempo 1.4 has a few breaking changes. In particular, the first change listed requires a special rollout procedure to prevent downtime on the write path. Operators take note!
- PR 1227 A new ingestion endpoint was added to the ingesters in Grafana Tempo 1.4 to support faster search and proper start/end times on blocks. Please roll out all ingesters before rolling the distributors to prevent downtime. Also, during this period, the ingesters will use considerably more resources and should be scaled up (or incoming traffic should be heavily throttled). Once all distributors and ingesters have rolled performance will return to normal. Internally we have observed ~1.5x CPU load on the ingesters during the rollout.
- PR 1350 A few querier options were moved while adding hedging to external endpoints.
querier:

 search_query_timeout: 30s

 search_external_endpoints:[]

 search_prefer_self: 2
was relocated to
querier:

  search:

    query_timeout: 30s

    prefer_self: 2

external_endpoints:[]- PR 1297 Updated the vult to test full backend search and as a result dropped the CLI parameter
tempo-search-retention-duration.
What’s next?
This past month we’ve had two exciting announcements that are worth highlighting here.
First, Tempo is committed to start writing data in an open, columnar format: Parquet. We’ve spent quite a bit of time experimenting with this format and have found massive gains in search.
Additionally, your trace data will be sitting in object storage in this highly supported open format. The data is yours! Do what you want with it!
We’ve also given the community their first look at TraceQL, an upcoming query language that will be supported by Tempo. Parquet needs to go first, but this early look at TraceQL gives our community a chance to give feedback and participate in the creation of this new, powerful language.
Happy tracing!
If you are interested in more Tempo news or search progress, please join us on the Grafana Labs Community Slack channel #tempo, post a question in the forums, reach out on Twitter, or join our monthly community call. See you there!
The easiest way to get started with Grafana Tempo is with Grafana Cloud, and our free forever tier now includes 50GB of traces along with 50GB of logs and 10K series of metrics. You can sign up for free.