
Introducing the new Confluent Cloud integration for Grafana Cloud
At Grafana Labs, we’re continuing to expand our platform of Grafana Cloud integrations that make it easier than ever to connect and monitor external systems. These integrations enable you to answer the big picture questions in your organization and tell your observability story.
We are excited to introduce the latest integration available in Grafana Cloud: Confluent Cloud, a fully managed integration that makes it simple to monitor and visualize your Confluent Cloud platform resources within Grafana.
Confluent Cloud + Grafana Cloud
Confluent Cloud is a fully managed cloud native data streaming platform that is pioneering a fundamentally new category of data infrastructure that sets data in motion, built by the founders of Apache Kafka®. It is designed to be the intelligent connective tissue enabling real-time data from multiple sources to constantly stream across the organization. If you aren’t already using Confluent Cloud it is free to get started.
With the Confluent Cloud integration, you can monitor all of your Confluent resources within Grafana Cloud. You can connect your Confluent Cloud account in a few simple clicks to start importing metrics for Kafka clusters, connectors, ksqlDB applications, and schema registries. Our scalable, managed Grafana Cloud Metrics service is compatible with Prometheus metrics — no agent or custom exporter needed. So data stored within Grafana Cloud is available with long-term retention and can be queried with the PromQL language and visualized with a pre-built Grafana dashboard.
Setting up the Confluent Cloud integration
In Confluent Cloud, use the console or CLI to create and note a Cloud API Key with a MetricsViewer role. This API key is used to authorize Grafana to scrape the Kafka metrics, so we recommend that you create a new key specifically for the Grafana Cloud integration.
Also, note the Confluent Cloud Resource IDs of the resources you’d like to monitor. You can monitor Kafka, Kafka Connect, ksqlDB, and Schema Registry components. Confluent Cloud Resource IDs are named “ID” in the Confluent Cloud UI and are available from the CLI as well. You can also use the Confluent Cloud descriptors endpoint to list available resources to monitor. An example resource ID for a Confluent Cloud cluster is lkc-or7g9. This repository contains some simple scripts for generating the API key and obtaining the resource IDs.
How to set up the API key and find resource IDs in Grafana Cloud
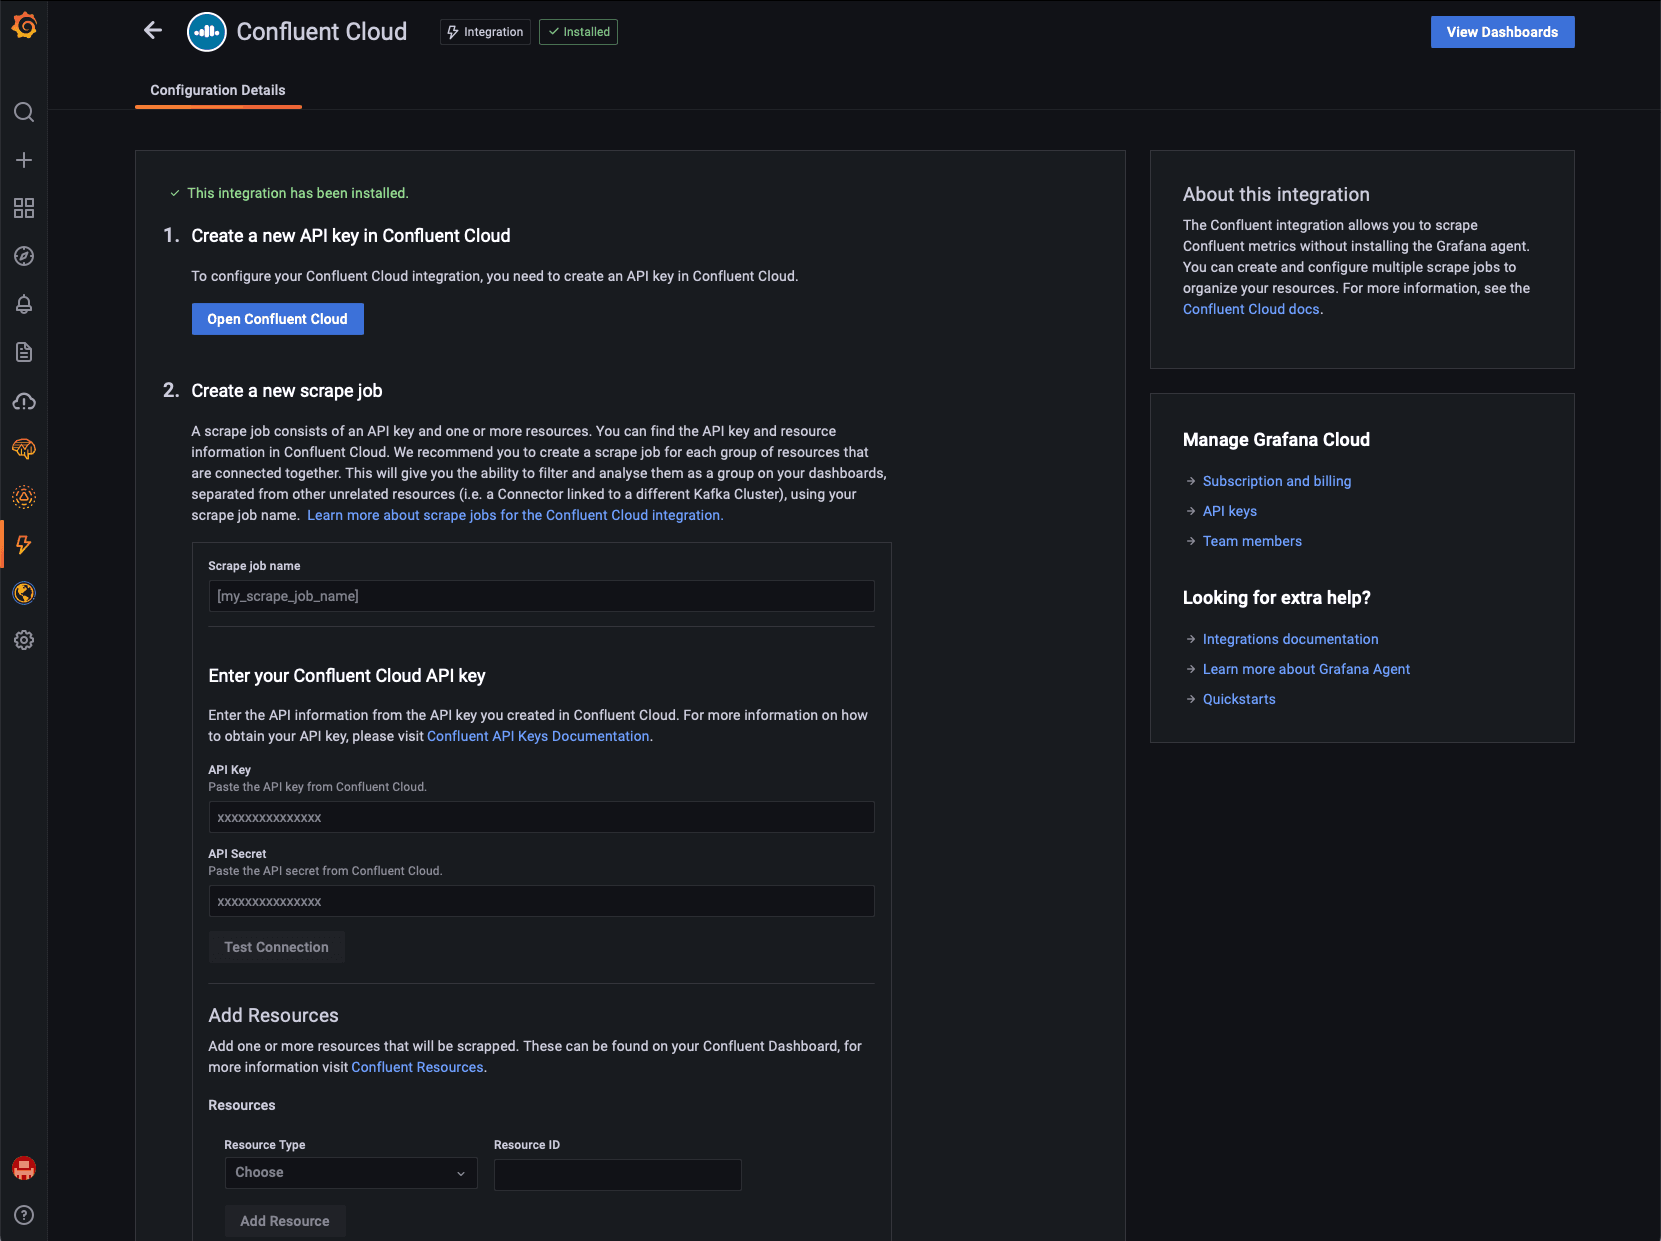
Navigate to the Integrations and Connections section of Grafana Cloud, and choose Confluent Cloud in the list. Here you can create and manage any number of jobs, or sets of configuration dictating which resources to scrape metrics for.
Give the job a name, and provide the Confluent Cloud API key you created above. Make sure to test the connection to ensure everything is configured correctly!
Following this, select the resources from which you wish to collect metrics. Choose Resource Type from the dropdown and provide the ID of the resource you would like to monitor.
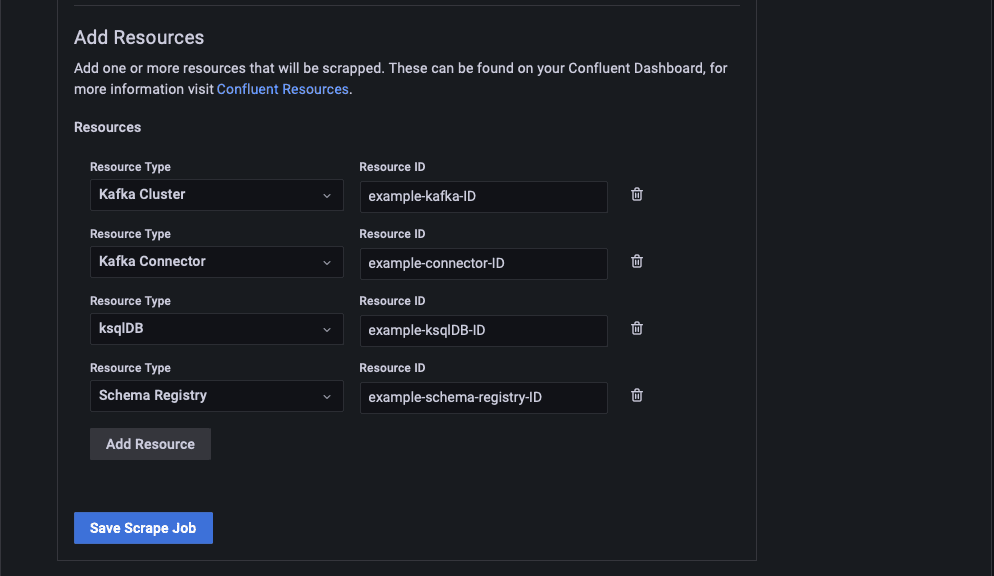
Finally, click Save Scrape Job to finish connecting your account. At this point, Confluent Cloud will begin pushing your Confluent resource metrics into your Grafana Cloud account.
Monitoring Confluent Cloud with Grafana Cloud
Once set up, the pre-built Confluent Cloud dashboard will be installed, enabling you to quickly jump in and visualize your resources. The dashboard starts to populate immediately, but it might take several minutes to fully populate. Using the provided selectors, you may filter to see specific resources.
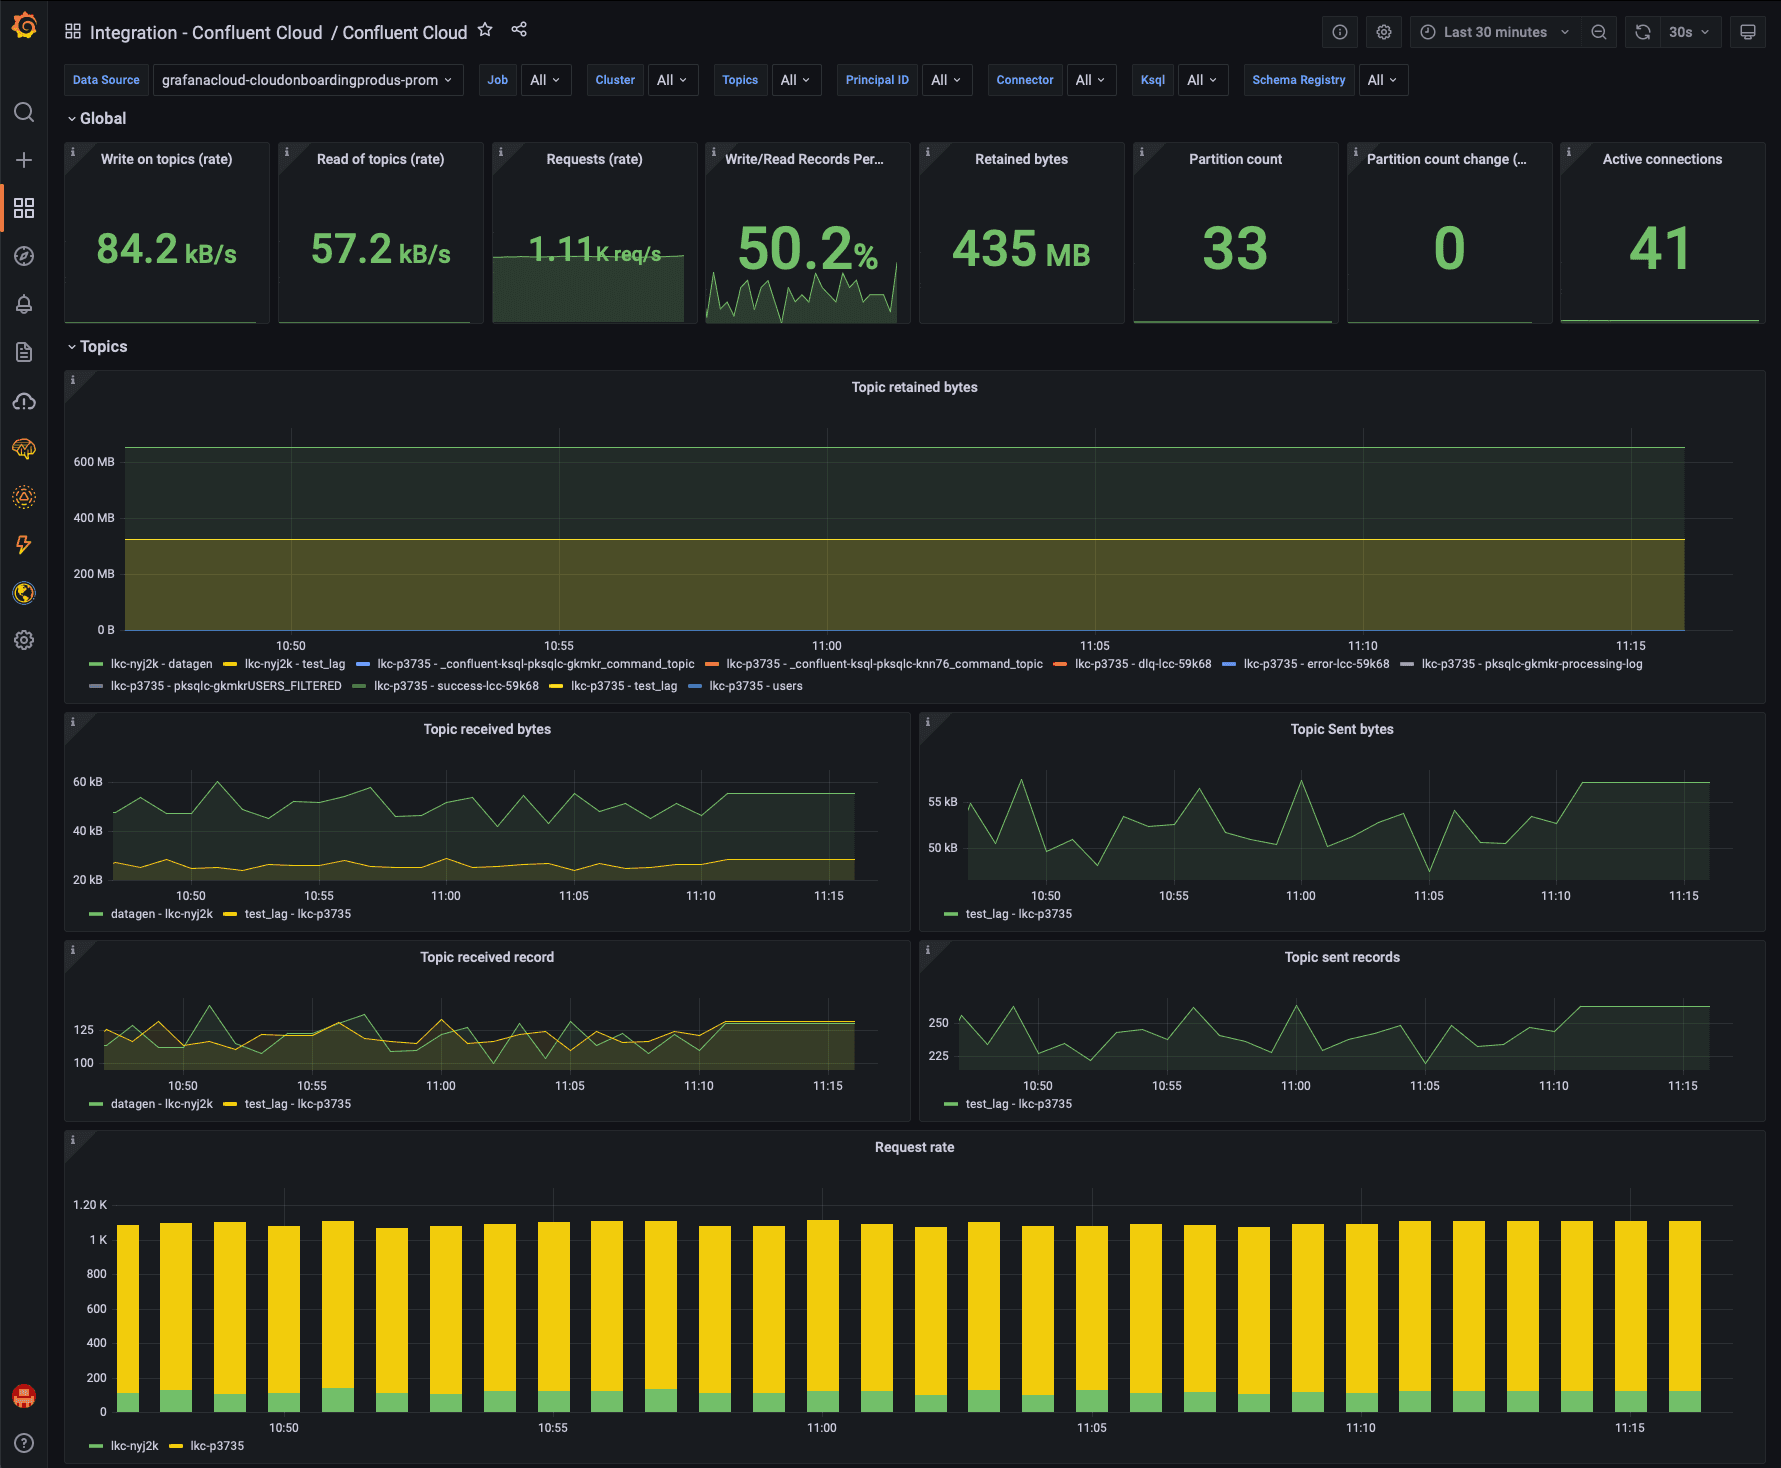
First is an overview of your Kafka clusters (above), providing key indicators such as read/write rate on topics, number of partitions, and active connection count. In more detail, you can find topic-specific information (such as sent, received, and retained bytes as well as request rate) that helps identify hot topics.
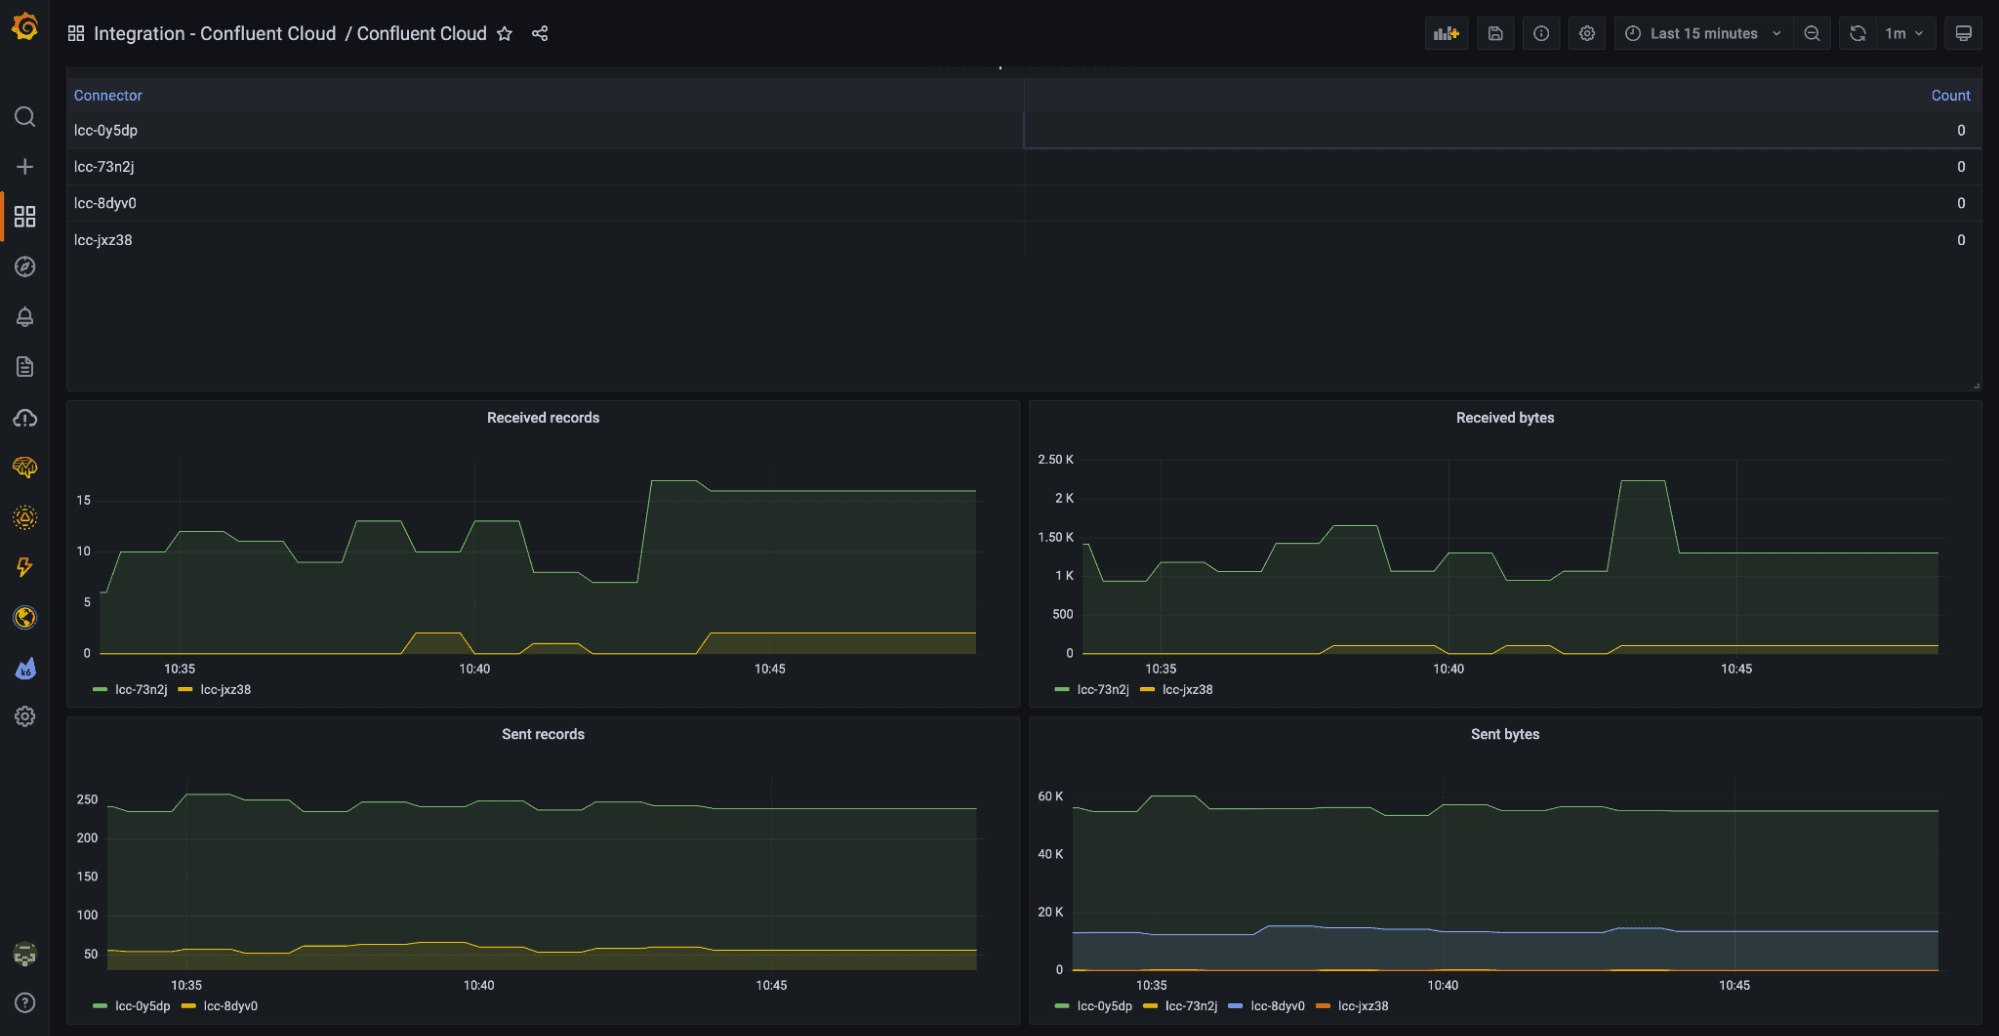
The dashboard also visualizes connector activity (above), so you can see the volume of records they are processing at a glance.
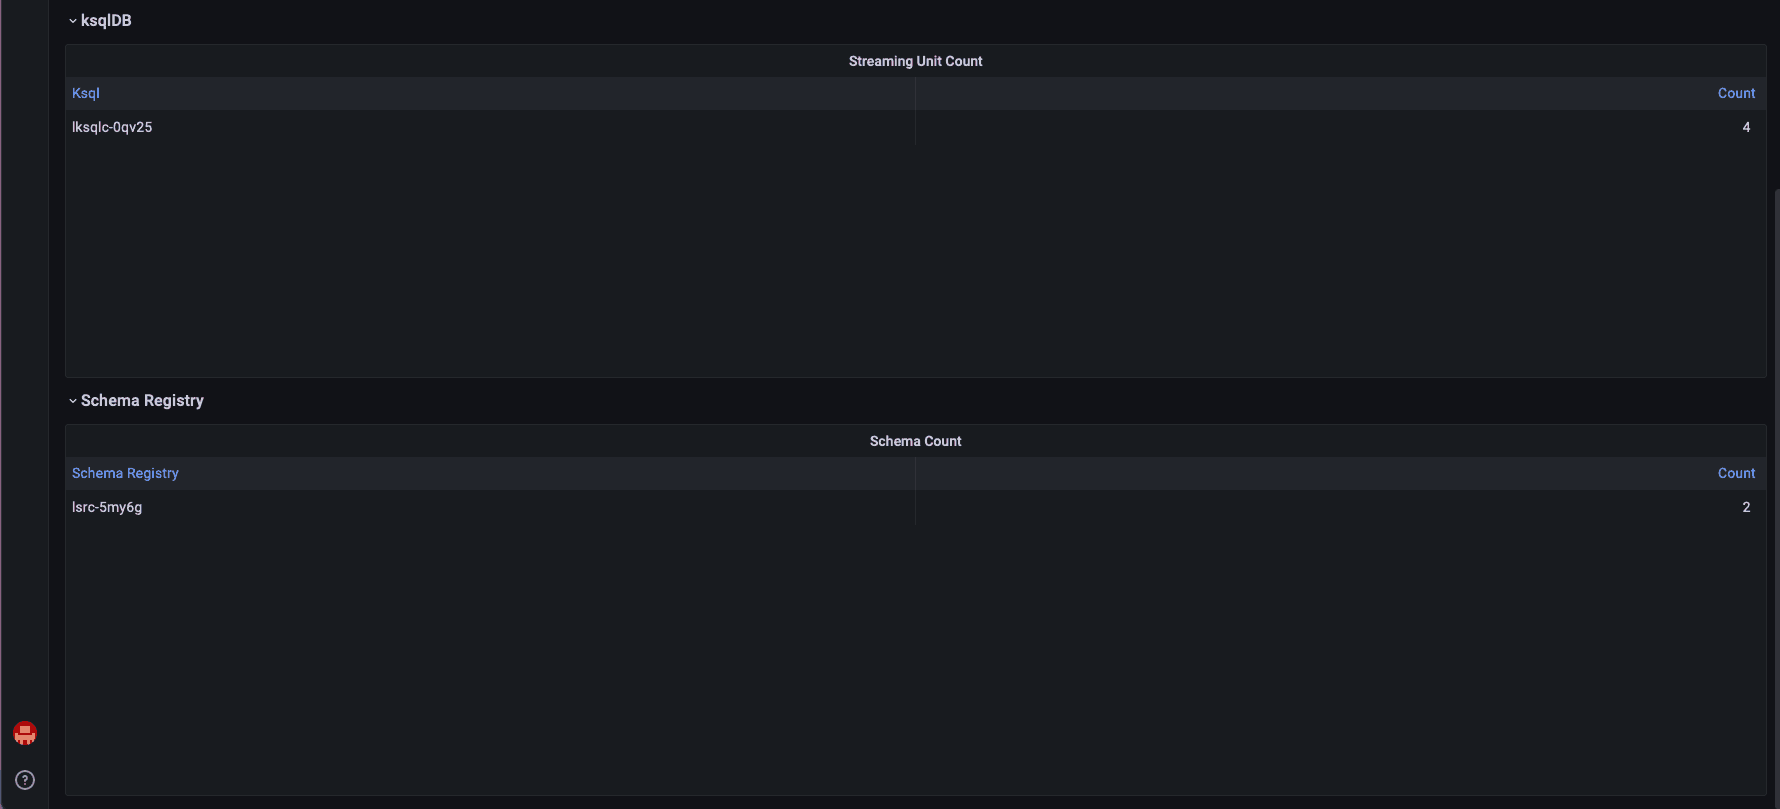
Finally, an overview of the KSQL streams and schemas contained within each schema registry is displayed (as seen above).
And as with all Grafana Cloud integrations, the collected Confluent Cloud metrics are stored within your managed Prometheus service, so you can continue to build new dashboards and alerts with PromQL. For more information about the metrics available, check out the Confluent Cloud integration documentation.
Learn more about the Confluent Cloud integration
The new Confluent Cloud integration for Grafana Cloud makes it easier than ever to monitor your Confluent Cloud setup with just a few simple steps. With the pre-built dashboard, you will focus only on the metrics that matter most — and easily discover when things aren’t right.
To find out more, head over to our Confluent Cloud integration documentation.
We’re excited to hear what you think and welcome your feedback in the #integrations channel of the Grafana Labs Community Slack!
Take the Confluent Cloud integration for a spin in Grafana Cloud, the easiest way to get started with metrics, logs, traces, and dashboards. For a look at our generous forever-free tier and plans for every use case, sign up now!

