How we scaled our new Prometheus TSDB Grafana Mimir to 1 billion active series
Last week, we announced our new open source TSDB, Grafana Mimir, which lets you scale your metrics monitoring to 1 billion active series and beyond. The announcement was greeted with a lot of excitement and interest – and some questions too. Namely: Really, 1 billion?
Yes, really!
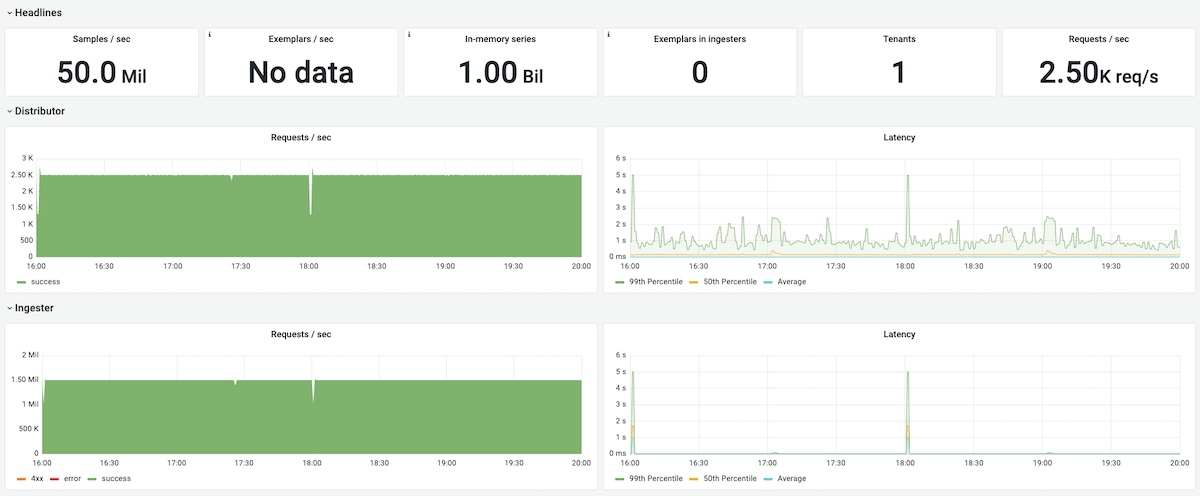
At Grafana Labs, we’ve seen an increasing number of customers scraping hundreds of millions of active time series and needing a solution to reliably store and query such a huge amount of data. We wanted to make sure that Grafana Cloud, which runs on Mimir, could comfortably support this scale before unlocking it for our customers, so in 2021, we performed extensive load testing on Mimir with 1 billion active series. In the course of this testing, we found several issues, which we investigated and fixed one by one.
This blog post walks through how we scaled Mimir to 1 billion active series, what it took to get there, the challenges we faced, and the optimization results we achieved before releasing Grafana Mimir to the public.
Summary
In 2021, we tested a Grafana Mimir cluster with a single tenant having 1 billion active series. We have made substantial improvements to Grafana Mimir since running this test. For commercial customers, we are able to test at higher scales with the explicit intention of publishing our results afterwards.
Cross-cluster querying, a feature of Grafana Enterprise Metrics that increases overall scalability, is out of scope for this article.
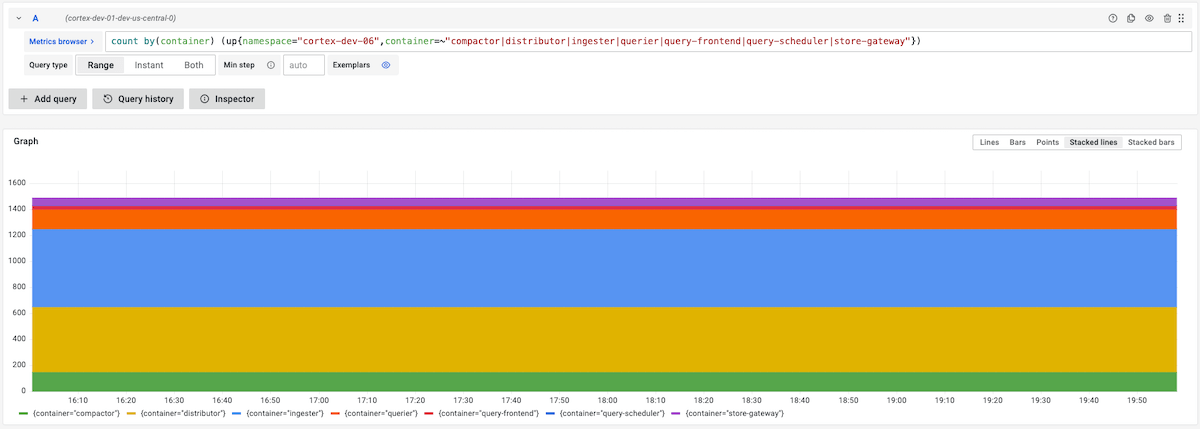
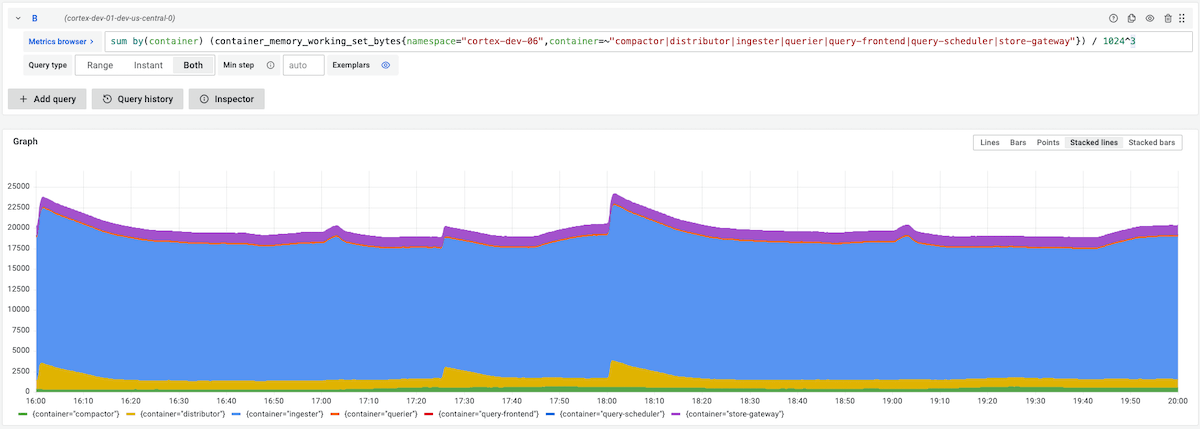
You can replicate our results by running this Grafana k6 script against a Grafana Mimir cluster spanning 1,500 replicas, about 7,000 CPU cores, and 30 TiB of RAM.
What does “1 billion active series” mean?
We mentioned we tested Grafana Mimir with a single tenant having 1 billion active series, but what exactly are “active series”?
Grafana Mimir uses the following nomenclature:
- A value is the result of a measurement. For example, 100 HTTP requests received by a server since startup.
- A sample is a value together with a specific time at which the value was measured. For example, 100 HTTP requests received by a server since startup, measured on 2022-03-30 13:00 UTC.
- A metric is the unique identifier of a resource being measured. It’s composed of the metric family name with labels attached to it. For example, http_requests_total{pod=”app-1”} and http_requests_total{pod=”app-2”} are two different metrics from the metric family http_requests_total.
- A time series (or “series”) is the combination of the metric identifier and any number of samples related to it. For example, http_requests_total{pod=”app-1”} with samples 100@13:00:00 UTC, 105@13:00:15 UTC, and so on.
- An active time series (or “active series”) is a metric which has recorded at least one sample within the last 20 minutes.
Object stores are able to persist almost arbitrary amounts of static data. If you store one sample every 15 seconds for 1 million metrics for a year, you come out at 2 billion samples, 2,102,400,000 to be precise. While this is a large number, any laptop can do this, even more so if it has access to an object store.
It’s similar if you have a lot of churn. Many old time series sitting in storage don’t have any impact on your ingest path or overall management. Only at query time do they become briefly important.
In this blog post, we are talking about 1 billion active series in a single Grafana Mimir cluster: 1 billion time series that have received a sample within the last 20 minutes.
Due to Mimir’s user-configurable redundancy, three ingesters take in every sample by default. For 1 billion active series, 3 billion time series are ingested and later deduplicated back down into 1 billion during compaction.
Please keep this in mind when comparing to other systems.
Load testing with Grafana k6
In order to identify and fix any scalability and performance issues when running Mimir at such a high scale, we set up a testing cluster and used Grafana k6 to run continuous load testing on the system. Our k6 script both continuously writes series and runs random queries, ranging from low to high cardinality, from short to large time ranges, and both range queries and instant queries.
We started the testing with a relatively small load of 200 million active series, and we progressively scaled up over the course of a few weeks, all the way up to 1 billion active series.
What does it take to scale to 1 billion active series in Grafana Mimir?
The scale that’s required to run Mimir with 1 billion active series is … pretty big.
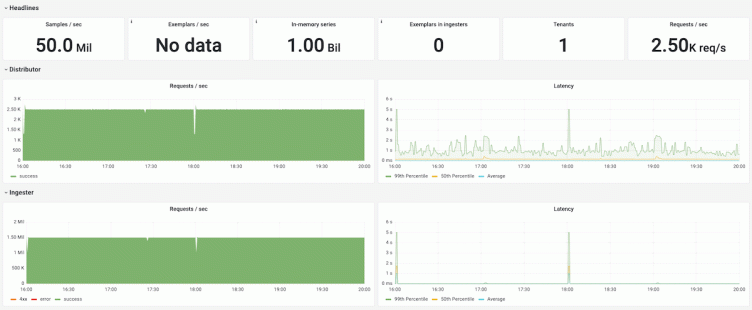
Mimir replicates received series 3 ways, so 1 billion received active series translate into 3 billion time series in the system, which are then deduplicated into 1 billion active series again in storage. The dashboards displayed throughout this blog post show the number of active series.
Moreover, assuming a scrape interval of 20 seconds, the cluster receives about 1 billion / 20s = 50 million samples per second.
Scaling Grafana Mimir: challenges & improvements
In this section, we’ll describe the challenges that arose and the fixes that we made to improve scalability and performance.
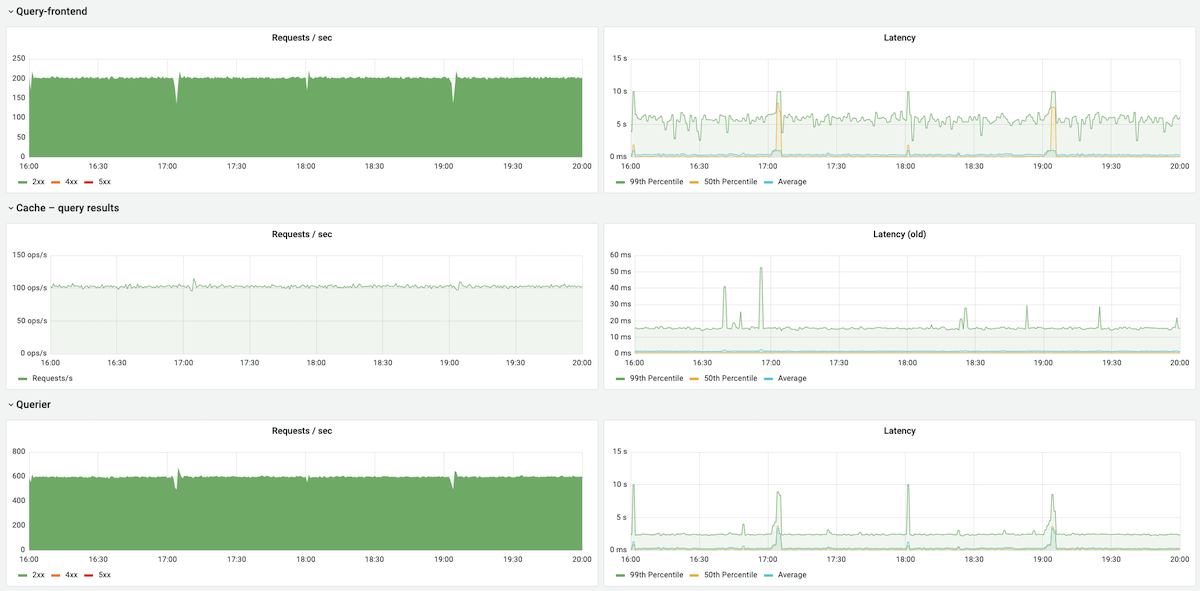
The work we did to improve Mimir allowed us to scale it to 1 billion active series and met the SLOs we defined in the test cluster:
- 99.9% of write requests succeed in < 10 seconds.
- 99.9% of read requests succeed, and average query time is < 2 seconds.
The enhancements we introduced include:
- Total CPU utilization for hash ring over memberlist reduced by more than 90%
- With compactor improvements, all compactions completed within 12h, so no non-compacted block was queried
- Execution time reduced 10x for high-cardinality and CPU-intensive queries
- Asynchronous chunks writing and jitter improvements lowered the 99th percentile latency peak from 45s to 3s
- Disabling TSDB isolation reduced ingesters 99th percentile baseline latency by 90%
- Multi-zone rollout of ingesters and store-gateways reduced rolling out changes from 50 hours to less than 30 minutes
Hash ring
Mimir uses hash rings to share work across several replicas of a specific component. For example, all ingester replicas in the cluster build up a shared ingesters hash ring, which is used to shard and replicate received time series.
The hash ring is a data structure shared across the Mimir replicas using a key-value store. Mimir supports Consul, etcd, or memberlist (based on Gossip protocol).
When the hash ring is stored in Consul or etcd, the entire hash ring is stored in a single key, and the rate at which Mimir replicas can update the ring is limited because compare-and-swap operations can’t run concurrently in the key-value store. Those operations are effectively serialized.
Memberlist overcomes this limitation, and it’s the recommended way to run Mimir. However, when testing Mimir at such a large scale, we found several issues with the memberlist implementation that were effectively limiting its scalability.
We found out that when running a Mimir cluster of about 1,500 replicas of all microservice components combined, each replica was using between 1.6 and 1.9 CPU cores just to propagate ring changes via memberlist. This means a total of about 2,500 CPU cores were used to propagate messages using memberlist.
We investigated, profiled, and benchmarked the related code, and we came up with a set of changes that drastically reduced the CPU utilization. These improvements include:
- Optimize receive path by not cloning current ring state
- Reduce allocations and copies when Merge()-ing states
- Add sync.pool to contain our token map in conflictingTokensExist
- Relax memberlist probe interval and timeout
- Avoid checking for conflicting tokens if no tokens changed
- Do not normalize tokens on subsequent Merge()
For example, the following screenshot shows the CPU utilization reduction in distributors and queriers when we rolled out one of these optimizations. The whole optimization work spanned a few weeks and reduced total CPU utilization for hash ring over memberlist by more than 90%.

While running hash rings over memberlist at such large scale, we also experienced processes being randomly OOMKilled.
We discovered that when sending a high number of messages and/or large messages over memberlist, some packets got corrupted. When the receiver tried to parse such corrupted packets, it incorrectly decoded the packet content length and caused it to allocate very large buffers (order of GBs) to store the decoded packet content. Thus, the process would go out of memory.
We fixed this bug (https://github.com/grafana/memberlist/pull/1) in a forked repository to test it, and then opened https://github.com/hashicorp/memberlist/pull/239 and https://github.com/hashicorp/memberlist/pull/260 to upstream the fixes.
Compactor
The Mimir compactor is the component responsible for compacting multiple TSDB blocks uploaded by ingesters together into a single larger block.
When running the compactor on a tenant with hundreds of millions of active series, we experienced a few critical issues.
First of all, the compactor couldn’t keep up with the compaction workload. Initially, we were running the original Grafana Enterprise Metrics compactor, which was able to concurrently compact blocks covering different time ranges, but compacting same-time-range blocks took a very long time. At the same time, we experienced very bad performance when querying non-compacted blocks.
Second, and most importantly, even if the compactor was able to finish the compaction, the resulting compacted block was broken. The reason is that TSDB has some limitations, like 64GB maximum index size or 4GB maximum size of some TSDB index sections, because each index section’s size is stored in a 32bit integer in the index.
To overcome these limitations, we built a new compaction algorithm, called split-and-merge compactor, which enables sharding and horizontally scaling the compaction of same-tenant and same-time-range blocks.

The split-and-merge compactor first groups source blocks into multiple groups, compacts each group, and produces N shards in output. Blocks belonging to the same shard are then further compacted together, resulting in one final block per shard and time range.
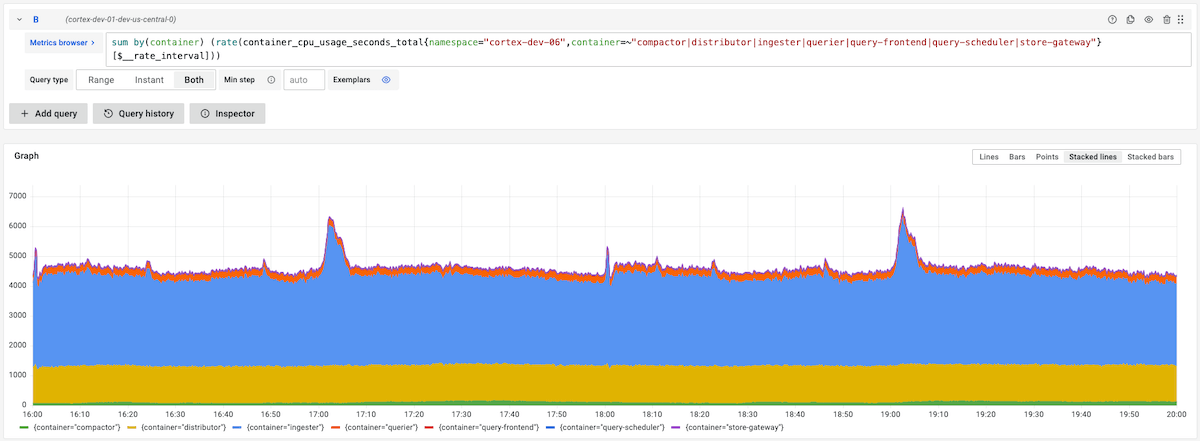
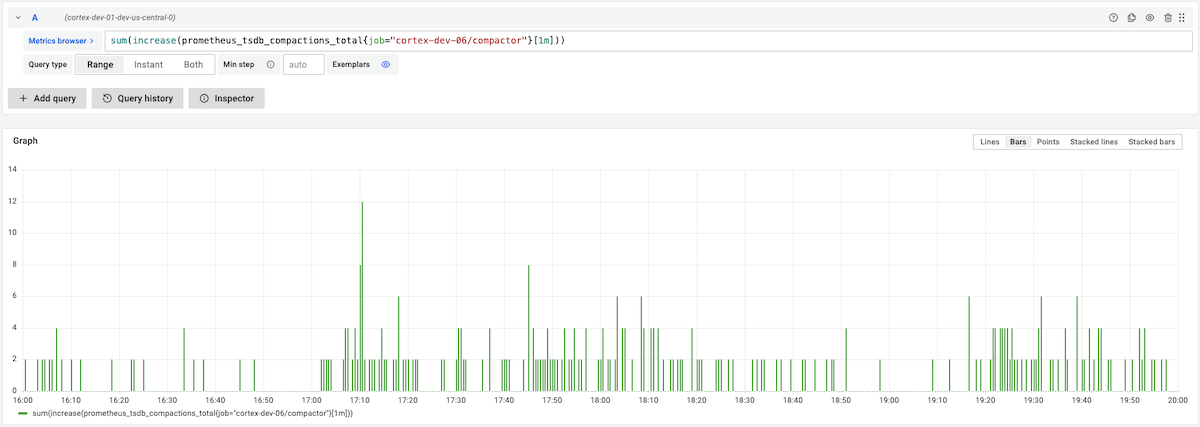
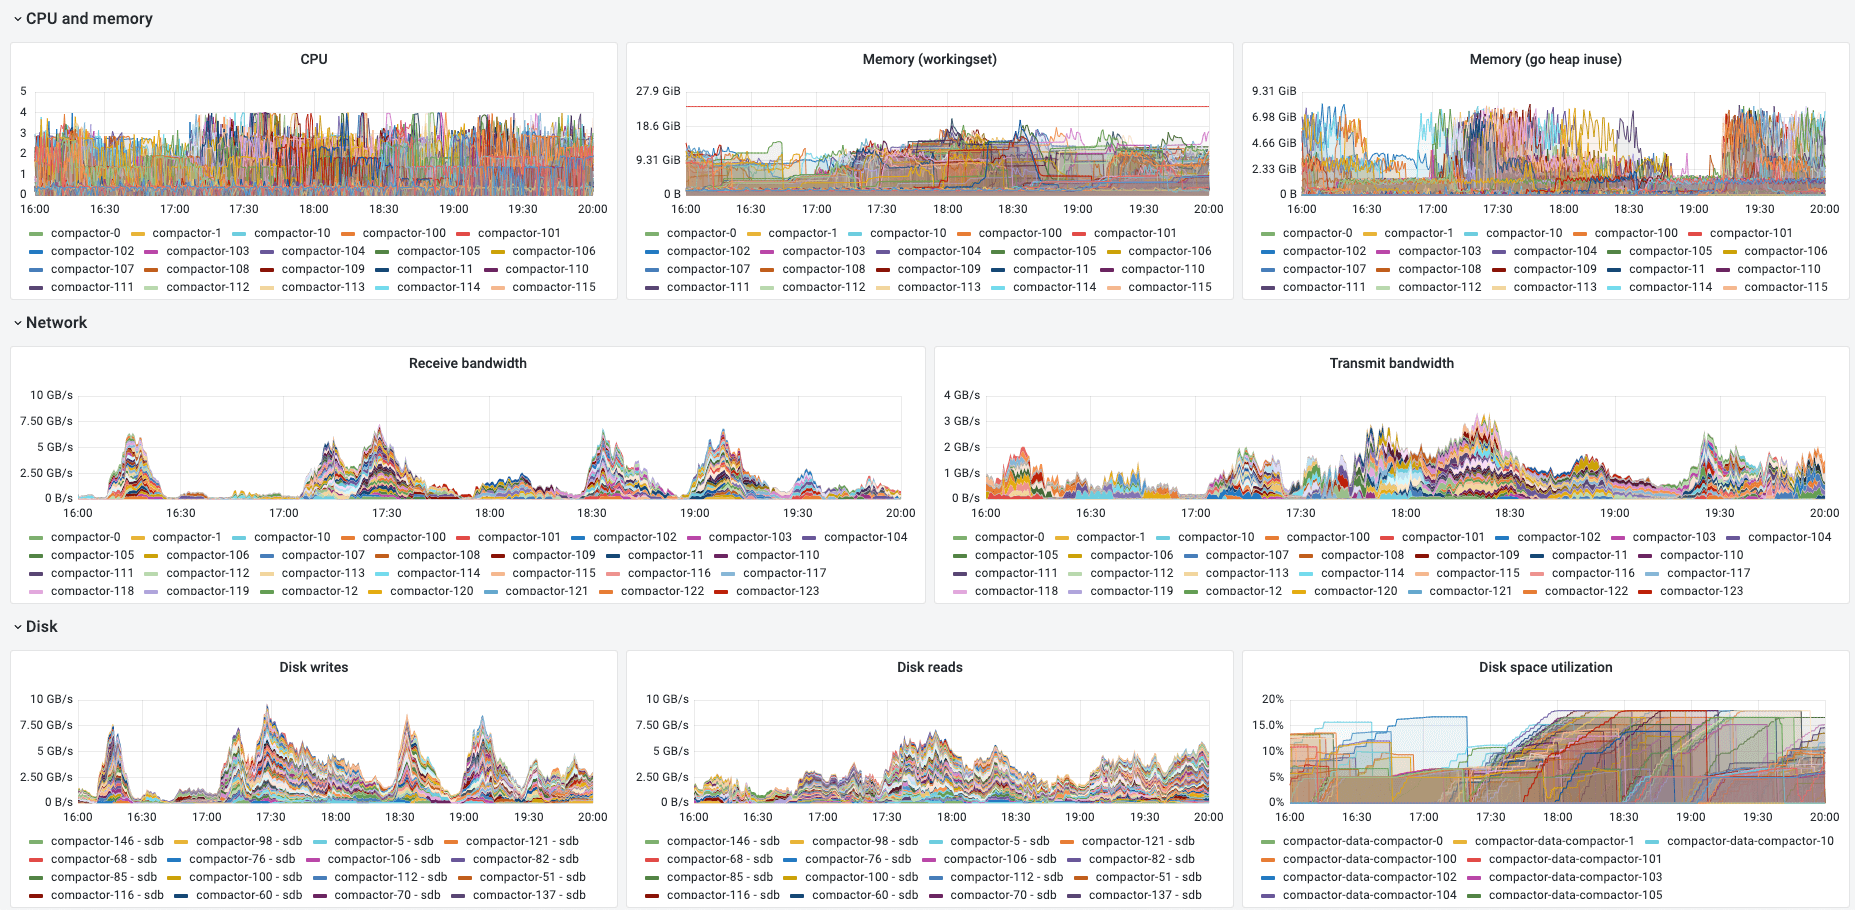
For each split group and merge shard, compaction jobs can run in parallel, distributed across multiple machines. For example, the following screenshot shows the CPU utilization across 150 compactor replicas, processing compaction for one single tenant with 1 billion active series:

Running the split-and-merge compactor we’ve been able to successfully shard and compact blocks for the testing tenant having 1 billion active series. All compactions were completed within 12h, in order to guarantee no non-compacted block was queried.
To learn more about the split-and-merge compactor, refer to our blog post that takes a deep dive into how the Mimir compactor works, and check out the Mimir compactor documentation.
High-cardinality queries
Running Mimir with 1 billion active series is not just about being able to ingest such a large volume of metrics, but also being able to effectively query them.
Mimir uses the Prometheus PromQL engine, which is single-threaded. The execution of a single query is limited by the speed of a single CPU core. This can negatively impact query performance for high-cardinality or CPU-intensive queries.
To overcome this limitation, Mimir combines two main strategies to scale the execution of a single query across multiple CPU cores and machines:
- Shard a query by time (time splitting)
- Shard a query by series shards (query sharding)
Time splitting breaks long-range queries into multiple queries. If a query spans over multiple days, it gets split into multiple one-day queries, and each query runs in parallel.
Query sharding builds on top of time splitting, and breaks the series dataset into smaller pieces. These smaller pieces are called shards. Each shard then gets queried in a partial query, and those partial queries are distributed across multiple machines. The results of those partial queries are then aggregated, and the full query result is returned to the client.
We tested query sharding extensively. We observed, on average, a 10x reduction in execution time for high-cardinality and CPU-intensive queries.
For example, the following screenshot shows the same high-cardinality query, running on the same Mimir cluster, with and without query sharding enabled. (Each test was run with empty caches.) Execution time was reduced from 37.7s to 3.9s:

We are working to support sharding for more query types. At the moment, 60% of all customer queries running across Grafana Cloud are sharded.

To learn more, refer to the Mimir query sharding documentation.
Ingester disk I/O operations distribution
One of the most challenging issues we’ve experienced on the write path is related to how TSDB head chunks are written to disk.
A chunk is a slice of data containing up to 120 samples of a single time series. Chunks are kept in memory until full, and then they are written to disk. Since a chunk can’t span over multiple blocks, chunks are written to disk — even if they’re not full — at the two-hours boundary of each block.
In the test environment, we used a scrape interval of 20 seconds, so it took 40 minutes to get a series’ chunk full. In this scenario, all non-churning series fill their chunks nearly at the same time, precisely within a 20-second interval.
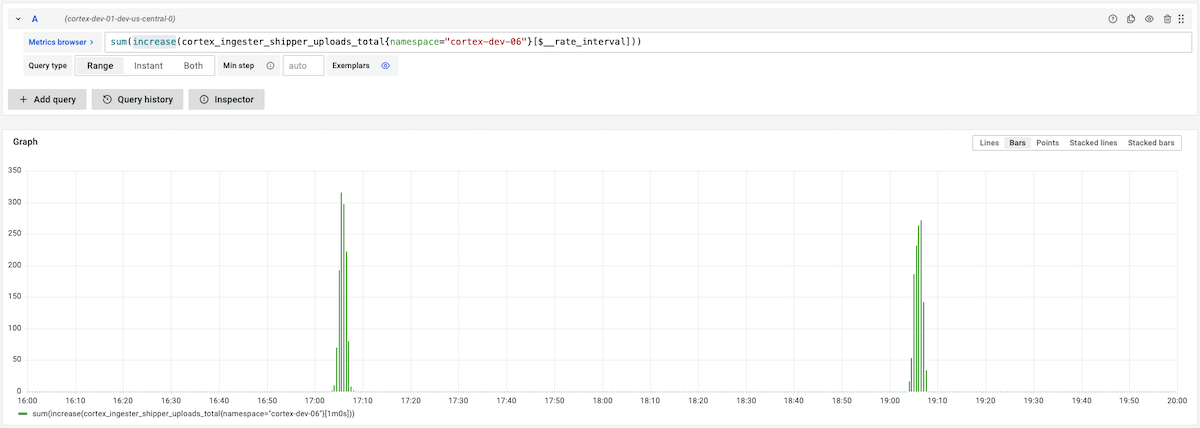
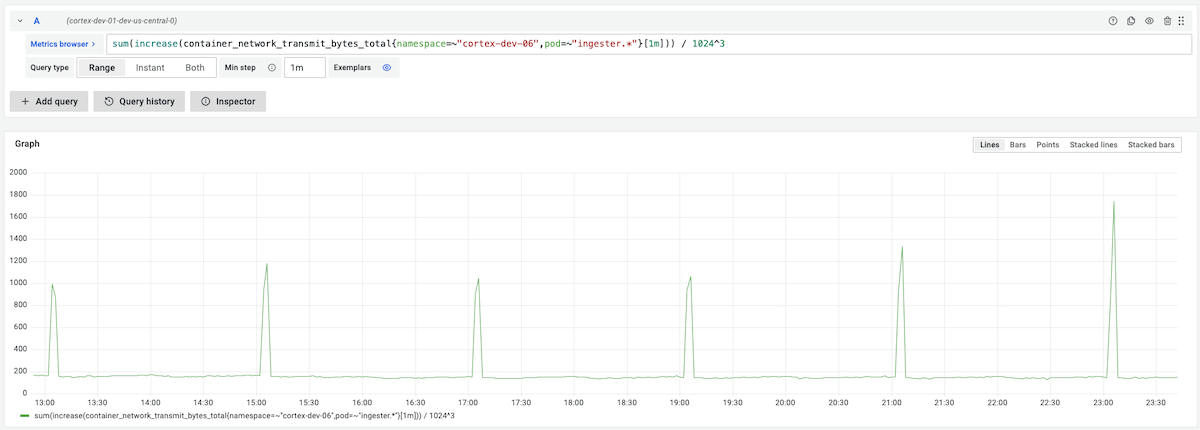
In TSDB, the I/O operation to write chunks to disk is synchronous, thus blocking a given series until completed. In a cluster with a moderate load, this is typically not a problem, thanks to the OS kernel write buffer, but it could become problematic under high load. In our test, each ingester was writing about 7GB to disk, every 40 minutes, in the span of a few seconds, when all chunks were written at nearly the same time.
The screenshot below shows the write latency in seconds we experienced. Every 40 minutes, the 99th percentile write latency was spiking from about 10ms to between 20s and 60s.

The first change we introduced to mitigate this issue was a jitter to the maximum size of a chunk. Instead of having it hard-coded to 120 samples, we made it possible to configure a jitter expressed as % variance. The idea is that by introducing a variance, each chunk would get full at a slightly different time, effectively spreading the chunks writing over a large period of time.
The jitter, which is still in use, partially solved the problem. The screenshot below shows that after introducing the jitter (rolled out at about 10:30), the number of spikes reduced from 3 to 1 every 2 hours.

The reason why it solves the issue just partially is because a chunk can’t span across multiple blocks. Every two hours, at the boundary of each block time range, all chunks are forced to close and are written to disk.
To further mitigate this, we worked to change the chunks writing logic in TSDB to a queue-based approach, with a background process to asynchronously write chunks to disk. We did this work in Mimir first and then proposed to upstream it to Prometheus.
To test the impact on write latency while writing TSDB chunks to disk, we deployed the async write queue only to ingesters in zone-a and kept the old code running in zone-b and zone-c. The following screenshot shows that the async write queue reduced the 99th percentile peak from 45s to 3s:

Prometheus TSDB enhancements
While working on scaling Mimir to 1 billion active series, we encountered some other TSDB performance bottlenecks and issues that we investigated and fixed.
We found a race condition during the TSDB WAL replay, which was causing subsequent blocks compacted from the TSDB head to contain out-of-order chunks. After testing the fix internally, we opened an upstream PR to fix it.
We’ve introduced some tricks to optimize the label’s regular expression matcher here and here up to 90% CPU reduction for some common regular expressions we see in Grafana Cloud. We also introduced support for compactor blocks opening and writing parallelization here and here. We have proposed upstreaming some of the changes, and they’re currently under discussion whether they fit in the Prometheus use cases (for example, here).
Finally, we disabled TSDB isolation in Mimir ingesters. TSDB isolation is a feature that wasn’t used in Mimir, due to its distributed architecture, but was introducing a significant negative impact on write latency caused by a high lock contention on TSDB isolation lock. Disabling TSDB isolation reduced ingesters 99th percentile latency by 90% in our 1 billion active series test cluster.
Multi-zone rollouts
Running a large Mimir cluster introduces serious challenges even to rollout changes. When Mimir is deployed in microservices mode, ingesters and store-gateways should be rolled out sequentially in order to guarantee no failures on the write and read paths during the rollout.
In a Mimir cluster with 600 ingesters, assuming each ingester takes 5 minutes to roll out (most of the time is spent replaying the WAL), it will take 50 hours to roll out a change to all ingesters. Clearly, this doesn’t scale.
To speed up rollouts, we leveraged Mimir zone-aware replication. Instead of treating ingesters individually, we treat them as grouped by zones. On the level of zones, roll-outs still need to happen sequentially. Within zones, an arbitrary number of ingesters can be rolled out concurrently.
To coordinate the rollout across multiple zones, we’ve built and open-sourced a generic Kubernetes operator that enables a concurrent rollout of multiple StatefulSet pods in the same zone, and guarantees pods in different zones are not rolled out at the same time. Mimir jsonnet supports multi-zone deployment with the rollout-operator too.
When deploying Mimir in multiple zones with the Grafana rollout operator, the rollout time decreased from being a function of the number of replicas to being a function of the number of zones. This decreased the ingesters rollout from 50 hours to less than 30 minutes.
Leverage Grafana Mimir for yourself
To learn more about Mimir and how to deploy it yourself:
- Read our extensive documentation
- Follow our tutorial to get started
- Sign up for our April 26 webinar
- Join our Grafana Labs Community Slack
And if you’re interested in helping us scale Mimir to the next order of magnitude, we’re hiring!

