

Get started with metrics, logs, and traces in our new Grafana Labs Asia Pacific webinar series
While many companies offer one-size-fits-most observability solutions, Grafana Labs has a very different approach: We want to help you with your observability, not own it.
We not only provide you with the best open source products and services for metrics, logs, traces, and more. We are committed to helping you optimize your experience — and your output — using your entire stack, no matter what tools you use and where in the world you use them.
Which is why we’re excited to host our first-ever webinar series dedicated to getting started with the Grafana Stack, which will run live within the Asia Pacific time zone throughout April. Whether you’re new to Grafana or an experienced user, there is something for everyone in these weekly webinars, which will highlight the latest features in our tools; live demos from Grafana Labs technical experts; and opportunities to ask your specific questions.
Learn more below and register (for free!) for one or all our upcoming sessions. And we hope to offer more live sessions in the Asia Pacific region soon as Grafana Labs expands its teams in Singapore, Australia, India, and beyond.
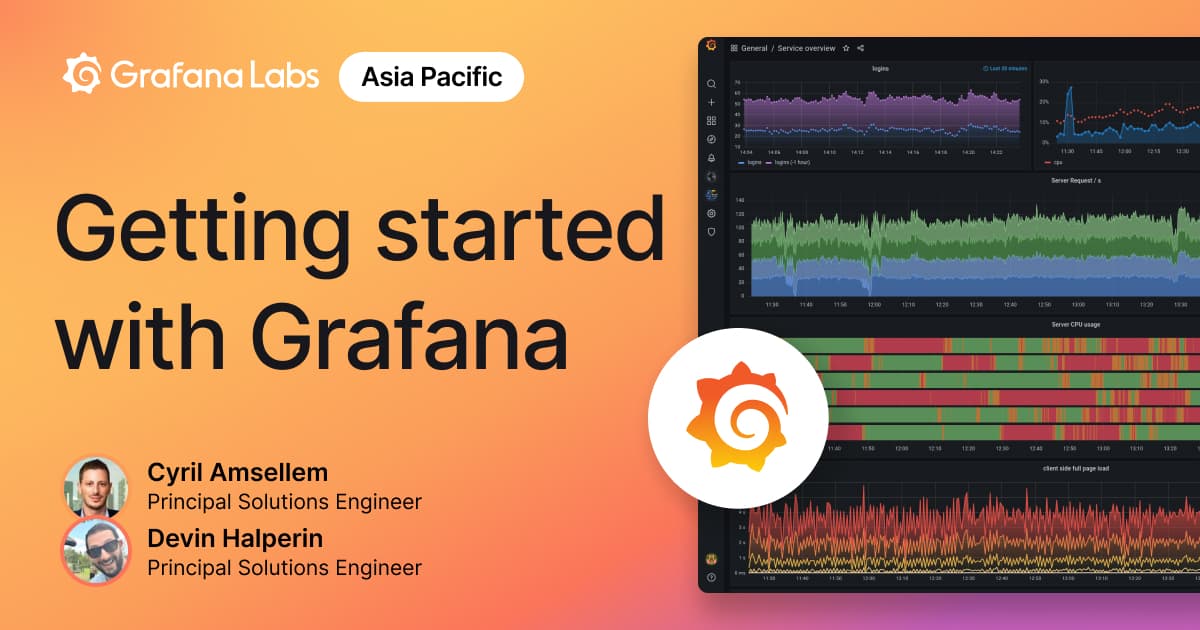
Getting started with Grafana
Tuesday, April 5 11:00 SGT,13:00 AEST, 03:00 UTC
In this session, we’ll walk through how to easily get started with Grafana while showing you how to set up monitoring for a web service that uses Prometheus and Grafana Loki to store metrics and logs. You’ll see how to bring together disparate data sources and build dynamic Grafana dashboards by using our new and updated visualizations and themes as well as data source improvements. We’ll also demo how to correlate your metrics, logs, and traces in Grafana to reduce your MTTR/MTTI and focus on your business initiatives.
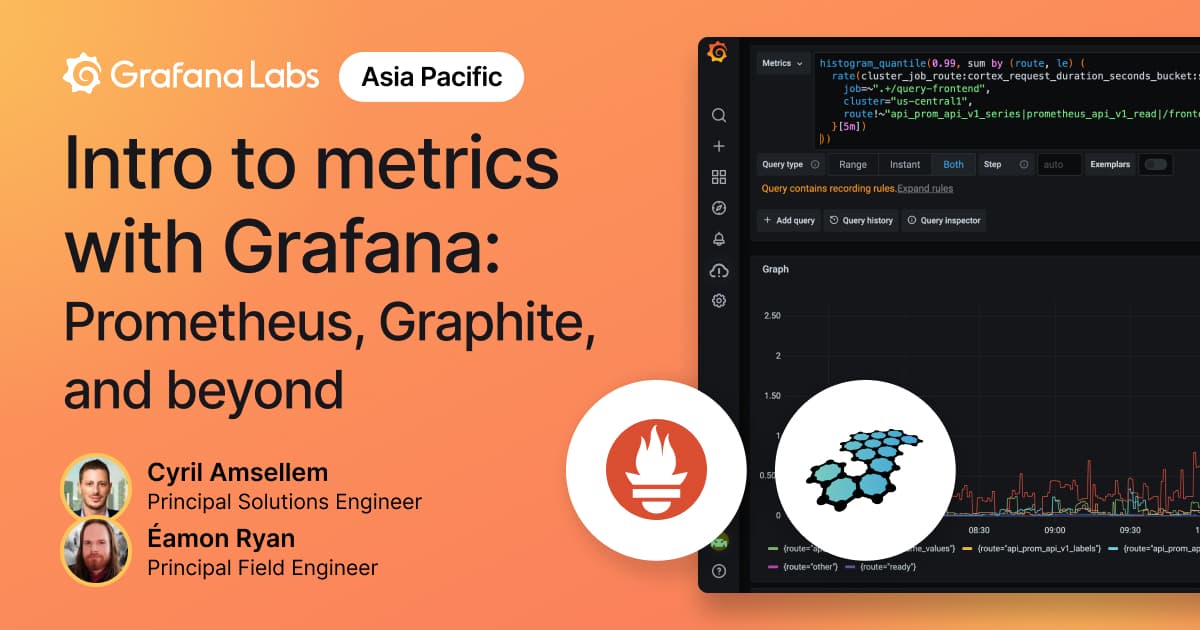
Intro to metrics with Grafana: Prometheus, Graphite, and beyond
Tuesday, April 12 11:00 SGT,13:00 AEST, 03:00 UTC
Prometheus has become the metrics management standard for modern and cloud native applications. However, enterprises that use Prometheus at scale face scalability, availability, legacy, and security challenges. Grafana Labs provides a simple and scalable solution for unifying your metrics across multiple systems, enabling both real-time and historical analysis in Grafana Cloud or self-hosted on your own infrastructure.
In this session, you will learn how to get started with Grafana using your existing metrics system, and you’ll see Grafana in action with a demo on how to easily set up ingest to querying, and create dashboards. As an added bonus, you’ll also get an inside look at Grafana Mimir, the most scalable open source time series database in the world.
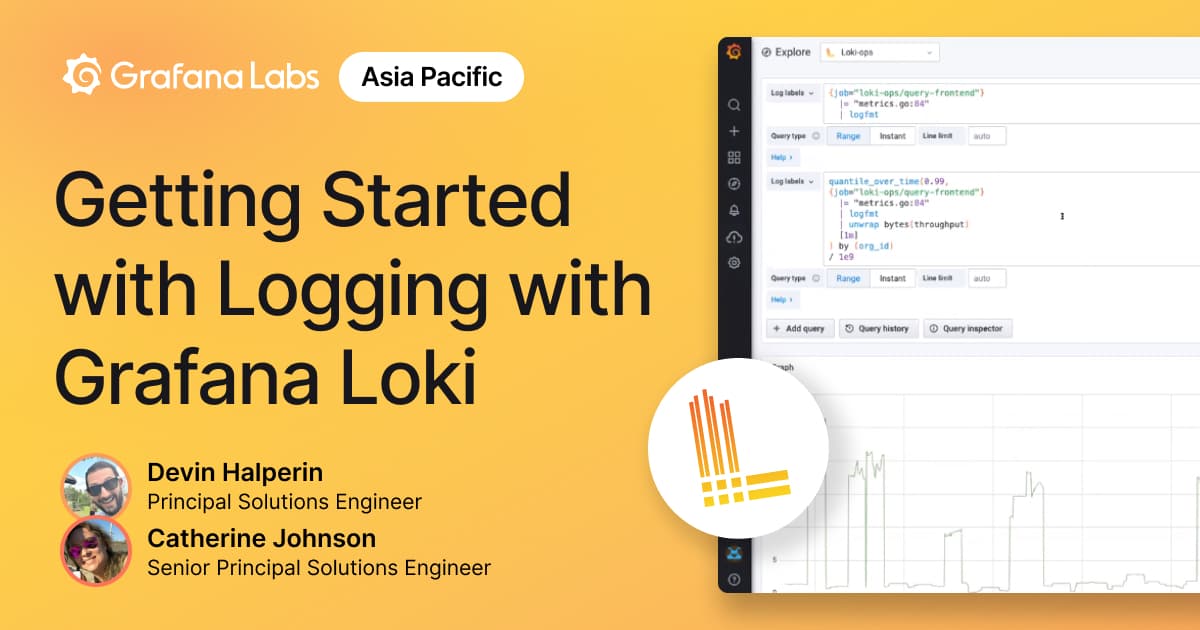
Getting started with logging and Grafana Loki
Tuesday, April 19 11:00 SGT,13:00 AEST, 03:00 UTC
The shift to cloud native and microservices architectures has led to an explosion in log volume. In this third installment of the Grafana Asia Pacific webinar series, you’ll learn about Grafana Loki, a logging system that only indexes the metadata surrounding the logs, not the log lines themselves, making it fast, cost-effective, and highly scalable. Using the same service discovery features as Prometheus, Loki allows you to easily correlate your metrics and logs. Our Grafana Labs technical experts will walk through a live demo to display the power of the LogQL query language, and how to use it for use cases such as debugging, monitoring, analytics, and alert management.
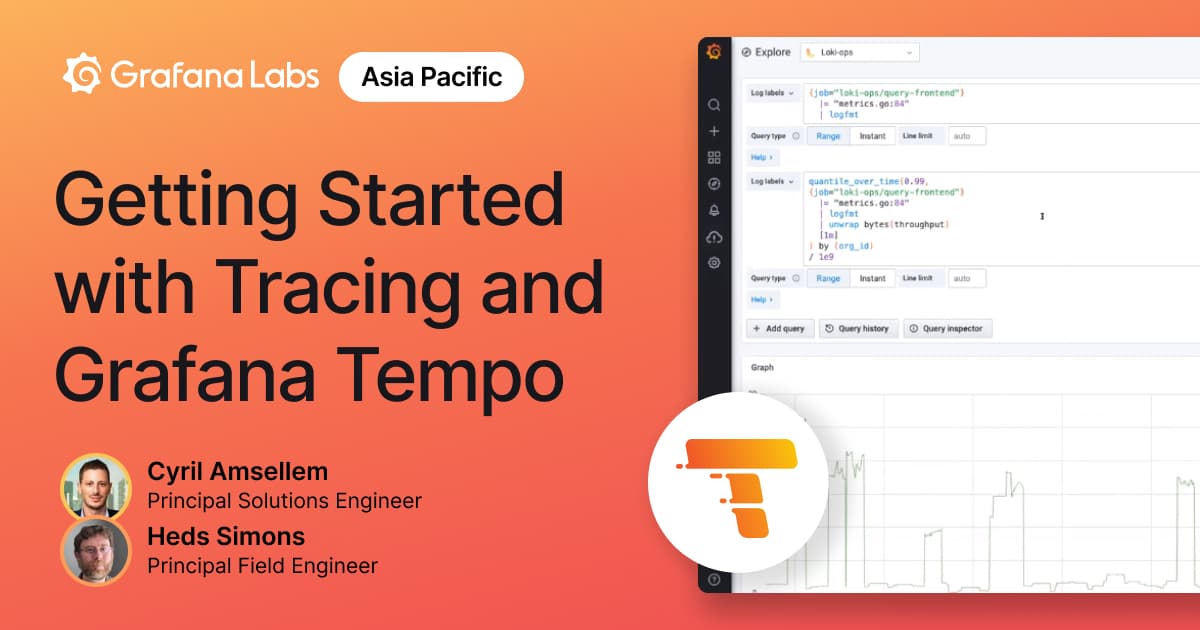
Getting started with tracing and Grafana Tempo
Tuesday, April 26 11:00 SGT, 13:00 AEST, 03:00 UTC
Grafana Tempo is a high-volume distributed tracing backend whose only dependency is object storage. Unlike other tracing backends, Tempo can hit massive scale without a difficult-to-manage Elasticsearch or Cassandra cluster. Instead Tempo supports search by trace id only. In this session, we will use an instrumented application to demonstrate how to use logs and Prometheus exemplars to find traces effectively and efficiently in Tempo. The demo will also hit on the basics of operating Tempo and reveal how Tempo allows us to scale tracing as far as possible with less operational cost and complexity than ever before.
Check out all of our webinars and on-demand conference videos for in-depth demos, deep dive discussions, helpful Q&As, and more!

