Managed self-hosted Git service Gitea with the new integration for Grafana Cloud
Today I’m back with another integration available for Grafana Cloud, our observability platform that gathers all your metrics, logs, and traces under a single roof with Grafana.
I’m going to highlight how you can use Grafana with Gitea, an open source forge software package for hosting software development version control. It uses Git as well as other collaborative features like bug tracking, wikis, and code review. It is a great choice for those who manage Git repositories.
The basics
Metrics can be used as important signals that are indispensable in predicting and isolating service failures or performance issues. However, metrics also have another important use: analytics.
The recently released Gitea 1.16 introduced new analytical metrics that provide insights on the most used and active repositories and issue labels. We thought that made it a great time to provide you with a dashboard that can help with catching performance issues and understanding your Gitea usage patterns.
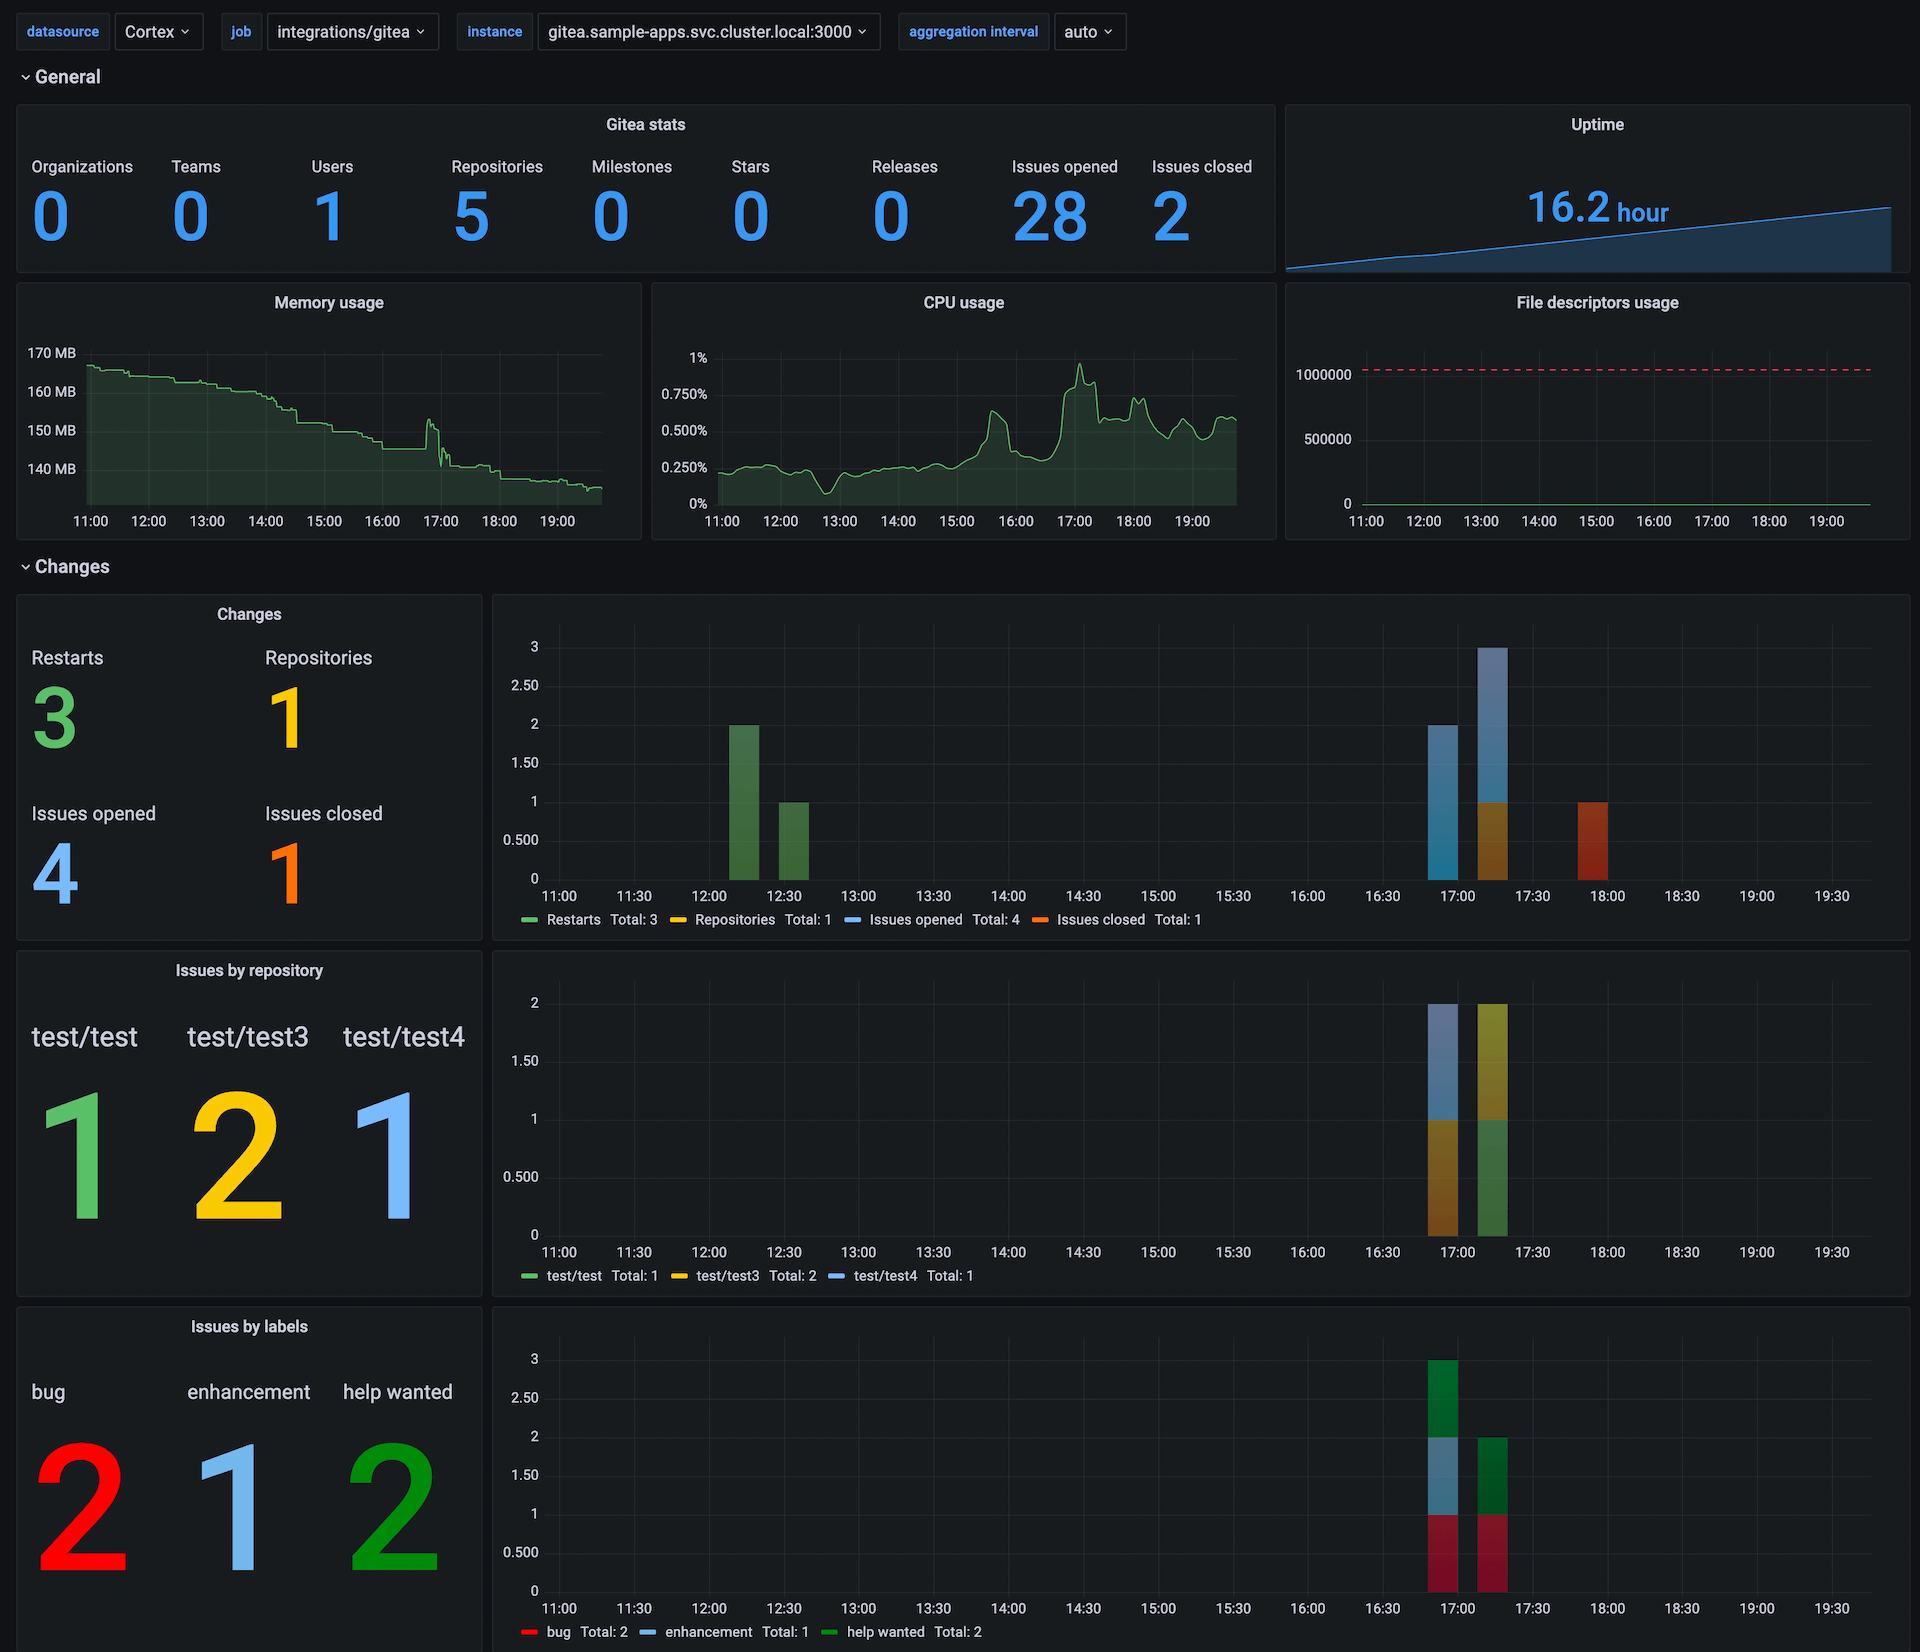
Here is what the Grafana dashboard looks like:

The General row has all the main stats and helps you track the number of real-time users, repos, and open/closed issues. Key indicators such as CPU and memory usage are also present for performance monitoring.
In the Changes row, instead of totals you’ll see only new occurrences of Gitea stats. This will allow you to:
- Understand how many new issues were opened in each repository in a specified period of time (i.e., find repos with the most issues last week)
- Observe how many issues labeled “bug” Gitea has across all your repositories
- Determine what was the busiest week for your team. (To get an idea, pick predefined Grafana intervals like “Previous week” and set the aggregation interval to 1 day. This will give you 1-day aggregations and totals for the whole week as well.)
Get started!
The integration for Gitea is available now for Grafana Cloud users.
If you’re not already using Grafana Cloud, we have a generous free forever tier and plans for every use case — sign up for free now! It’s the easiest way to get started with metrics, logs, traces, and dashboards. For more information on monitoring and alerting on Grafana Cloud and Gitea, check out our docs or join the #integrations channel in the Grafana Community Slack.
Stay tuned for future content on how to best utilize the Grafana Cloud integrations. And tell us what you’d like to see! You can chat with the Cloud Integrations team on our Community Slack.


