Best practices for alerting on Synthetic Monitoring metrics in Grafana Cloud
Ever wonder what your application looks like from the “outside in”? Synthetic monitoring can give you a global overview of your application from your customer’s point of view, observing how systems and applications are performing by simulating the user experience.
One tool to help achieve this is the Synthetic Monitoring app, which is a blackbox monitoring solution available in Grafana Cloud. You can use Synthetic Monitoring to monitor your services from all over the world. As of today, we have probes in 22 locations. We also support private probes to run checks from any location you want, including running checks in secure networks.
The Synthetic Monitoring checks will send data into your Grafana Cloud account. (Don’t have a Grafana Cloud account? Sign up for free today!) From there, you can query, visualize, and alert on your data, like other Prometheus metrics, inside Grafana.
Alerting made easier in Synthetic Monitoring
While working with our customers, we realized that there are some pain points that are specific to alerting on Synthetic Monitoring metrics. Over time, we accumulated some best practices to make setting up Synthetic Monitoring alerts easier and more effective.
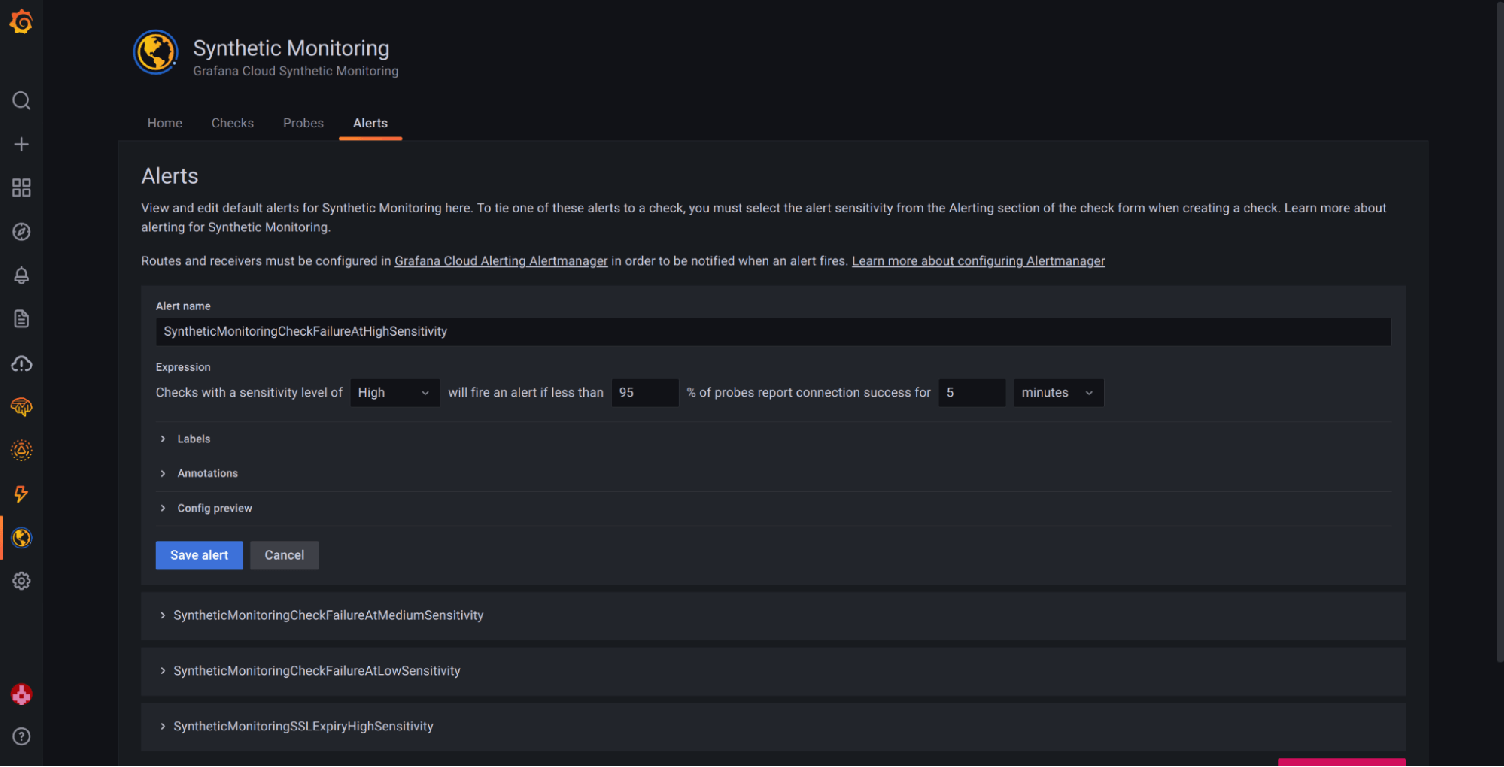
We also made product changes to simplify alerting on your metrics. We introduced a set of predefined alerts under the Alerts tab in the Synthetic Monitoring app, which will help you create alerts with just the click of a button. For more, please see our Synthetic Monitoring alerting docs.
While the predefined alerts are some of the most common ones implemented, they may not be sufficient for all users. For those who need to expand their alerting, we also published a blog on the Top 5 user-requested synthetic monitoring alerts in Grafana Cloud, which includes some popular alert expressions and more details on how you can create your own custom alerts.

Best practices for Synthetic Monitoring alerts
Here is a list of guidelines to improve your alerts in the Synthetic Monitoring app for Grafana Cloud.
Note: Synthetic Monitoring metrics are Prometheus metrics so some of the best practices outlined here will also apply to general Prometheus alerting.
Recording rules
- Create a recording rule when you want to create multiple alerts on a metric with different thresholds. Recording rules will make it easy to manage the alerts because you can avoid duplicating the full query expression in each alert rule.
- Recording rules are recommended for faster alert evaluations when there are multiple alerts on the one underlying metric.
- Recording rules will generate metrics, and these metrics will be included in active series for billing. To avoid recording rules with a high cardinality, use
sum byon labels that you are using in alerts, and drop the rest of labels by leaving them out of sum by.
Alert expressions
- Avoid setting a short range in alert expressions. Using a short range in an alert with low frequency checks (i.e., 120 seconds) can result in false alerts due to missing or late data.
- Note: Range defines the time (amount of time we look back from now) when evaluating alerts. Adjust the range accordingly in your alert expressions.
- When alerting on latency metrics, we recommend using percentiles.
- Use
sum by ()in alert expressions to reduce resulting series, and only sum on the labels you want in your alerts.- For Synthetic Monitoring alerts, we recommend keeping
Probelabel out ofsum by ()and not alerting on individual probes.
- For Synthetic Monitoring alerts, we recommend keeping
- Use the
forclause in alert rules to wait for a certain duration before an alert is considered active. This can help with flapping alerts or alerts that are firing for momentary failures that self-correct (e.g: error due to bad route between probe and target). See Prometheus: Understanding the delays on alerting for a detailed explanation of alert lifecycles. - Avoid alerting on a gauge metric directly (e.g:
probe_successmetric). A flapping gauge will resetforduration and alerts will NOT fire. But if you must, usesum_over_timeoravg_over_timequery functions on the metric in the alert rule. Read more on Alerting on gauges in Prometheus 2.0.
Alerting on probes
- Alerting at the probe level is not recommended. Probe level alerts can result in false alerts due to network issues between a probe and target. You might see intermittent errors on a single probe due to issues in networking between the probe and target, and you might get alerted until the internet routes around the problematic network.
- Use 3 or more probes in your checks for reliable alerts. Alerting on checks running on a single probe is not recommended.
- We recommend not filtering on individual probes in alert expressions. This can result in unreliable or flapping alerts.
Testing alert expressions
- Use Grafana Explore to test alert expressions. It’s a quick way to look at past data and see in what cases your alert would have fired.
- You can look at the
ALERTS{}Prometheus time series to see which alerts are active (pending or firing) or were active.
Learn more
We hope this guide will help you create better and more effective alerts for your Synthetic Monitoring metrics — and avoid common pitfalls that can cause false or flapping alerts.
If you’re interested in learning more, check out our webinar “Introducing Synthetic Monitoring,” which you can watch for free on demand. Plus, below are some additional resources worth checking out:
- Synthetic Monitoring alerting | Synthetic Monitoring Docs
- Grafana Cloud alerting | Grafana Cloud Docs
- Defining alerting rules | Prometheus Docs
- Recording rules | Prometheus Docs
- PromQL Query functions
- PromQL Operators
- Active series and DPM | Grafana Cloud Docs
If you have any more questions about Synthetic Monitoring alerts, please check out Grafana Cloud support options.
If you’re not already using Grafana Cloud — the easiest way to get started with observability — sign up now for a free 14-day trial of Grafana Cloud Pro, with unlimited metrics, logs, traces, and users, long-term retention, and access to one Enterprise plugin.