
How to publish messages through Kafka to Grafana Loki
Back in November 2021, Grafana Labs released version 2.4 of Grafana Loki. One of the new features it included was a Promtail Kafka Consumer that can easily ingest messages out of Kafka and into Loki for storing, querying, and visualization.
Kafka has always been an important technology for distributed streaming data architectures, so I wanted to share a working example of how to use it to help you get started. If you want to try it out, all you need is Grafana Cloud — sign up for a free forever account here.
The basics
Logs are an important part of the metrics, logs, and traces trilogy, though logs are generally only thought of as log lines (lines of textual data) with a timestamp and fields tagging metrics such as response time or HTTP error codes. These types of logs lines are often sourced from tail-written files that were written by applications and services running on infrastructure.
The open source project Grafana Loki provides a Prometheus-like experience, but for logs, and it has some very interesting performance and cost advantages over traditional logging solutions.
Grafana Loki offers great flexibility to ingest and query traditionally formatted logging data as well as data in JSON that is event-based. This opens up new possibilities to use Loki for event-based use cases such as IoT devices pushing location data (coordinates), environmental data (temperature, humidity, rain), and industrial fleet asset management data.
The Grafana Agent and Promtail provide single-instance binary agents to source, parse (extract metrics, correlate metrics), and pipeline logs, which are then forwarded to Loki.
Using the Service Discovery feature of the Grafana Agent and Promtail, logs can be sourced from:
- Kubernetes Pods
- Journal Scraping on Linux
- Windows Event Log
- Gcplog (GCS buckets, Load Balancer, etc.)
- Syslog Receiver
- HTTP Client
Getting started
In the GitHub repository Grafana Kafka Example, you’ll find all of the components you need to produce messages to a Kafka Broker, consume them using Promtail, and remote write them to Grafana Loki.
Architecturally, the deployment looks like this:
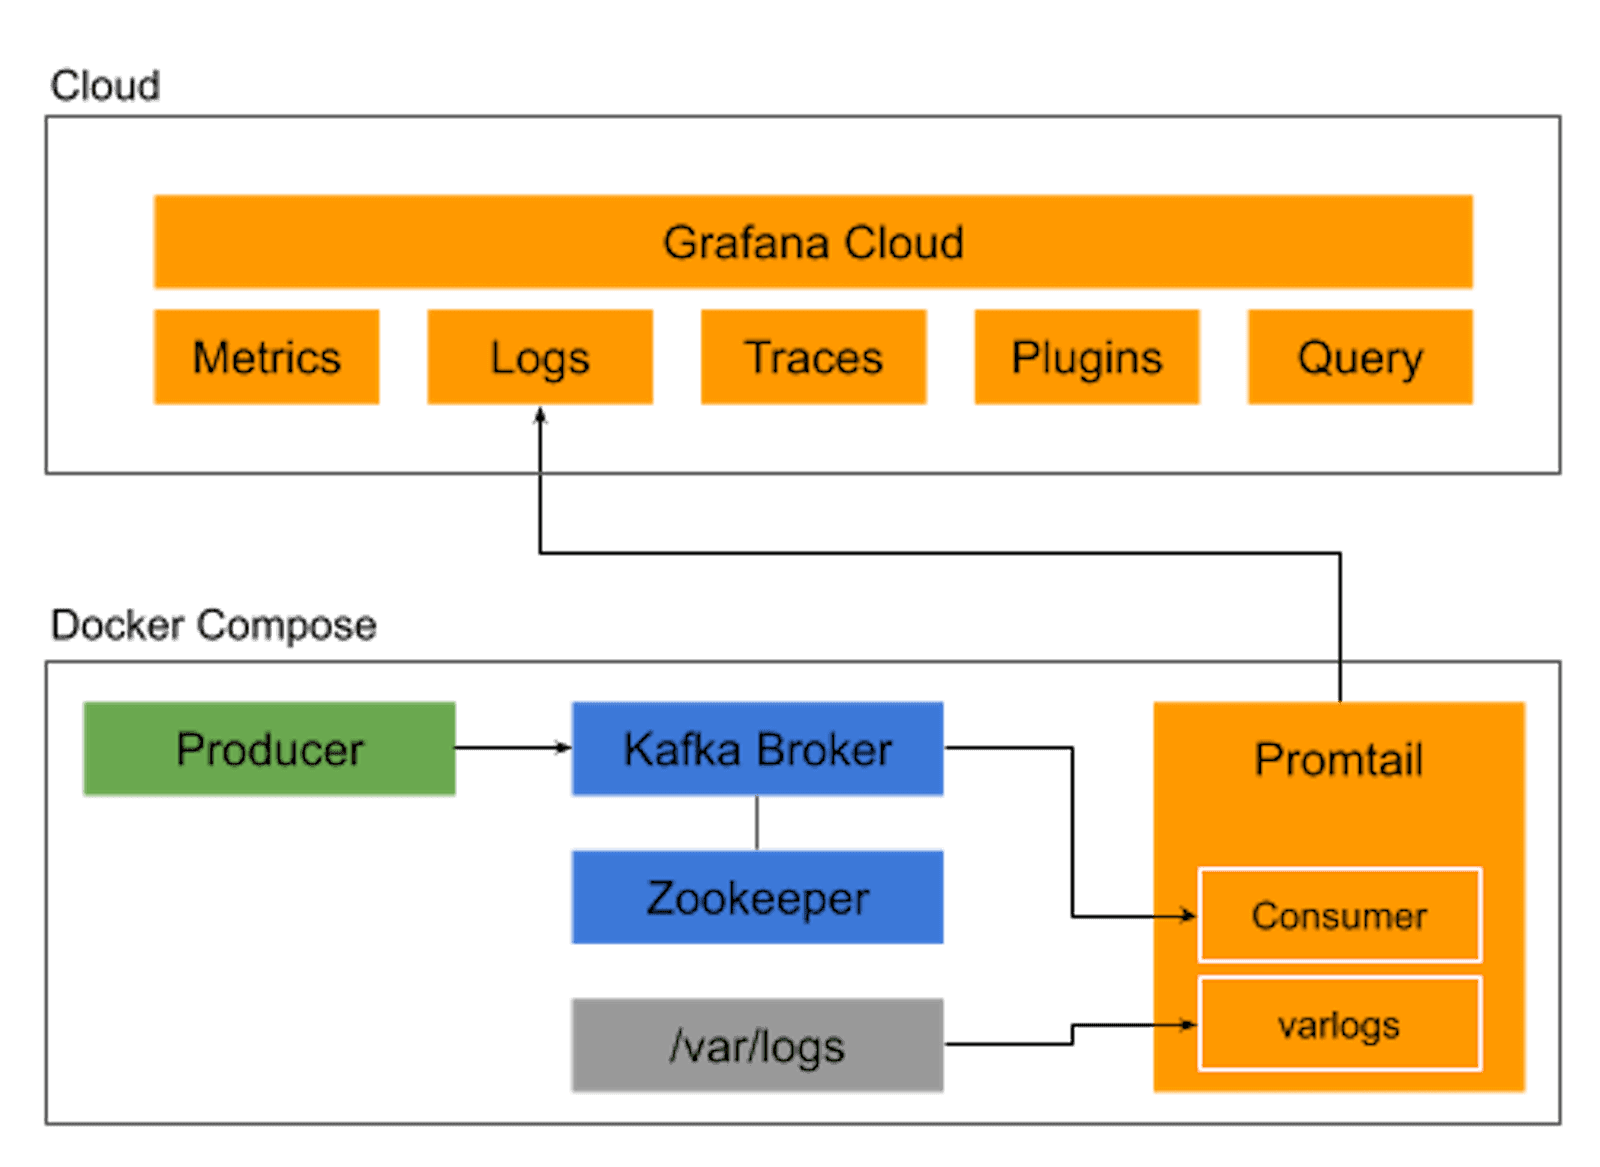
Four containers are used in the deployment:
- Producer: Generates synthetic messages and pushes them to the Kafka Broker
- Promtail: Consumes the Kafka messages and remote writes to Grafana Loki
- Kafka Broker: Manages topics, partitions, producers, consumers, and messages
- Zookeeper: Tracks the status of Kafka nodes
Grafana Loki ingests, stores, and enables querying of the log messages it receives from Promtail, and Grafana provides the capabilities to create dashboards and to visualize the messages.
Scale and redundancy are handled as follows:

As you can see, the Kafka Broker creates the Topic grafana with four partitions. The partitions allow the Producers and Consumers to scale by providing independent streams for messages to flow through.
The Producer is a single container; however, it repeatedly schedules four concurrent threads, with each thread producing messages to one of the partitions, respectively.
The two Promtail Consumers are automatically balanced across the four partitions. Should one of the Promtail instances terminate unexpectedly, Kafka will rebalance the Partitions to the remaining Promtail instances. Similarly, if more Promtail instances are dynamically added to the consumer group, rebalancing will occur, allocating the partitions as evenly as possible across the consumers.
Given the concurrency in this deployment across the Producer threads, Kafka Topic Partitions, and multiple Promtail consumers, there is a likely chance that messages will be received by Grafana Cloud Logs slightly out of order. Fortunately, Grafana Cloud Logs handles out-of-order writes using a one-hour time window, so logs that are up to an hour old will be accepted.
To try it out yourself, clone the repository and follow the instructions in the Read Me to get a working integration of a Kafka producer, broker, and Promtail producer writing messages to Grafana Cloud Logs.
Visualizing the logs
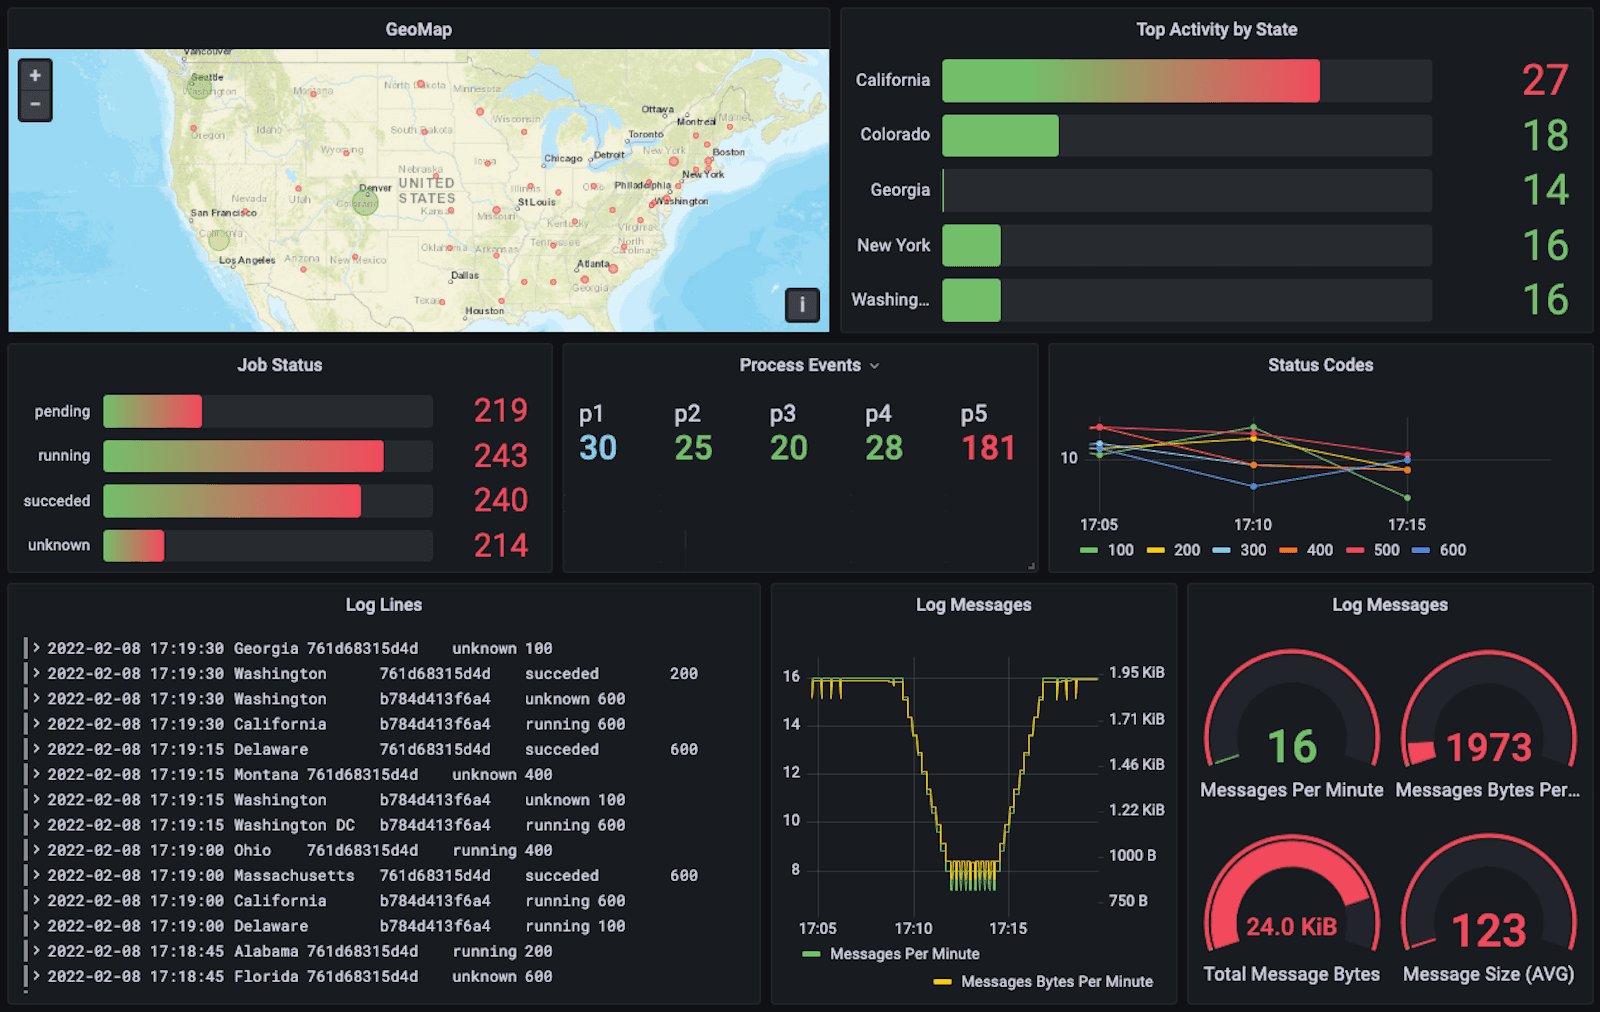
The repository includes an example dashboard for visualizing the data. The dashboard should be imported into Grafana and configured with the Logs Data Source.
The Grafana dashboard below visualizes Loki data generated by the Producer container and uses visualization panels including Geomap, Bar Gauge, Logs, and Stats. Each individual panel uses a different LogQL query illustrating different query types, including: queries that return the contents of lines, queries to calculate values based on query results, the use of log pipelines, and log range aggregations.
Share your thoughts!
Now that messages can be funneled from Kafka to Grafana Loki, you can now use Grafana to bring together your logs with your other observability telemetry to explore, query, visualize, alert on, and share a more complete view of your data with your team.
I hope that you find this content and the working example useful. If you have any feedback, feel free to contact us in the Grafana Labs Community Slack workspace, or reach out directly to me via email.
The easiest way to get started with Grafana Loki is with Grafana Cloud. If you don’t already have an account, sign up now for a free 14-day trial of Grafana Cloud Pro, with unlimited metrics, logs, traces, and users, long-term retention, and access to one Enterprise plugin.

