

What are cardinality spikes and why do they matter?
At Grafana Labs, we spend a lot of time talking to our customers, and something we’ve heard from people in a wide range of organizations is that they want to be able to better manage sudden spikes in cardinality.
Here we will give you a basic overview of what cardinality is and why it’s an important factor in your observability setup, especially when there is a dramatic uptick.
What is cardinality?
The basic definition of cardinality is the number of elements in a given set.
In the world of Prometheus and observability, label cardinality is extremely important because it impacts the performance and resource usage of your monitoring system.
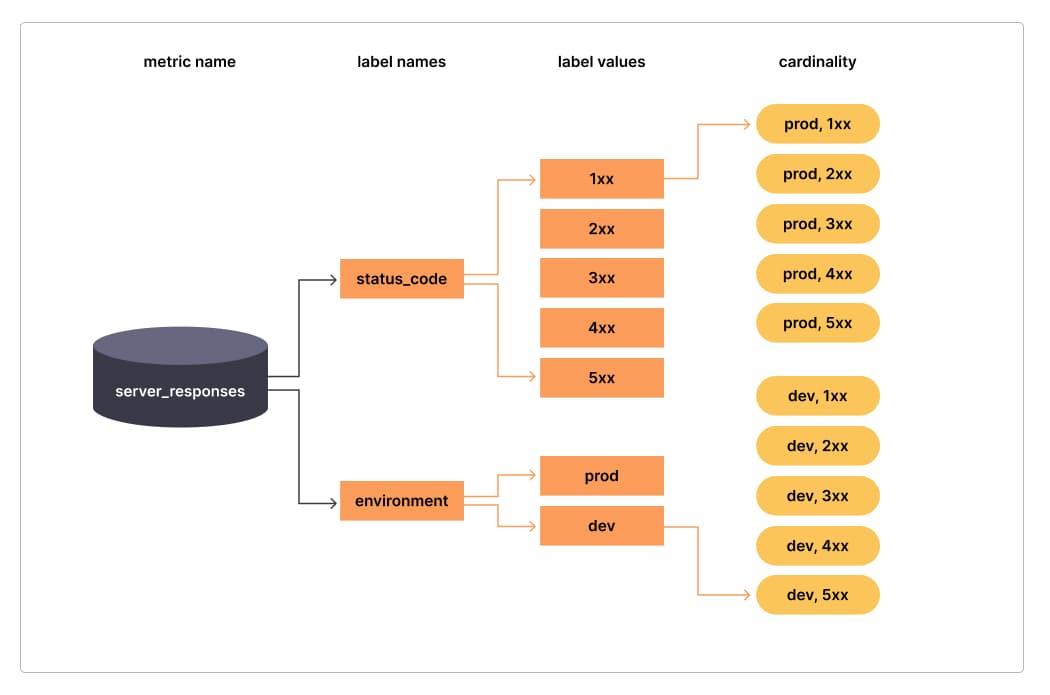
To put it simply: Cardinality is the overall count of values for one label. In the example above, the label status_code has a cardinality of 5, environment has a cardinality of 2, and the overall cardinality of the metric server_responses is 10.
You can have lower cardinality (1:5 label-value ratio), standard cardinality (1:80 label-value ratio), or high cardinality (1:10,000 label-value ratio).
It’s when you have high cardinality that you and your team can start to face challenges with your observability systems, such as high resource usage.
Keep in mind that cardinality corresponds to the number of metrics series. So within this blog post, we will refer to the number of series interchangeably with cardinality.
What causes cardinality spikes?
Something our customers bring up a lot is sudden spikes in cardinality, which is when a metric with medium or lower cardinality suddenly transforms into a metric with high cardinality. This change can have a big impact on your observability system’s performance — and your bottom line.
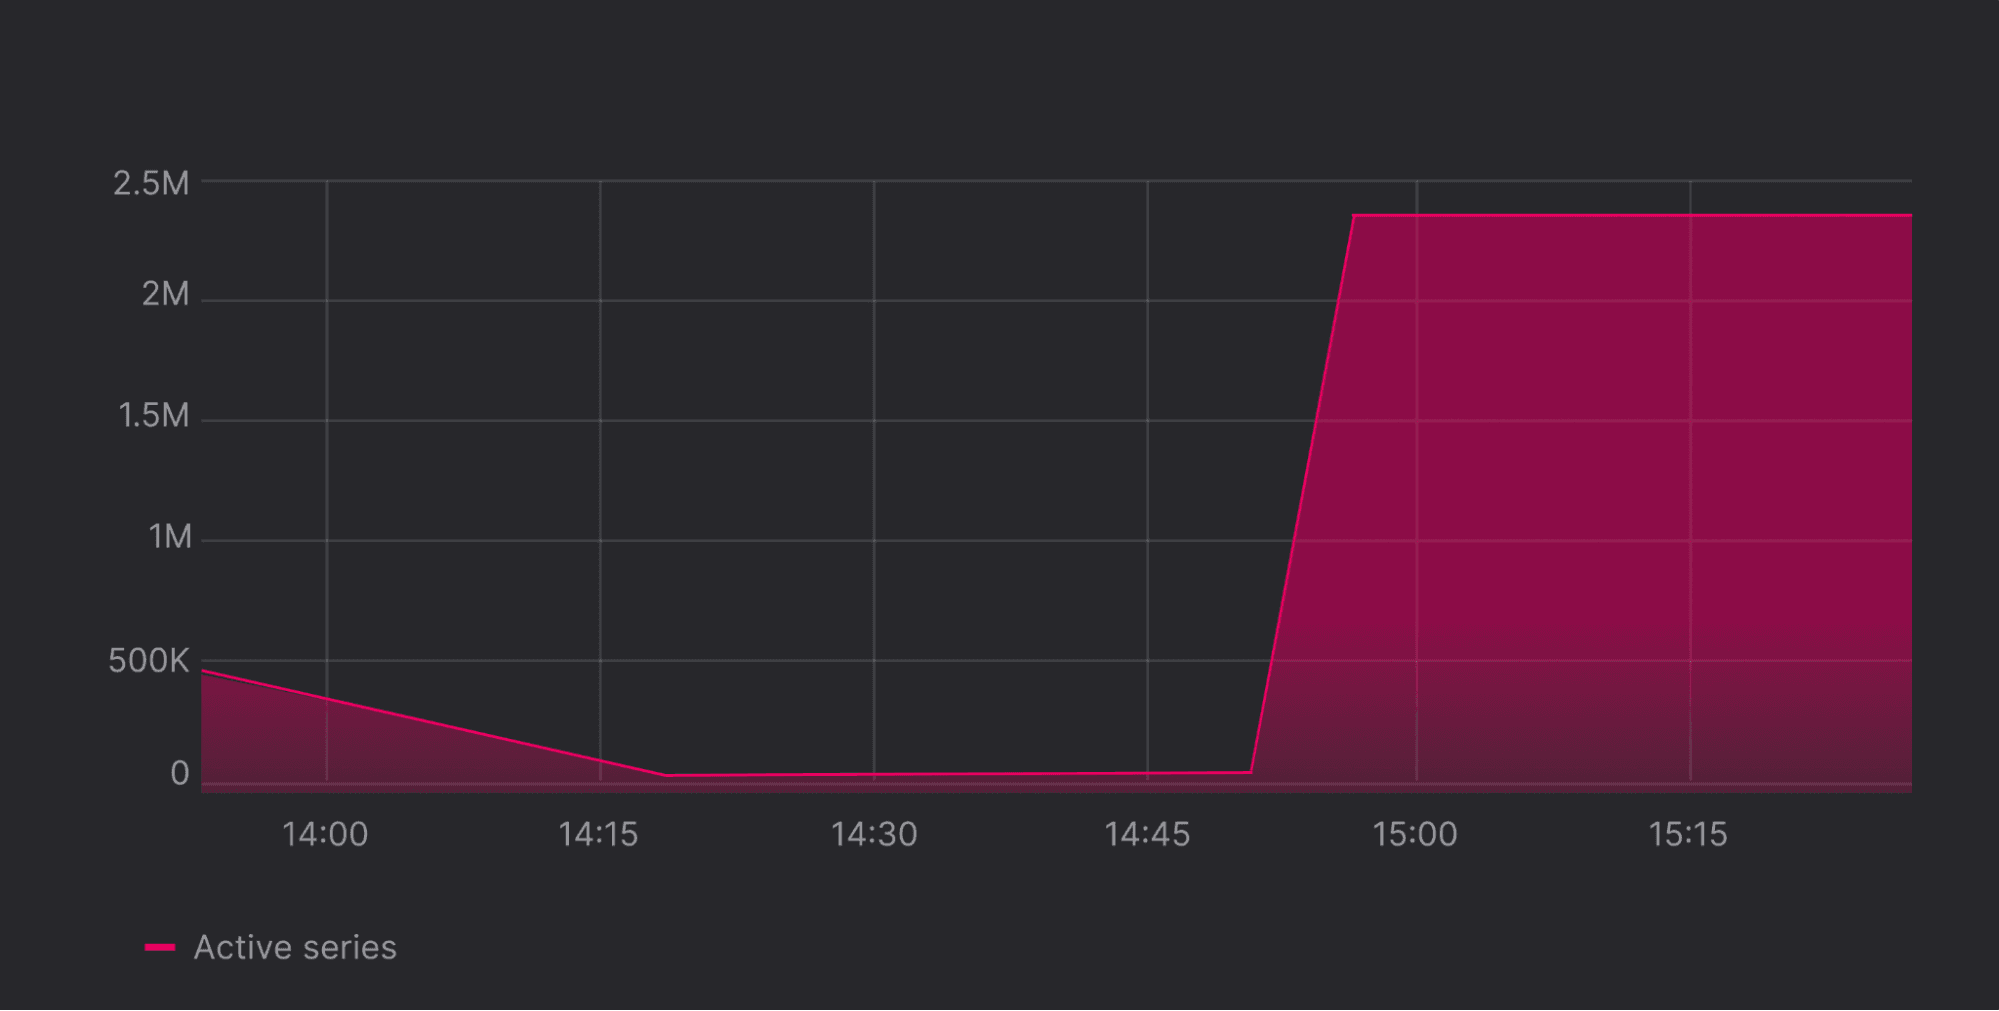
The image above shows what a sudden spike in cardinality looks like. See how the line slopes down a bit on the left of the graph? Someone may have changed some relabeling rules to drop an irrelevant label. But then you’ll notice that the active series drastically spikes. What happened here is that perhaps someone introduced a label that can have so many values that the number of series (a.k.a. your cardinality) is increasing rapidly. This means that the team is generating a lot more monitoring data than before — or perhaps, accidentally, too much.
So when does this happen? When you instrument your code and add a new metric, sometimes you attach more context than you need. For example, if you use the label “user_id”
- User id will become a label for that metric.
- Since Prometheus creates one series per label combination, you will end up with a lot of series for a single metric if you have a lot of users.
You probably want to know: How many series is too many series to send? It’s all about being sensible about the overall number of series, and the cardinality management tool we’ve built helps you to make those decisions.
The costs of cardinality spikes
When high cardinality metrics are sent to your observability systems, you begin to use too many resources, which can then lead to memory errors and system crashes. This can make for a painful experience for those teams tasked with keeping their companies or applications up and running.
Sudden cardinality spikes don’t only have a negative impact on your observability systems, but it can also cause an increase in your expenses.
In Grafana Cloud, Grafana Cloud Metrics is billed on the number of Active Series (and DPM). An active series is considered active when data points have been added within the last 15 to 30 minutes. If you experience a sudden spike in cardinality that exponentially increases the number of metrics you’re sending, your bill will also increase. So keeping cardinality under control can have some real cost benefits as well.
Learn more
While we hope this gives you a general overview of how important cardinality is, we have additional resources to help you better understand and manage cardinality in your stack.
For Grafana Enterprise Metrics documentation on cardinality analysis configuration and dashboards: Grafana Enterprise Metrics: Cardinality overview
For how to use cardinality management dashboards with Grafana Cloud: Analyzing metrics usage with cardinality management dashboards
For how to combine logs and metrics to solve issues related to cardinality: How to alert on high cardinality data with Grafana Loki
For how to use cortex-tools to find unused high cardinality metrics: How to quickly find unused metrics and get more value from Grafana Cloud

