
Announcing Grafana Incident, smart incident management for your teams
Update: Grafana Incident is now generally available at no additional cost to all users in Grafana Cloud. To learn more about the new and enhanced features in our incident management tool, visit our Grafana Incident webpage, read through our Incident documentation, and check out our latest blog post.
A huge challenge when dealing with incidents is the coordination and communication needed to put things right. What’s happened so far? Who has tried what query? Did we remember to keep stakeholders informed? What is the severity of the incident? Does this affect customers?
Figuring this out requires a lot of back and forth as new team members join the incident. Even after the incident is resolved, there is added toil around capturing the key timeline of events, action items, and building your postmortems.
That’s why we’re excited to announce Grafana Incident, a new tool from Grafana Labs that is now available in preview in Grafana Cloud, our fully managed observability offering.
With Grafana Incident, you can:
- Automatically create the online meeting spaces for collaboration
- Assign important roles so you know who’s doing what
- Manage TODO items so nothing falls through the cracks
- Passively build up a timeline of events, perfect for postmortems and process improvement sessions
- Embed Grafana graphs and other useful resources to paint a wider picture around the incident
- And more, with exciting features to come
Grafana Labs’ own incident management process has iterated and evolved over the years. I asked Dee Kitchen, Senior Director of Engineering at Grafana Labs, how the process came to be.
“We implemented our incident management process from the best practices our engineers had learned from their experiences at Google, Cloudflare, SoundCloud, and various other organizations around the industry,” Dee said. “The process we’ve built will be familiar to on-call engineers, and if it’s new to you, it is intuitive and easy to follow. With Grafana Incident, we’re able to onboard engineers in a shorter time, confidently declare incidents sooner, react more quickly, and document what happened more easily.”
Grafana Incident features
Let’s dig deeper into the features of the tool.
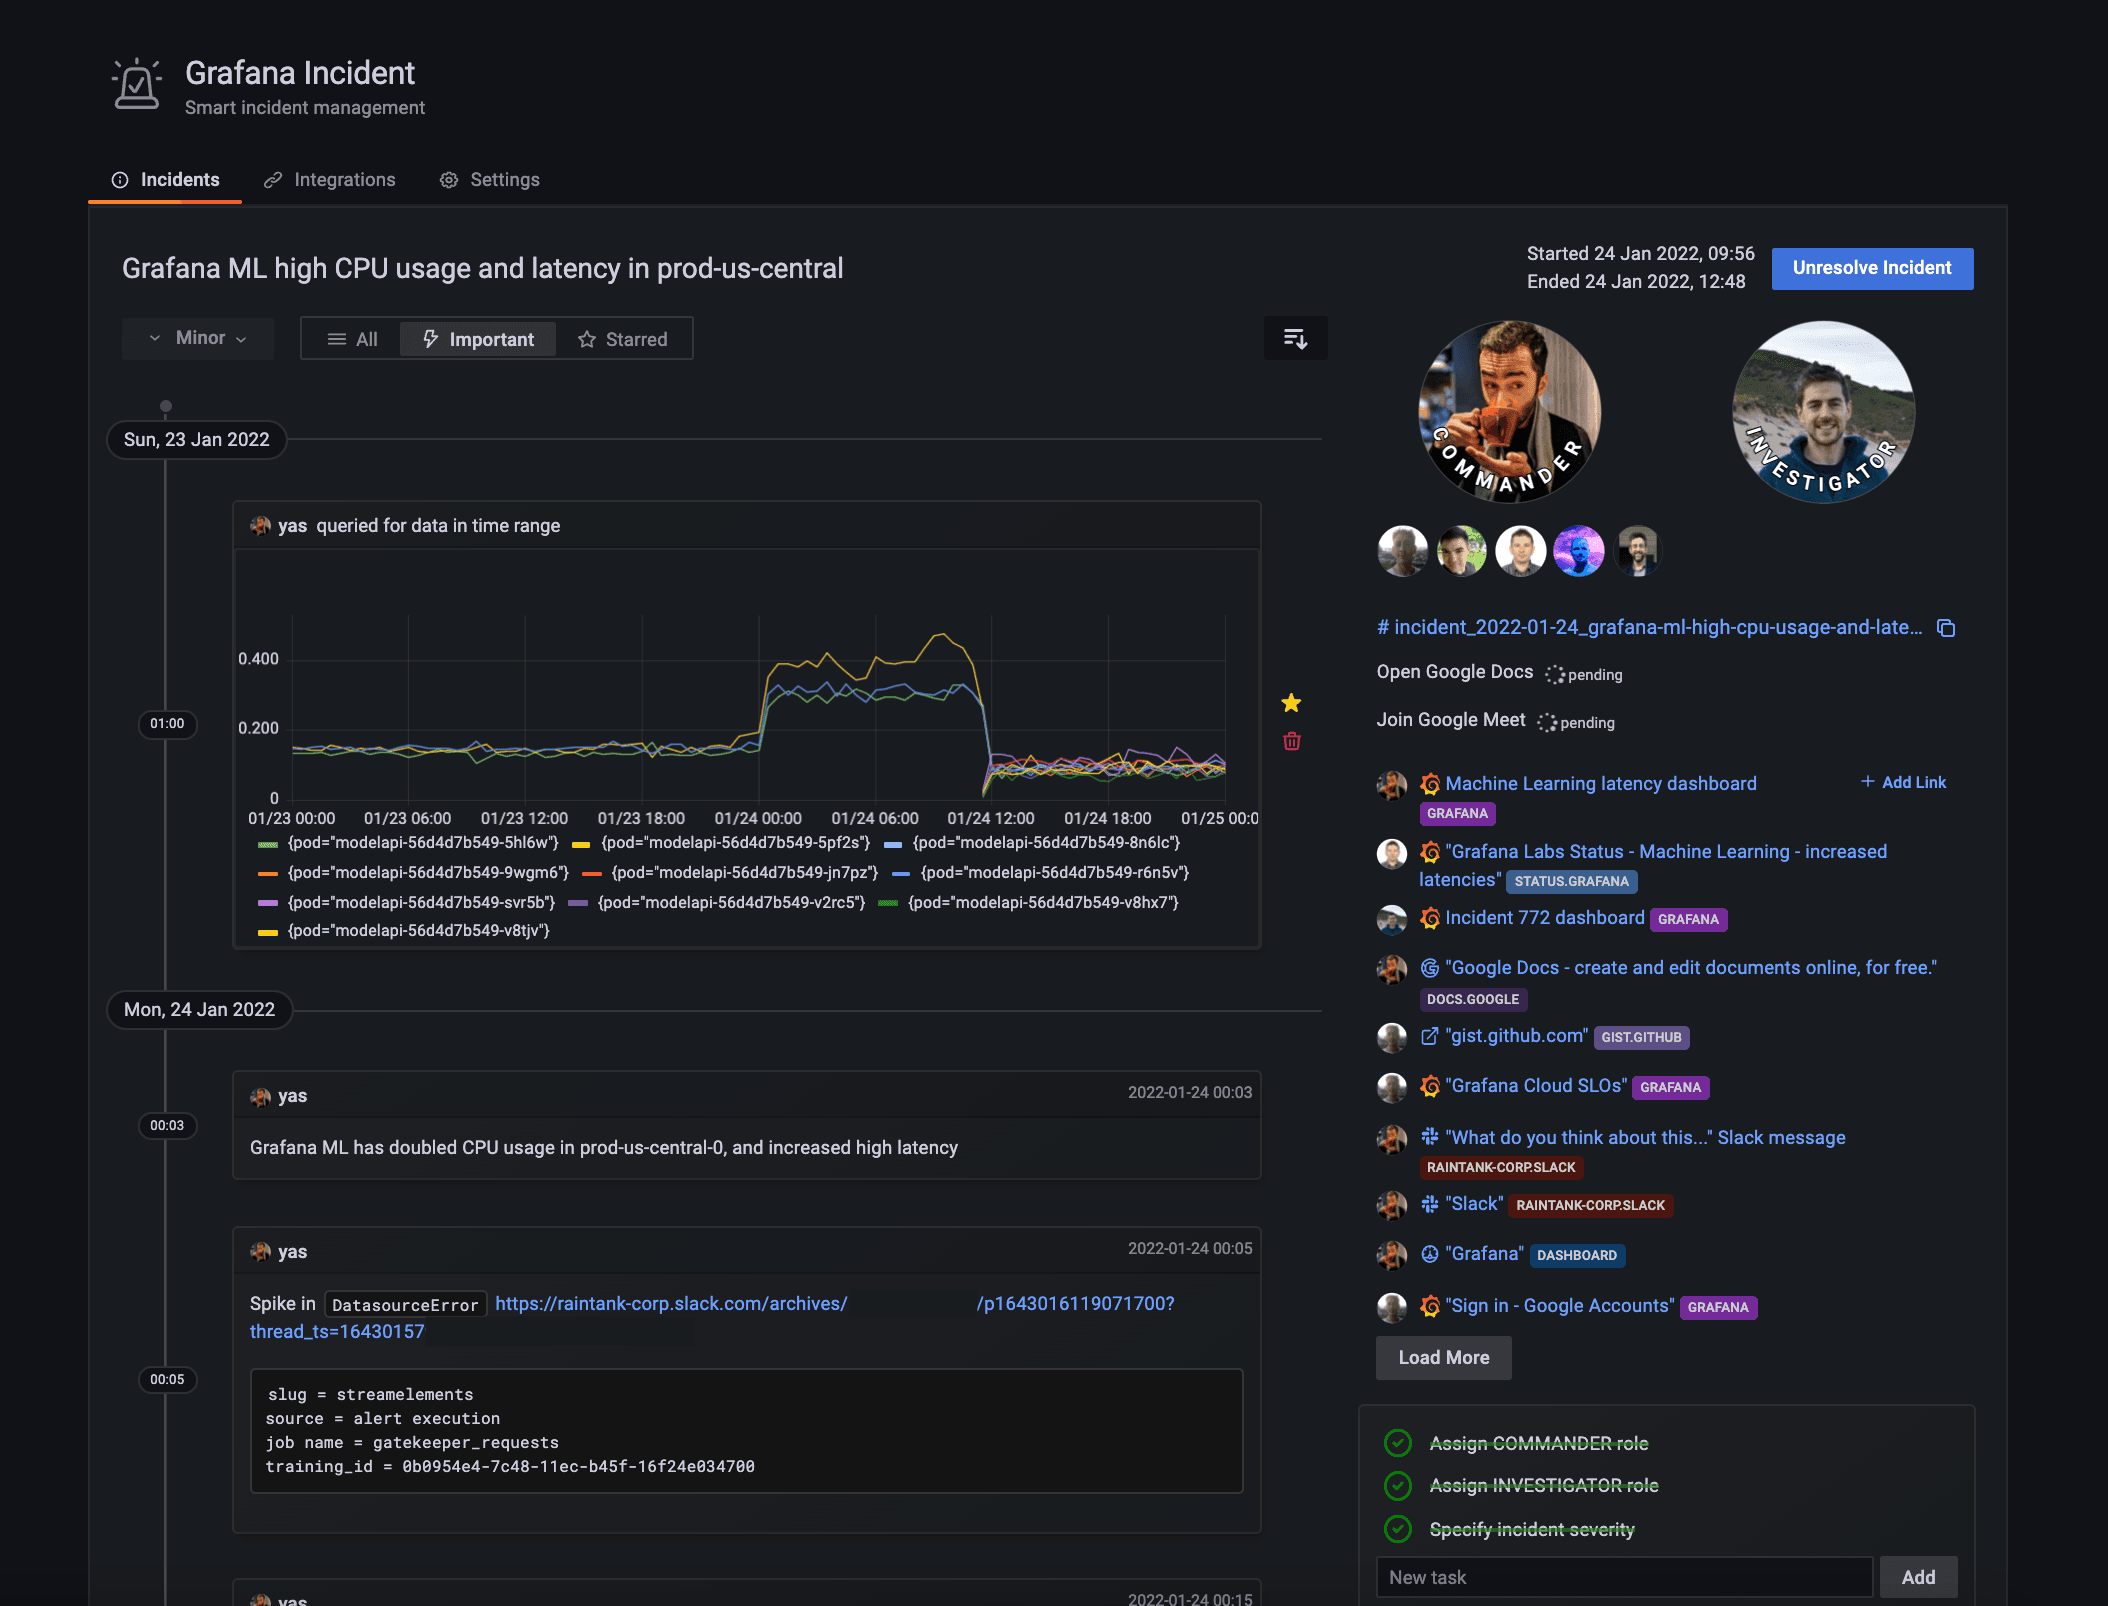
Above: A screenshot of a real incident from Grafana’s AI/ML team (in dark mode).
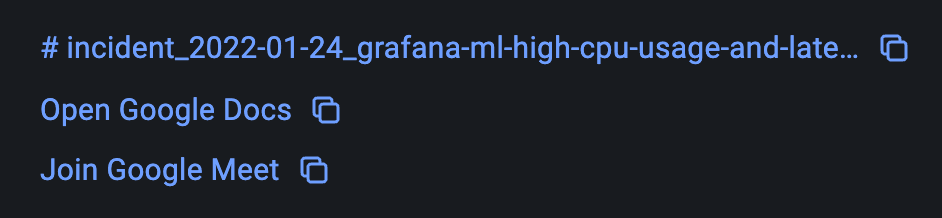
You can start collaborating immediately with all the essential spaces and resources automatically set up.
You can assign important roles, so everybody knows who is doing what. And a quick tap or click lets you direct message them to quickly provide potentially invaluable input.

A chatbot offers a command-line interface for managing incidents. The chatbot also looks out for interesting context shared in the chat.

Web links are understood (and automatically discovered in the chat), allowing you to attach vital metadata to the incident. Whether that’s GitHub issues and pull requests, Grafana dashboards, or external links, you can passively build up a picture of what’s going on.
Grafana Incident will even suggest related dashboards by context which it collects passively.

Finally you can keep track of important tasks and TODO items so nothing falls through the cracks.

The tool automatically maintains a timeline of events as the incident unfolds.
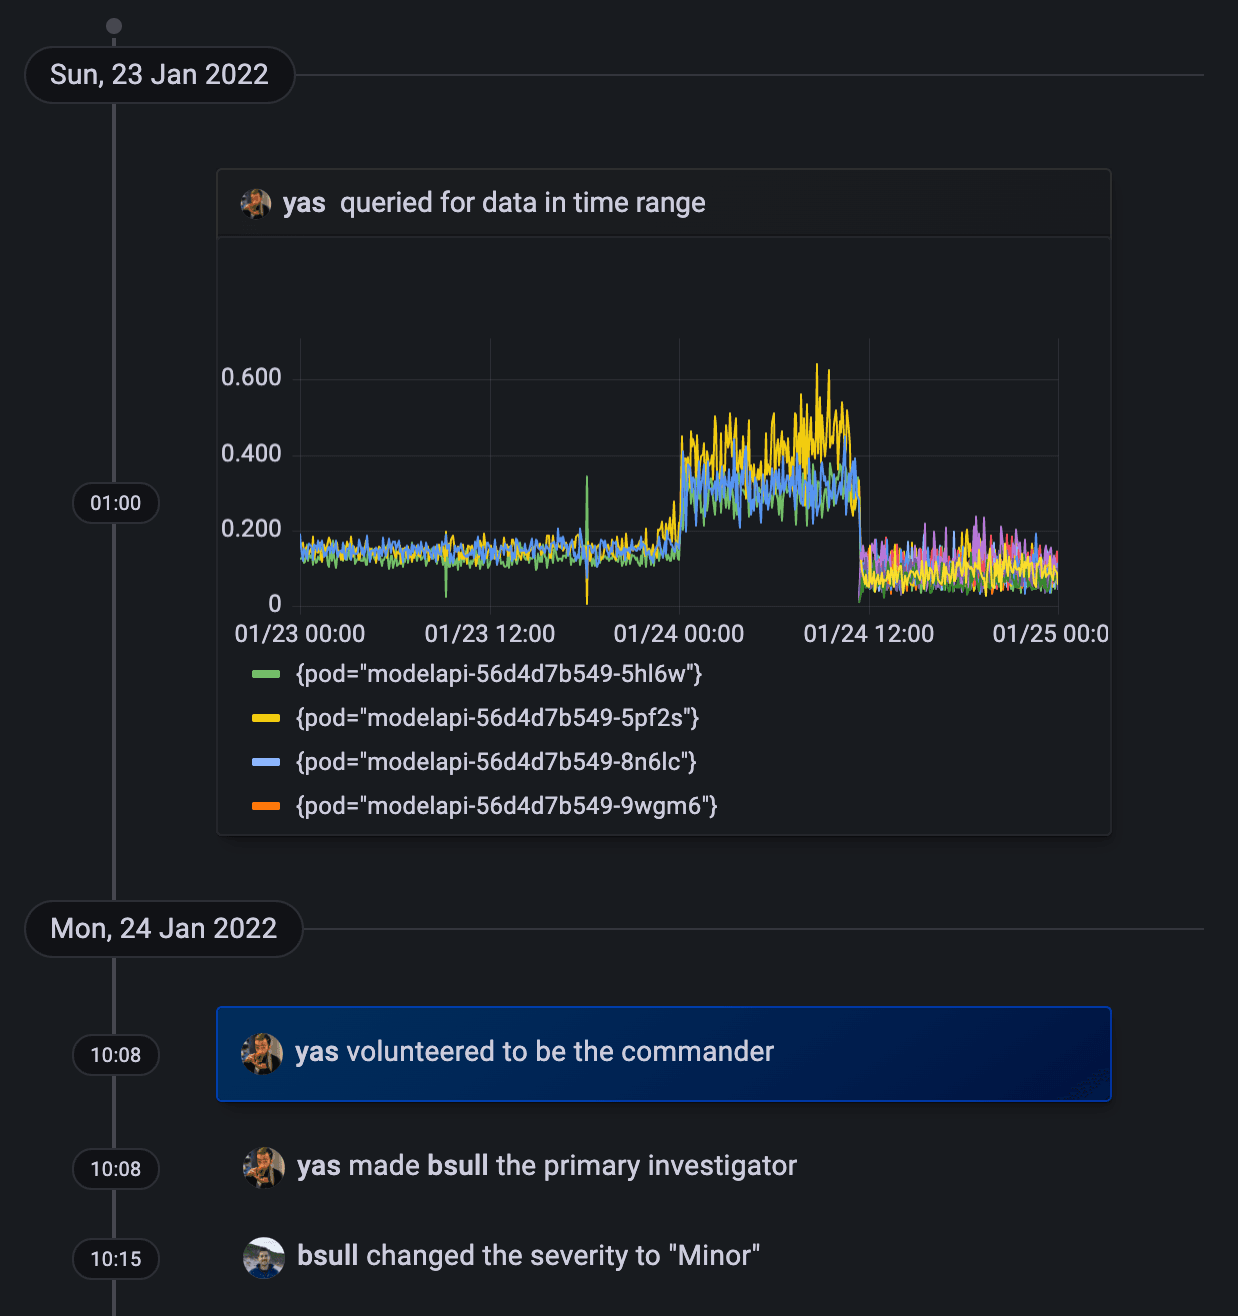
Embedded queries and graphs bring the incident to life, and allow you to discuss the problem in a familiar way.
About that chatbot
During Grafana Labs’ first Hackathon last year, Senior Software Engineer Russ DuBrock built the prototype for a chatbot that helps you manage incidents. We took Russ’s bot (which he called Cheesebot because, he says, “I like cheese”), along with knowledge from the Grafana OnCall team, and we built it into Grafana Incident.
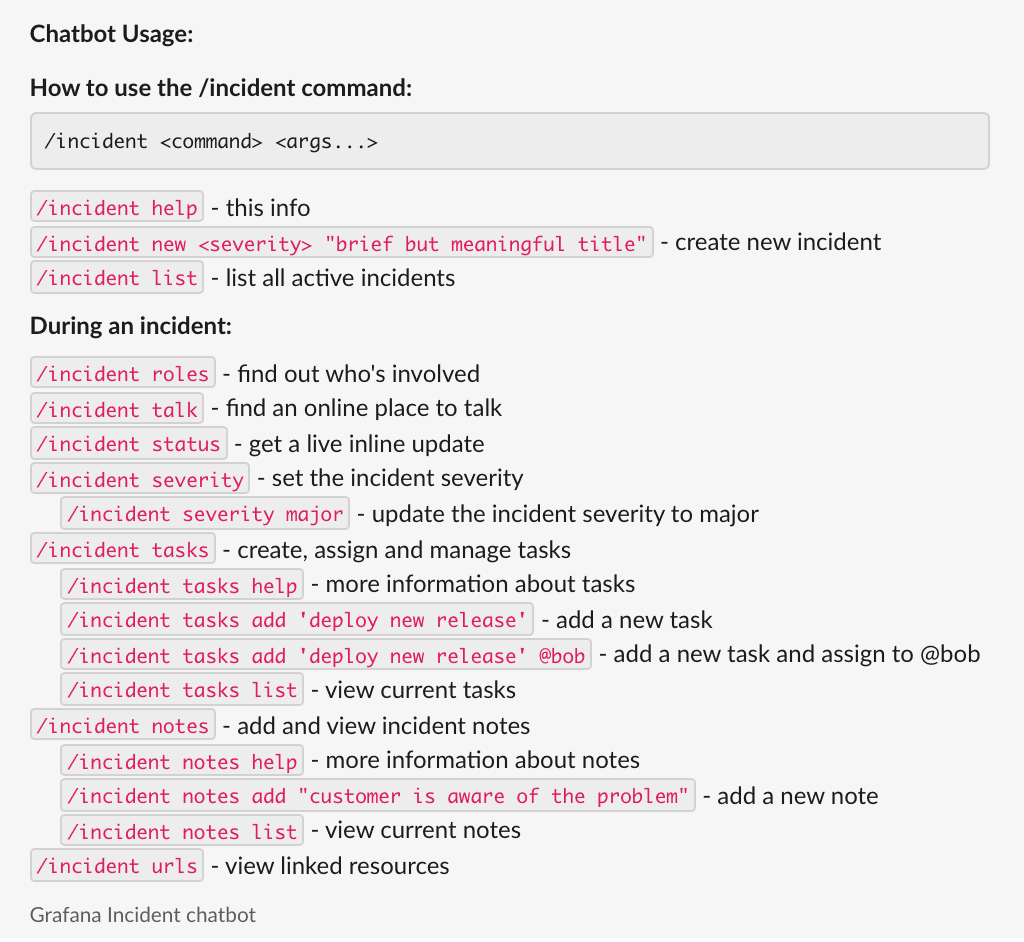
With the chatbot, engineers can interact with Grafana Incident without even opening a web browser. A familiar command-line interface lets you create incidents, assign roles, manage tasks, add notes, and more.
Additionally, the bot passively watches the conversation for clues that might be important later. URLs are processed and attached to the incident. For example, GitHub issues and pull requests that are added allow you to tie code changes to incidents. This enriches the metadata surrounding incidents and supports more in-depth discussions around the riskier areas of your system.
What’s next for Grafana Incident?
The team is working hard to get Grafana Incident ready for general availability. And we’re very excited about the future of the tool.
We have three other main areas of focus:
- Grafana Cloud integration: You can already embed graphs in your incident timeline, and we are keen to integrate even deeper into other Grafana apps and services.
- Third-party integrations: We plan to add to our library of integrations to enable you to automate more of the tools you already use today.
- Assistance and intelligence: We’re interested in ways the tool can help during an incident (for example, suggesting dashboards that might be related).
Try it out now
Grafana Incident is available in preview to Grafana Cloud users with both free and paid plans. We are ready to start onboarding teams that are interested in improving their incident management process.
- Is this the first time you’re hearing about incident management?
- Do you tend to react in an ad-hoc way when things go wrong and feel you could benefit from formal incident management policies?
- Have you been following an incident management process that you don’t feel is working out?
If you answered yes to any of these questions, please consider signing up. You can request access to the preview of Grafana Incident here.
If you’re not already using Grafana Cloud — the easiest way to get started with observability — sign up now for a free 14-day trial of Grafana Cloud Pro, with unlimited metrics, logs, traces, and users, long-term retention, and premium team collaboration features.

