
An advanced guide to network monitoring with Grafana and Prometheus
In your career, if your role has ever included the monitoring or managing of any network infrastructure devices such as switches, routers, firewalls, etc., you’ve very likely heard of SNMP.
In case you haven’t, SNMP stands for Simple Network Management Protocol, and, unlike its name suggests, it is anything but simple. It is a standard protocol for collecting information from network devices and organizing it in a way that humans can (sort of) understand. The protocol is responsible for read and write operations against network devices. SNMP relies on MIBs (Management Information Base), which are, in their simplest form, objects that describe the types of information that can be read from the device or written to the device.
Here at Grafana Labs, we are often asked how one can monitor network devices and visualize their data in Grafana dashboards. Enter the snmp_exporter. The snmp_exporter exposes information collected by SNMP to be used by the Prometheus monitoring system.
Configuring the snmp_exporter
At first pass, the snmp_exporter can appear a bit daunting. We will attempt to demystify it here. (If you are looking for a beginner’s guide, please see our previous post about getting started with SNMP and Grafana.)
There are three main components you need to run the snmp_exporter:
- First, since we want to monitor these devices via Prometheus, a Prometheus server or the Grafana Agent is required. (This is not part of the snmp_exporter, but rather a prerequisite.)
- Second, if you’re not using ready-made configurations shipped with the snmpexporter, the generator, which uses NetSNMP to parse the MIBS and generate the _snmp.yml configuration file to be used by the snmp_exporter, is a necessary component.
- Finally, the snmp_exporter, which performs an SNMP walk and posts the results for Prometheus to scrape (targets) is also needed.
Here are the high-level steps to set up the snmp_exporter:
- Retrieve the MIBs specific to your devices; this is necessary for the generator. It is important to be surgical with this process. The amount of SNMP data available can be incredibly overwhelming.
- The recommended way to do this is to run an snmpwalk against a device and choose which Object Identifiers (OIDs) actually provide value to you based on your use case. Once you’ve found the right ones, you will want to translate those OIDs to MIBs.
- Talking to folks who already extract data from these devices is also important so that you know what is important to them and ensure you include those data when setting up this configuration.
- Run the generator on a generator.yml file, selecting what you need for your use case. This will generate a configuration file called snmp.yml. The file will also include:
- SNMP version / authentication
- OID subtrees to bulkget
- Matching of OID subtrees to Prometheus label sets
- Run the snmp_exporter. The exporter is an SNMP <> HTTP proxy that collects data via SNMP and posts the results for Prometheus to scrape.
- Now you are ready to add your targets to Prometheus.
Configuring the snmp generator
We must emphasize the need for the generator — without it you will not be able to specify your authentication, which objects are walked, or map those objects to label sets. The snmp.yml file should not be edited manually, that’s what the generator is for!
- Before you begin, SNMP must be enabled on the devices you wish to monitor. Please consult the vendor documentation on how to enable SNMP on specific devices.
- Note that for the snmp generator, you will want to store your vendor MIBs in the correct path: ./snmp_exporter/generator/mibs
- Run an snmpwalk against your target device. For example:
- snmpwalk -v2c -c public 192.168.2.1 1.3.6.1
- The first flag is specifying the SNMP version; v2c in this case. The second flag is the community string (we do not recommend leaving this as public, which is a common default) and the IP address of the endpoint. Lastly is the root OID. If supported on your devices and enhanced security is desired, SNMP v3 is highly recommended.
When running the snmpwalk command above, we see more than 5,000 OIDs! Yikes, that’s a little overwhelming!

Remember how we said to be surgical? Well, this is where that applies. In this example, we are going to be using the if_mib and vendor specific mibs.
The generator defaults to SNMP v2, and public as the community string; we have included these for the example below. See here for more authentication examples.
Below is an example of a working generator.yml file. (The out-of-the-box generator default configuration file has this plus many other examples to help you get started.)
modules:
  # Default IF-MIB interfaces table with ifIndex.
  if_mib_if_name:
    walk: [sysUpTime, interfaces, ifXTable]
    lookups:
      - source_indexes: [ifIndex]
        lookup: ifAlias
      - source_indexes: [ifIndex]
        # Uis OID to avoid conflict with PaloAlto PAN-COMMON-MIB.
        lookup: 1.3.6.1.2.1.2.2.1.2 # ifDescr
      - source_indexes: [ifIndex]
        # Use OID to avoid conflict with Netscaler NS-ROOT-MIB.
        lookup: 1.3.6.1.2.1.31.1.1.1.1 # ifName
    overrides:
      ifAlias:
        ignore: true # Lookup metric
      ifDescr:
        ignore: true # Lookup metric
      ifName:
        ignore: true # Lookup metric
      ifType:
        type: EnumAsInfo
    auth:
      community: public

  ubiquiti_unifi:
    walk:
      - sysUpTime
      - interfaces
      - ifXTable
      - 1.3.6.1.4.1.41112.1.6 # ubntUniFi
    overrides:
      ifType:
        type: EnumAsInfo
    auth:
      community: public
Now that we have a configuration, you will need to build the generator or you can run the generator in Docker. For example:
docker build -t snmp-generator .
Create your generator.yml in ./snmp_exporter/generator.yml or use the example provided.
The config generator uses NetSNMP to parse MIBs and generates configs for the snmpexporter using them, so we have to make sure the MIBs are in the right path. (ex: **./snmpexporter/generator/mibs**)
Run:
docker run -ti -v "${PWD}:/opt/" snmp-generator generate
Example output:
level=info ts=2021-01-22T21:18:55.619Z caller=net_snmp.go:142 msg="Loading MIBs" from=mibs
level=info ts=2021-01-22T21:18:55.988Z caller=main.go:52 msg="Generating config for module" module=if_mib
level=info ts=2021-01-22T21:18:56.015Z caller=main.go:67 msg="Generated metrics" module=if_mib metrics=40
level=info ts=2021-01-22T21:18:56.015Z caller=main.go:52 msg="Generating config for module" module=ubiquiti_unifi
level=info ts=2021-01-22T21:18:56.042Z caller=main.go:67 msg="Generated metrics" module=ubiquiti_unifi metrics=97
level=info ts=2021-01-22T21:18:56.059Z caller=main.go:92 msg="Config written" file=/opt/snmp.yml
In your ./snmp_exporter/ folder you should now have an snmp.yml file; this is the file generated by the snmp-generator.
Congratulations, you are almost done!
Running the snmp_exporter
Now let’s move on to the snmp_exporter itself. If you haven’t already done so, download the latest release and untar it.
SNMP_exporter ships with a default snmp.yml file in that root directory. You will need to rename it or remove it, as we want to copy over our newly generated snmp.yml from the generator directory. Once your newly generated snmp file is in the snmp_exporter directory, we can go ahead and start the service.
./snmp_exporter
You can confirm the exporter is working by visiting the host URL. For example: http://192.168.2.213:9116/

Once you confirm the snmpexporter is working, be sure to add your SNMP target and appropriate MIBs (module) to your _prometheus.yml file so that it scrapes your metrics!
 - job_name: 'network'
    static_configs:
    - targets: ['192.168.2.1']
      labels:
        job: 'gateway'
    - targets: ['192.168.2.90']
      labels:
        job: 'downstairsap'
    - targets: ['192.168.2.89']
      labels:
        job: 'upstairsap'
    - targets: ['192.168.2.12']
      labels:
        job: 'switch'
    metrics_path: /snmp
    params:
      module: [if_mib_ifname]
    relabel_configs:
      - source_labels: [__address__]
        target_label: __param_target
      - source_labels: [__param_target]
        target_label: instance
      - target_label: __address__
        replacement: 192.168.2.213:9116  # The SNMP exporter's real hostname:port.
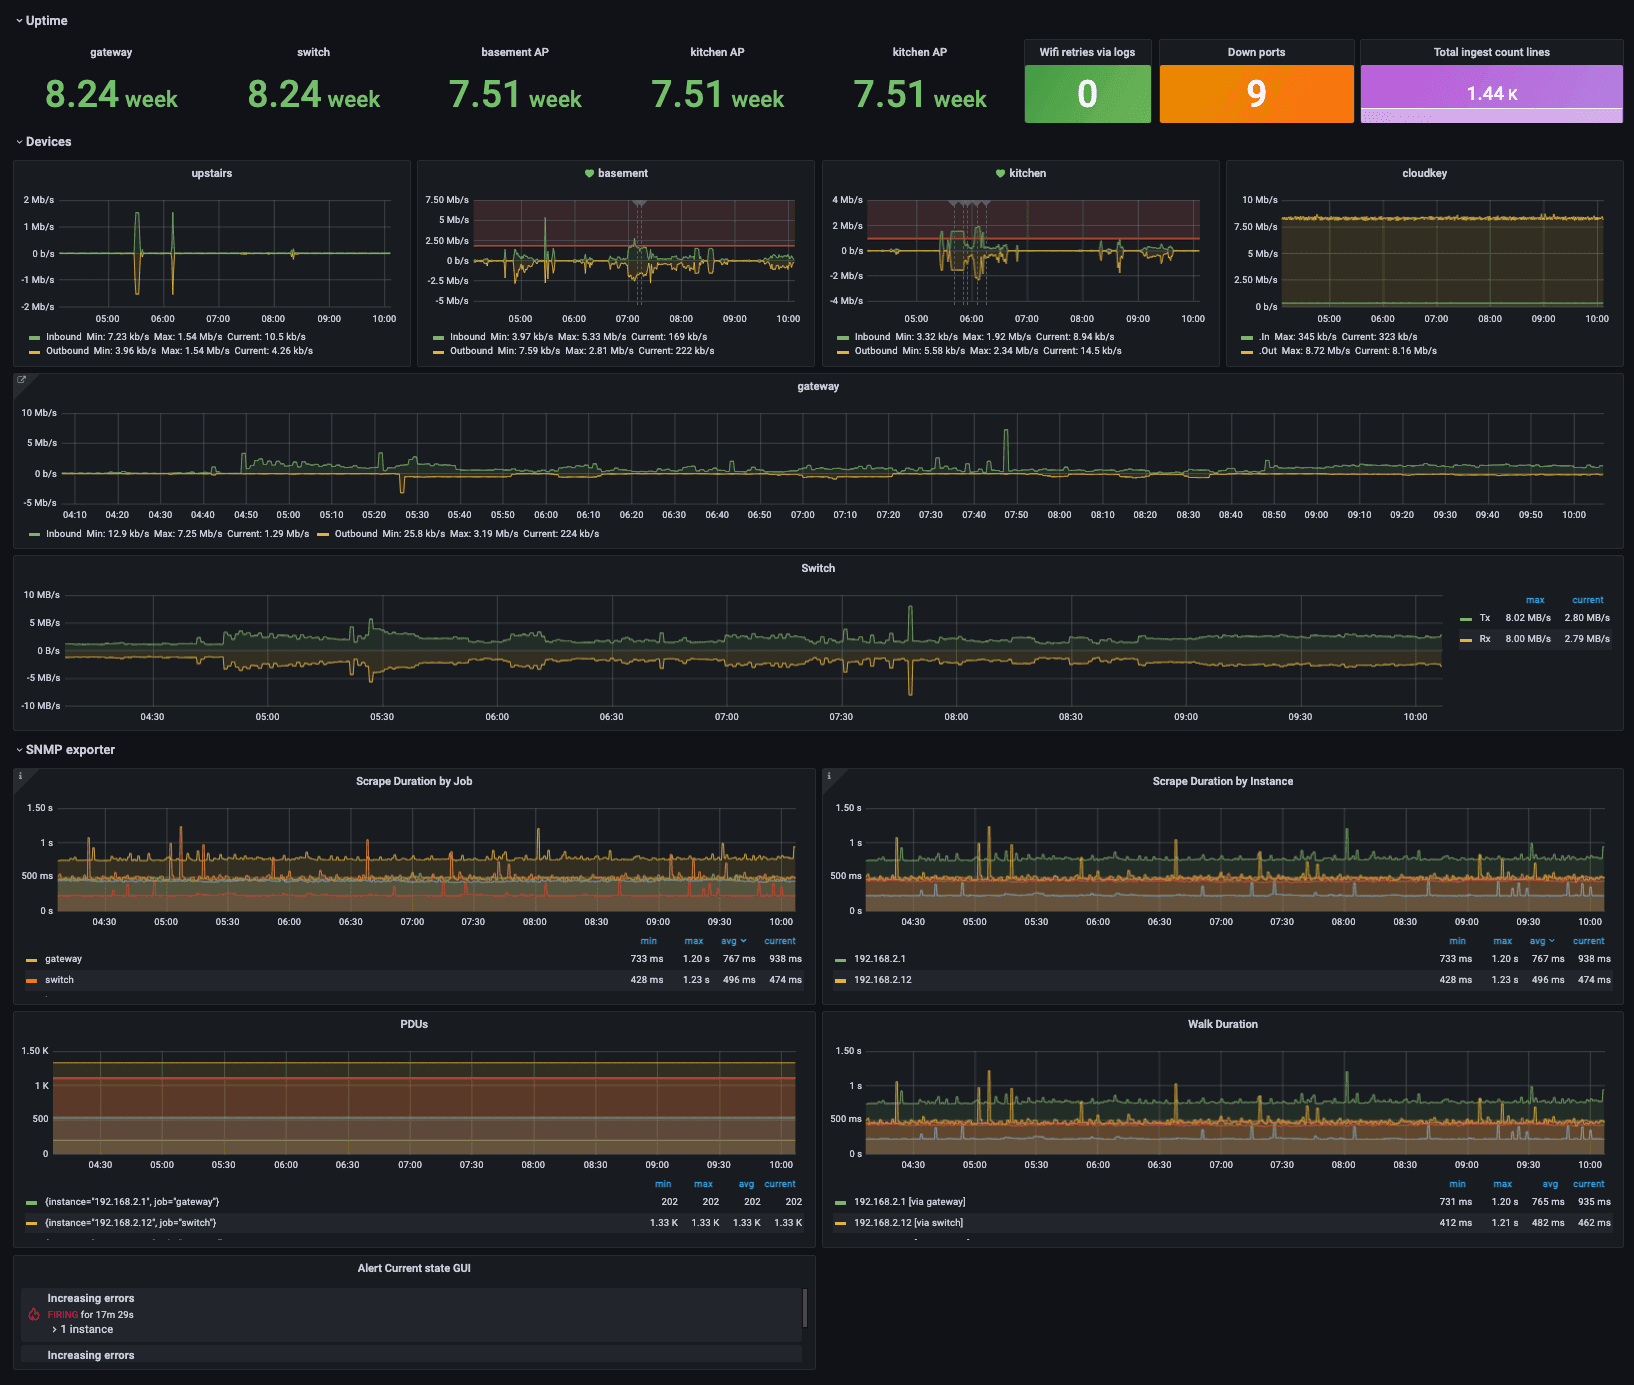
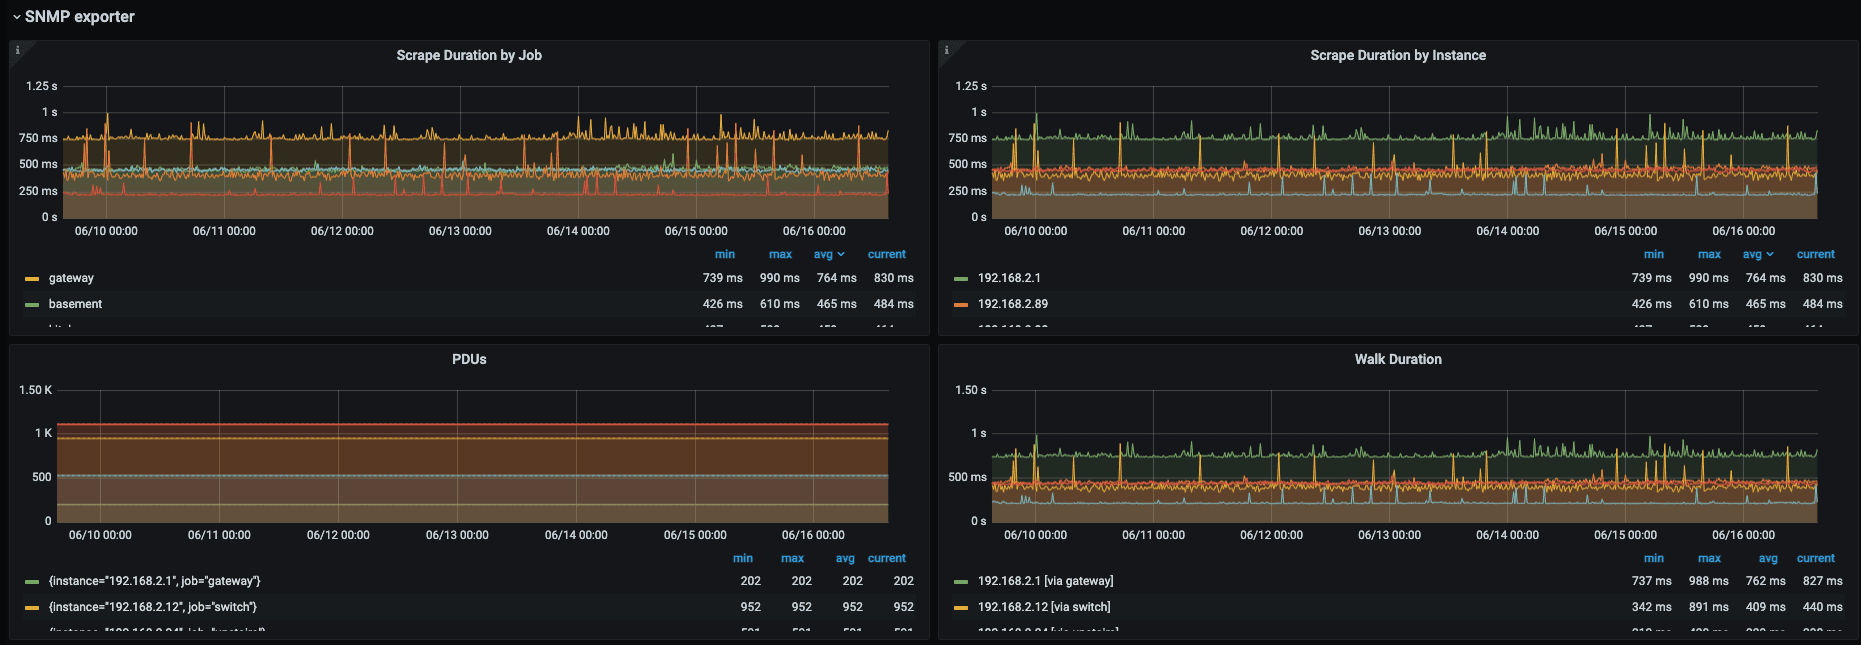
Finally, here is a Grafana dashboard example that was created with data collected from the snmp_exporter on some home devices:
Conclusion
We hope this was a very manageable guide to monitoring your network devices in Grafana and that we have demystified the snmp_exporter and generator so that you can now get started with monitoring your own network devices! You can also check out our beginner’s guide to network monitoring using our SNMP mixin and Grafana.
I want to give a huge shout out to my two amazing colleagues Eldin Nikocevic and Richard “RichiH” Hartmann for their input on this post! If you are interested in joining our team of solutions engineers or customer success engineers to help our users along their observability journey, please check out our careers page.
The easiest way to get started with Prometheus and Grafana is with Grafana Cloud. Our free forever tier now includes 10K metrics series, 50GB of logs, and 50GB of traces. Sign up for free today!

