A beginner's guide to network monitoring with Grafana and Prometheus
Networks are the backbone of inter-communications within computer systems and applications. When networks go down or experience any interruption of service, the impact is widely felt and can result in significant service disruptions and lost revenue.
This is why network monitoring is mission critical for organizations. Visibility into network performance is key to ensuring that network engineering teams can be more proactive and identify problems before those issues cause outages.
Disruptions, however, are becoming increasingly common. Today’s networks are incredibly large and so massively complex that avoiding outages altogether is nearly impossible. Internet scale is roughly 20 years ahead of Cloud scale. Just between 2000 to 2021, we saw a growth rate of nearly 1,332% in Internet usage. So even a relatively small network can equal your cloud scale.
That’s why having a solid network monitoring solution is essential to ensuring that network engineers can quickly diagnose, identify, and resolve issues when outages do occur. You need the best-in-class observability tools, and that’s where Grafana can help.
Getting started with SNMP
Leveraging monitoring solutions to capture metrics and configure alerting policies when thresholds are crossed for important indicators such as CPU load, memory utilization, port exhaustion, bandwidth utilization, power supply health, temperature sensors, etc. is key to establishing a sound network monitoring plan.
One of the most common methods used to monitor networks is through the use of the Simple Network Management Protocol or SNMP. SNMP was first introduced in 1988 and is much more complex than its name would have you believe. It is outside of the scope of this post to delve deep into the inner workings of SNMP, but at its core, it is a protocol used by network management tools to query a myriad of data variables that are assembled in a Management Information Base (MIB) on IP-based devices.
Here at Grafana Labs, we want to help facilitate the monitoring of those important network devices and provide a few simple ways to get started. Our SNMP mixin is a great baseline for monitoring network devices. A mixin is a configurable, reusable, and extensible package which bundles together Grafana dashboards and Prometheus rules and alerts.
If you are using Prometheus, you can leverage the snmp_exporter , which the SNMP mixin mentioned above is a part of. This is another method that can be used for effectively monitoring network devices and visualizing the collected data in Grafana dashboards. This provides more flexibility and allows you to import MIBs so that you can monitor any metric on any network device as you wish.
Visualizing network performance with Grafana
To leave you with the art of the possible, below are Grafana dashboards that show SNMP Prometheus network metrics and Syslogs that are being sent to Grafana Loki and unified in a single view as well as a side-by-side correlated view of SNMP metrics and Syslog data:
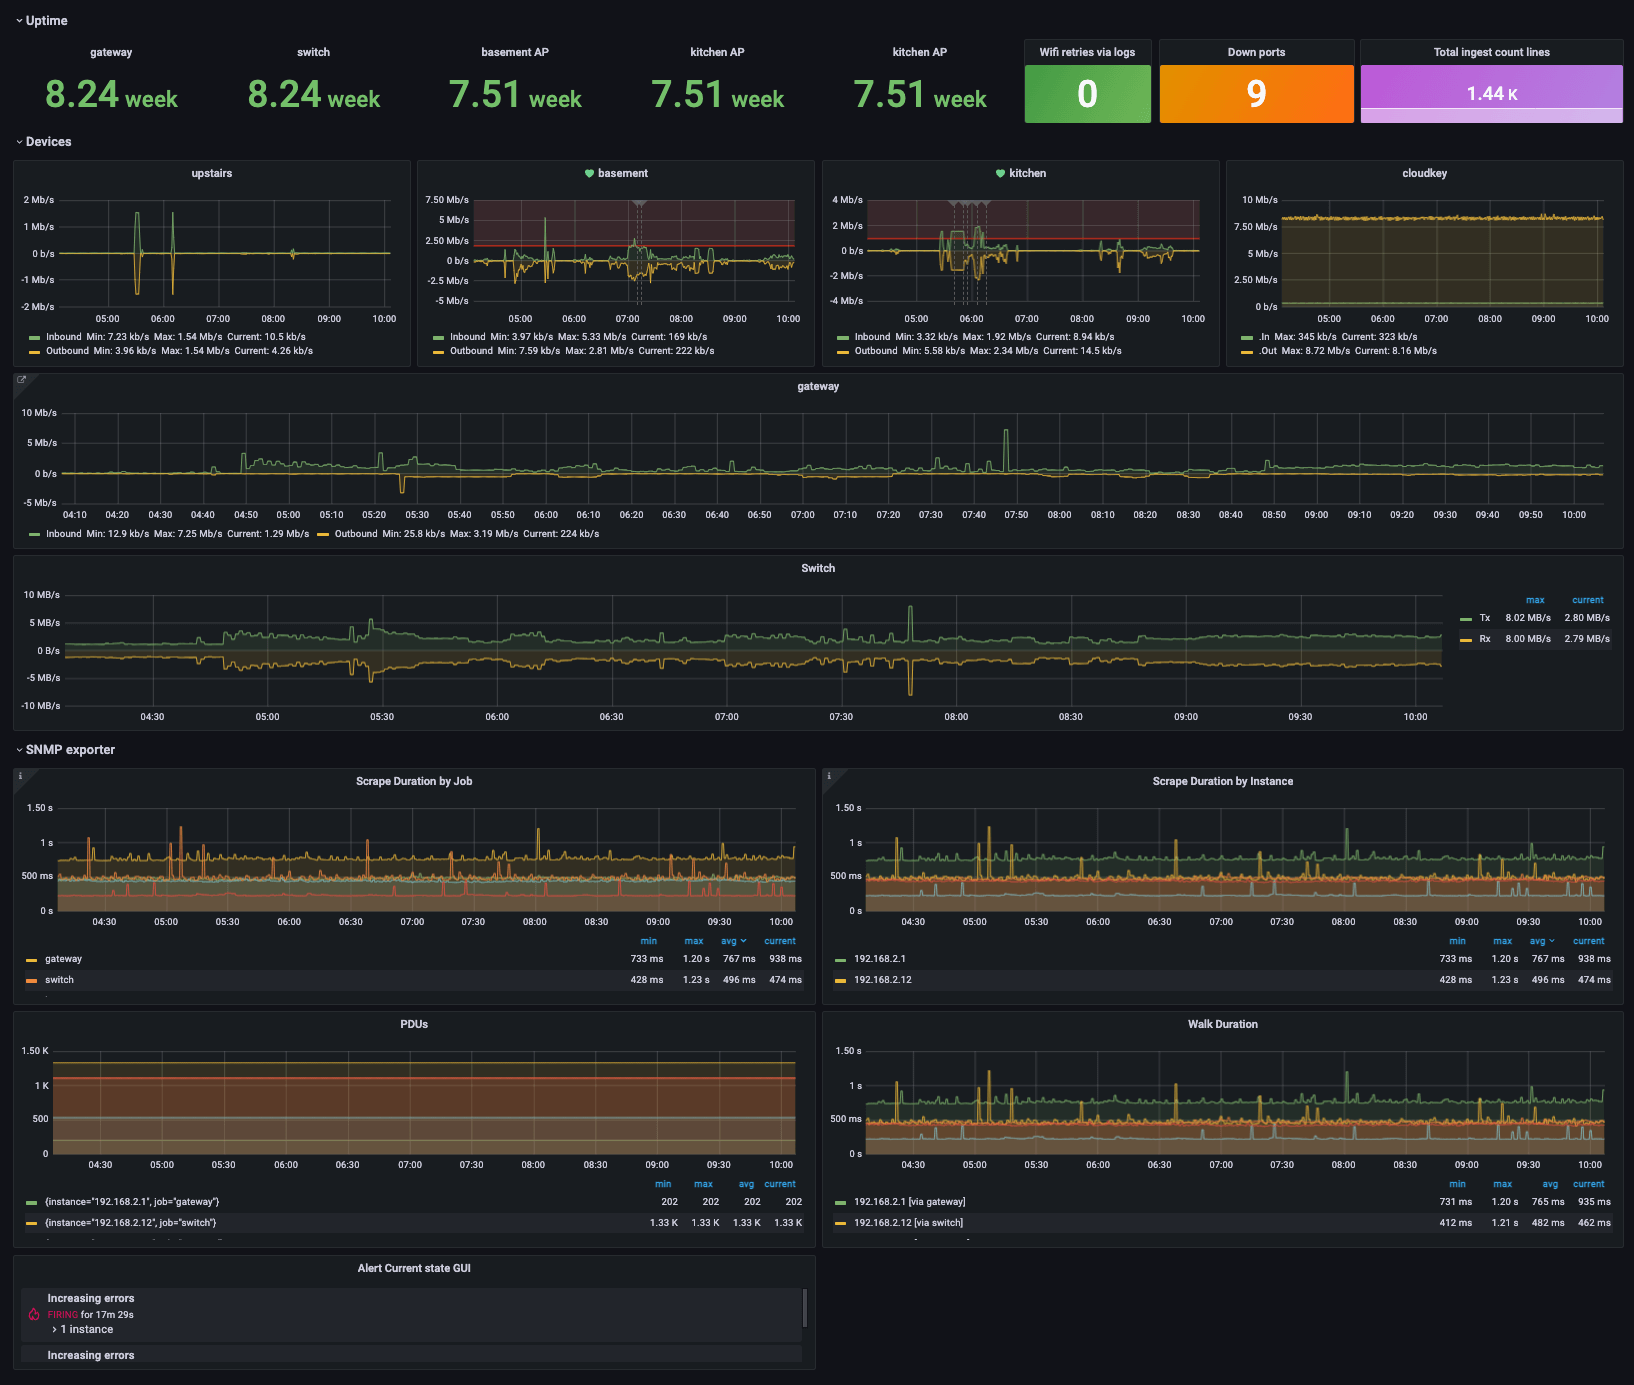
Above: Unifi home networking dashboard.

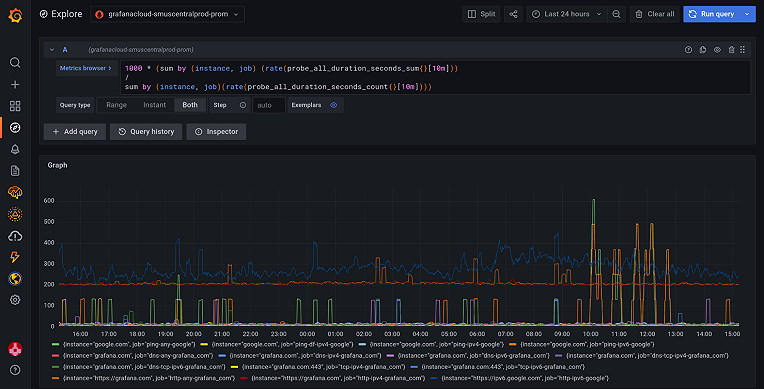
Above: Traffic and packets dashboard.

Above: Bits per interface dashboard.
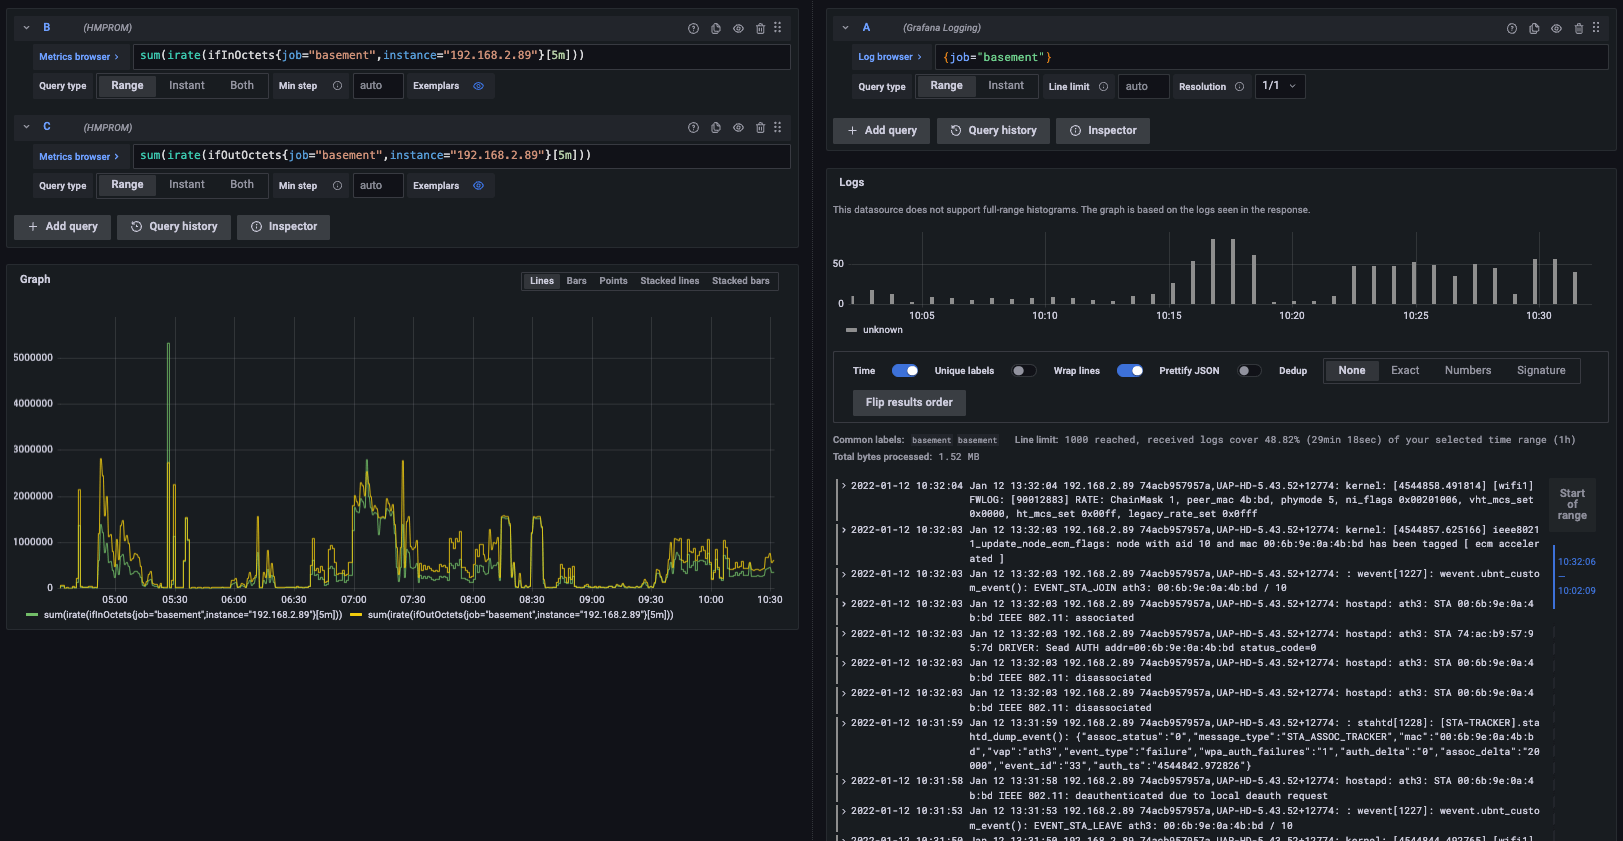
Above: Side-by-side metrics to logs correlation.
Conclusion
We hope this introduction helps you get started on monitoring your own home or business network. Go ahead and test it, out and let us know what you think!
Our next post in this SNMP series will cover the snmp_exporter in greater detail, showing how to leverage it for your network monitoring needs. We’ll also walk you through the installation and process of ensuring you get the exact network metrics you want to visualize in your dashboards.
I want to give a huge shout out to my two amazing colleagues Eldin Nikocevic and Richard “RichiH” Hartmann for their input on this post! If you are interested in joining our team of solutions engineers or customer success engineers to help our users along their observability journey, please check out our careers page.
Grafana Cloud is the easiest way to get started with metrics, logs, traces, and dashboards. We have a generous free forever tier and plans for every use case. Sign up for free now!