Configuring Grafana Tempo and Linkerd for distributed tracing
Anders Østhus is a DevOps Engineer on the Digital Tools team at Proactima AS, a consulting firm based in Norway that offers services and expertise in risk management, cybersecurity, healthcare, environmental solutions, and more.
It can be difficult to orient yourself in the distributed tracing space, and getting all the parts of a tracing setup to play well with each other can be a bit tricky.
But the benefits of tracing are undeniable. Adding distributed tracing to your applications/services provides:
- Insight into how requests flow through the systems
- The ability to easily see latencies for different service calls (internal/external)
- An additional tool in your toolbox when somethings goes wrong
As a DevOps engineer, I have been using Cortex, Grafana, and Grafana Loki on various projects at Proactima AS, which has a robust customer portfolio that crosses into transportation, energy, oil and gas, finance, health, and the public sector. No matter the industry or the scope of work, I’ve always been happy with the features, performance, and configuration options of our existing stack. So when we decided to add tracing into the mix, the natural choice was Grafana Tempo, and so far it’s delivered everything I’ve wanted and more.
Tempo gives you a trace-neutral backend to store and query all the common trace formats. The flexibility of Tempo’s backend also makes the open source solution easy to fit into almost all environments. You can set up Tempo at any scale based on your needs, and the independent write paths and read paths can even be individually scaled depending on load.
In this post, I’ll show you how to connect all the pieces necessary to end up with a system that collects traces from a Grafana instance that sits behind a NGINX Ingress Controller and runs on a Linkerd service mesh.
Overview
The stack that this blog post will look at is the following:
- Grafana Tempo (v1.2)
- Linkerd (stable-2.11.1)
- NGINX Ingress Controller (v1.0.4)
- Grafana (v8.2.4)
- Grafana Loki (v2.4) - optional
I won’t go through how to install all the components, but I’ll show the specific config needed for each to make them work together.
This is a high-level overview of how the request paths and span shipping will occur:

Shipping spans to Grafana Tempo
Grafana Tempo is a high-scale, minimal dependency distributed tracing backend.
Grafana Tempo doesn’t need any specific config, except you need to make sure that Tempo is listening on the ports/protocols you are going to use to ship spans to it on. For this example, I’ll be using the following protocols:
- Jaeger Compact UDP (port 6831) - for traces from Grafana
- OpenCensus TCP (port 55678) - for traces from Linkerd Proxy
- Zipkin TCP (port 9411) - for traces from NGINX Ingress Controller
For a complete list of supported endpoints and their corresponding ports, visit the API documentation.
The Tempo receiver part of the config should look like:
...
distributor:
  receivers:
    jaeger:
      thrift_compact:
        endpoint: 0.0.0.0:6831
    opencensus:
      endpoint: 0.0.0.0:55678
    zipkin:
      endpoint: 0.0.0.0:9411
...
I’ll send the traces directly to the distributor in this example, but you could also send it through a Gateway (i.e. if you are running with multitenancy).
Linkerd
Linkerd is the piece that will dictate how a lot of this is going to work. The reason is that for now, Linkerd only supports the B3 Propagation standard. So for the Linkerd Proxy to take part in the traces, all other parts need to use the B3 standard. If you don’t care about spans from Linkerd, you are free to use another propagation standard.
To configure Linkerd for tracing, you have to deploy the linkerd-jaeger extension.
Create a config file with the following contents: (You can also add other options here. For all valid values, look here for a full list of options.)
collector:
  enabled: false # We don't need the collector, we can just ship it directly to Tempo
jaeger:
  enabled: false # We don't need the Jaeger UI, we'll just use Grafana
webhook:
  collectorSvcAddr: tempo-distributor.tempo.svc.cluster.local:55678 # Replace with the FQDN:Port of your Tempo Distributor service
  collectorSvcAccount: tempo # Replace with the ServiceAccount Tempo is running with
Generate the YAML needed with linkerd jaeger install -f linkerd-jaeger-values.yaml > linkerd-jaeger.yaml and apply it with kubectl apply -f linkerd-jaeger.yaml.
This will create a namespace named linkerd-jaeger that will contain the jaeger-injector.
NGINX Ingress Controller
I’ll assume that NGINX Ingress Controller has been deployed with Helm, since that seems to be the most common practice. To enable tracing, you just need to add a few lines to your values.yaml:
controller:
  config:
	enable-opentracing: "true"
	zipkin-collector-host: tempo-distributor.tempo.svc.cluster.local # Replace this with the FQDN of your Tempo Distributor service
	zipkin-service-name: nginx-internal # This will show up as a process field in the spans with the key 'service.name'. Useful if you have multiple ingress deployments
Do a helm upgrade in the normal way, and you are good to go.
Grafana
To configure Grafana to emit spans, you’ll need to update your grafana.ini with the following values (replace address with the FQDN:Port of your Tempo Distributor service):
[tracing]
type = jaeger
[tracing.jaeger]
address = tempo-distributor.tempo.svc.cluster.local:6831
zipkin_propagation = true
Grafana Loki data source (optional)
If you ship your logs to Grafana Loki, you can configure your Loki data source for traceID detection.
Through the UI
Edit your Loki data source and add a Derived Field:
Name: TraceID
Regex: traceID=(\w+)
Query: ${__value.raw}
Internal Link: Checked
Dropdown: Select your Tempo data source
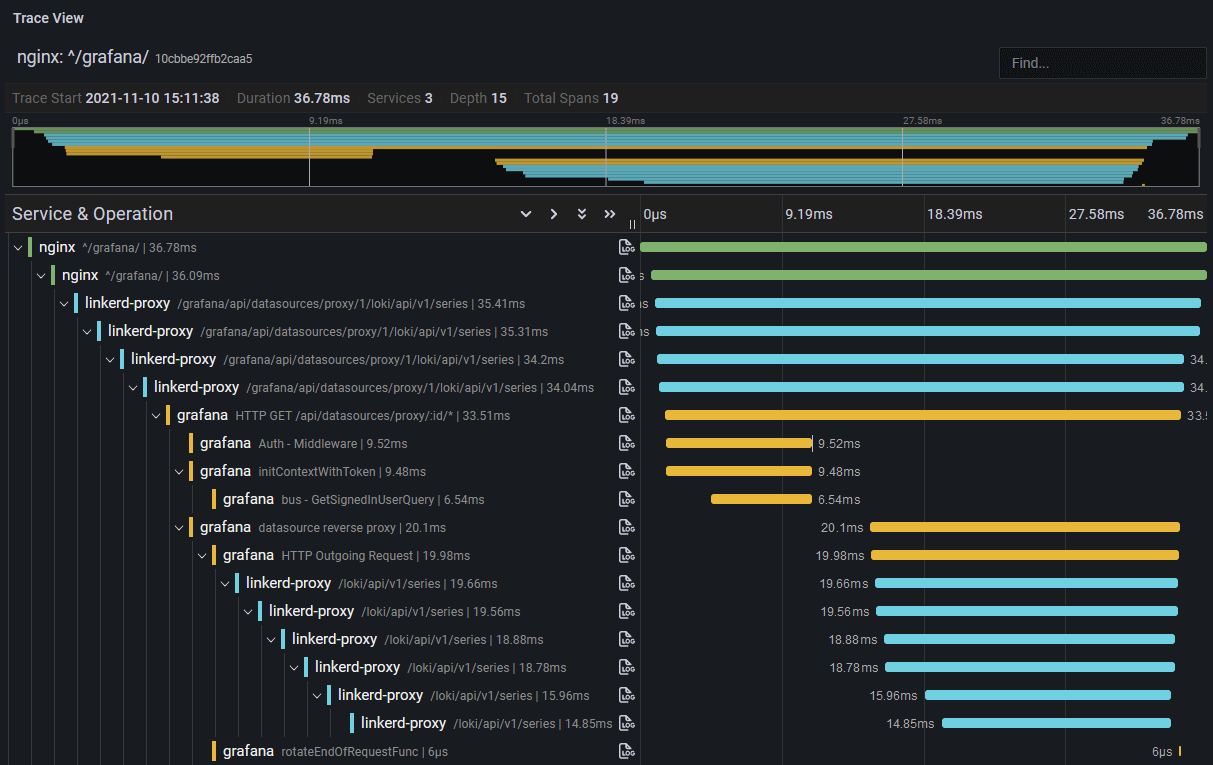
Testing it all out
Now, click around in Grafana a few times to generate a few requests. You then have a few choices of how to find your traces:
If you have activated the experimental Tempo search feature in both Grafana Tempo and Grafana:
- Go to Explore
- Select the Tempo data source
- Click on Search - Beta
- You should see some traces here
If you ship your Grafana logs to Loki:
- Go to Explore
- Select the Tempo data source
- Select Loki search
- Do a search for your Grafana logs, i.e.:
{namespace="monitoring", job="monitoring/grafana"}or similar depending on your setup - You should see some traces here
To grab the logs from Grafana, either directly from the pods or through your log system:
- Look for
traceID - Go to Grafana Explore
- Select the Tempo data source
- Select traceID
- Enter the traceID and run the query
- You should see a trace
- Look for
Conclusion
The example above shows how to get tracing from the request hits in your Ingress all the way down the stack. For instance, if you run Cortex, you can enable tracing and follow your requests further down the stack.
For your own applications/services, there are several different solutions for collecting and shipping traces. One good solution is the OpenTelemetry project, which has SDKs for the most common languages and support for different export formats and propagation formats.
But first, you should test out this setup! Start a single instance of the Grafana Tempo process and ship some traces to it. Use Grafana to explore the tracing data and think about how it can fit into your stack.
To learn more about Grafana Tempo and to see a live demo, register for our free webinar “Distributed tracing with Grafana: From Tempo OSS to Enterprise” led by Grafana Labs pros on Jan. 27.
The easiest way to get started with Tempo is with Grafana Cloud, and our forever-free tier now includes 50GB of traces along with 50GB of logs and 10K series of metrics. Sign up for free today!