Top 5 user-requested synthetic monitoring alerts in Grafana Cloud
We often hear from Grafana Cloud users who are asking for guidelines on how to write better alerts on synthetic monitoring metrics and get notified when synthetic monitoring detects a problem.
We already ship a predefined alert in Grafana Cloud synthetic monitoring. A predefined alert that we ship is alerting on the probe_all_success_sum metric and makes use of the alert sensitivity config to create multiple Grafana Cloud alerting rules. Check out synthetic monitoring alerting docs for details.
A predefined alert makes use of a recording rule on probe_all_success_sum and joins with sm_check_info to get the alert_sensitivity label. We then create alert rules using the recording rule with user-defined thresholds.
These alerting expressions can then be used to build alert rules. Please see Prometheus docs for more details.
Alert expressions
We use PromQL expressions to get data, scale, or perform calculations using promQL functions.
These are the top five expressions that our Grafana Cloud users are looking for help with:
- Uptime — The fraction of time the target was up.
- Reachability — The percentage of all checks that have succeeded.
- Average latency — The average time to receive a response across all checks.
- Error rate — What’s the total error percentage?
- Error rate by probe — What’s the error percentage for each probe that is observing the given target?
Here, we will write Grafana Cloud alerting (Alertmanager) expressions for the most requested synthetic monitoring metrics.
We will use alerts that watch across a ten minute [10m] time period as an example, but this could be changed to any length of time.
1. Uptime
This alert fires when a target is down (i.e., checks are failing across all probes).
Expression:
sum_over_time(
  (
	ceil(
  	sum by (instance, job) (idelta(probe_all_success_sum{}[10m]))
  	/
  	sum by (instance, job) (idelta(probe_all_success_count{}[10m]))
	)
  )[10m:]
)
/
count_over_time(
  (
  	sum by (instance, job) (idelta(probe_all_success_count{}[10m]))
  )[10m:]
)
When this expression is not equal to 1 (!=1), it will mean that the target is down, and none of the probes are able to reach the target.
This alert will not fire if at least one probe is able to reach the target and successfully check the target (i.e., check needs to pass).
You can configure a check to fail 100% of the time from all probes to test this expression. To do so, use a target that redirects and configure the check to not follow redirects. It will fail 100% of the time from all probes or use a target that doesn’t exist.
Example alert: alert when a target is down or unreachable from all probes
sum_over_time(
  (
	ceil(
  	sum by (instance, job) (idelta(probe_all_success_sum{}[10m]))
  	/
  	sum by (instance, job) (idelta(probe_all_success_count{}[10m]))
	)
  )[10m:]
)
/
count_over_time(
  (
  	sum by (instance, job) (idelta(probe_all_success_count{}[10m]))
  )[10m:]
) != 1
2. Reachability
Reachability is the percentage of all the checks that have succeeded during the time period.
We have two possible alert expressions in this case based on how you define your alert thresholds.
Expression 1:
sum by (instance, job) (delta(probe_all_success_sum{}[10m]))
/
sum by (instance, job) (delta(probe_all_success_count{}[10m]))
This expression returns reachability in 0 - 1 range, where 1 means 100% reachable. You can use 0.9 as a threshold when you want to alert if reachability drops down to 90%.
Example alert: alert when reachability drops below 90%
sum by (instance, job) (delta(probe_all_success_sum{}[10m]))
/
sum by (instance, job) (delta(probe_all_success_count{}[10m])) < 0.9
Expression 2:
100 * (sum by (instance, job) (delta(probe_all_success_sum{}[10m]))
/
sum by (instance, job) (delta(probe_all_success_count{}[10m])))
This expression returns reachability in the 0 - 100 range. In this case we are scaling the metrics by 100 to achieve this. Here you can directly use percentage numbers as thresholds.
Example alert: alert when reachability drops below 90%
100 * (sum by (instance, job) (delta(probe_all_success_sum{}[10m]))
/
sum by (instance, job) (delta(probe_all_success_count{}[10m]))) < 90
3. Average latency

Expression 1:
sum by (instance, job) (rate(probe_all_duration_seconds_sum{}[10m]))
/
sum by (instance, job) (rate(probe_all_duration_seconds_count{}[10m]))
This expression returns latency in seconds, so we need to define alert thresholds in terms of seconds or fractions of seconds.
Example alert: alert when latency goes above 1 second
sum by (instance, job) (rate(probe_all_duration_seconds_sum{}[10m]))
/
sum by (instance, job) (rate(probe_all_duration_seconds_count{}[10m])) > 1
Example alert: alert when latency goes above 500 milliseconds
sum by (instance, job) (rate(probe_all_duration_seconds_sum{}[10m]))
/
sum by (instance, job) (rate(probe_all_duration_seconds_count{}[10m])) > 0.5
Expression 2:
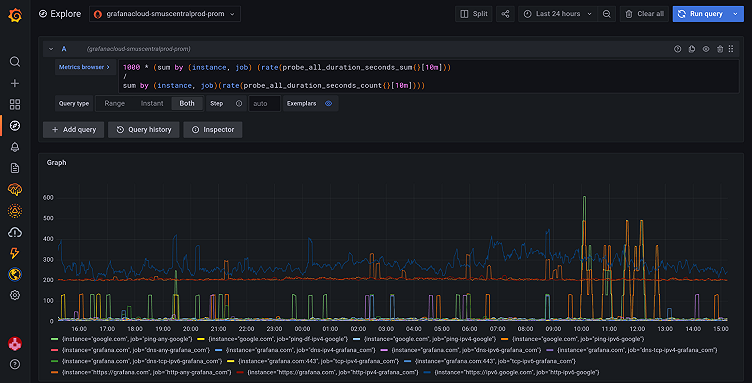
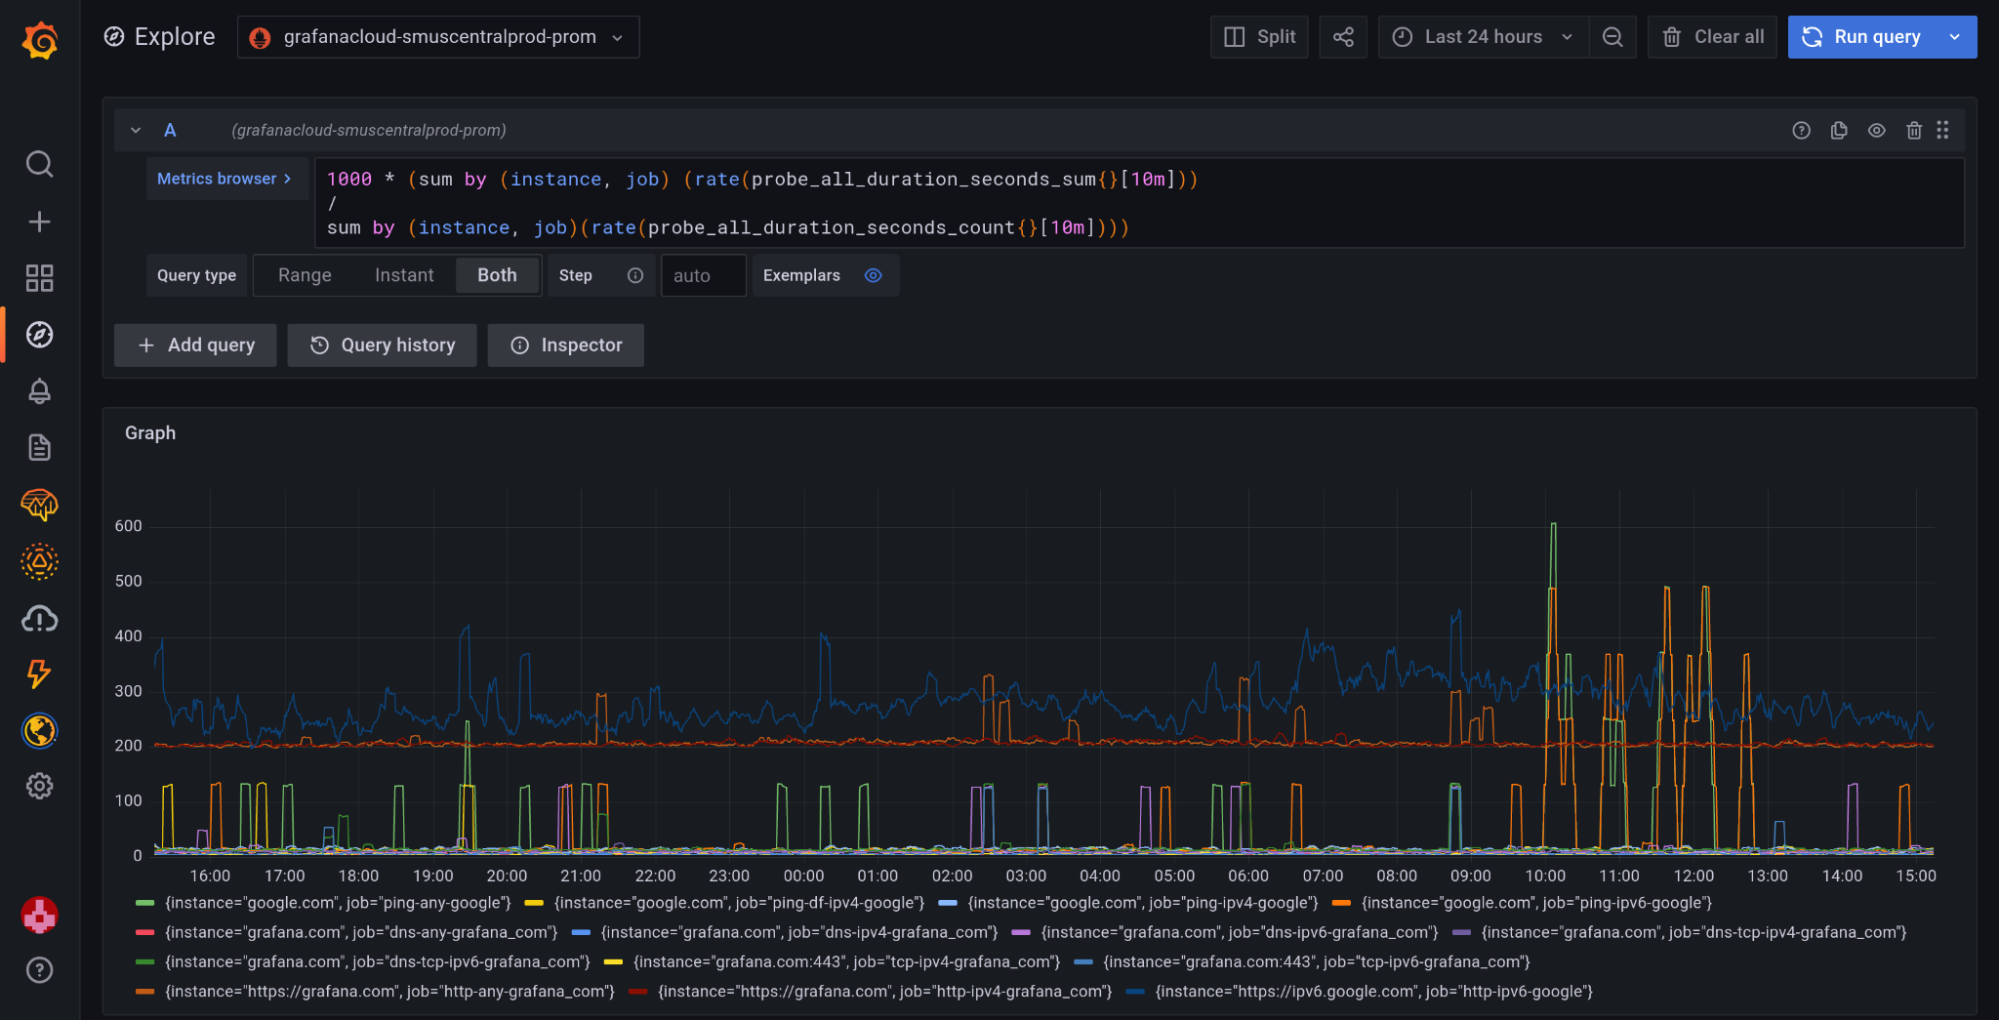
1000 * (sum by (instance, job) (rate(probe_all_duration_seconds_sum{}[10m]))
/
sum by (instance, job)(rate(probe_all_duration_seconds_count{}[10m])))
This expression returns latency in milliseconds, and milliseconds can be used as alert thresholds. Here we scaled the same expression by 1000 to get results in milliseconds.
Example alert: alert when latency goes above 500 milliseconds
1000 * (sum by (instance, job) (rate(probe_all_duration_seconds_sum{}[10m]))
/
sum by (instance, job) (rate(probe_all_duration_seconds_count{}[10m]))) > 500
4. Error rate
Expression 1:
1 - (
sum by (instance, job) (rate(probe_all_success_sum{}[10m]))
/
sum by (instance, job) (rate(probe_all_success_count{}[10m]))
)
This expression returns an error rate in the 0 - 1 range. For alerting, we need to define thresholds in the 0-1 range.
Example alert: alert when error rate is above 10%
1 - (
sum by (instance, job) (rate(probe_all_success_sum{}[10m]))
/
sum by (instance, job) (rate(probe_all_success_count{}[10m]))
) > 0.1
Expression 2:
100 * (1 - (
sum by (instance, job) (rate(probe_all_success_sum{}[10m]))
/
sum by (instance, job) (rate(probe_all_success_count{}[10m]))
))
This alert expression is scaled by 100. Now the error rate is in the 0-100 range. We can use percentage for our alert thresholds.
Example alert: alert when error rate is above 10%
100 * (1 - (
sum by (instance, job) (rate(probe_all_success_sum{}[10m]))
/
sum by (instance, job) (rate(probe_all_success_count{}[10m]))
)) > 10
5. Error rate by probe
Error rate by probe is the same as error rate, only we are including probe in sum by to breakdown data and get a metric for each probe.
Expression 1:
1 - (
sum by (instance, job, probe) (rate(probe_all_success_sum{}[10m]))
/
sum by (instance, job, probe) (rate(probe_all_success_count{}[10m]))
)
This expression returns the error rate in the 0 - 1 range, and this rate is for each probe. For alerting, we need to define thresholds in 0-1 range.
Example alert: alert when error rate on a probe is above 50%
1 - (
sum by (instance, job, probe) (rate(probe_all_success_sum{}[10m]))
/
sum by (instance, job, probe) (rate(probe_all_success_count{}[10m]))
) > 0.5
Expression 2:
100 * (1 - (
sum by (instance, job, probe) (rate(probe_all_success_sum{}[10m]))
/
sum by (instance, job, probe) (rate(probe_all_success_count{}[10m]))
))
This alert expression is scaled by 100. Now the error rate for each probe is in the 0-100 range. We can use percentage for our alert thresholds.
Example alert: alert when error rate on a probe is above 50%
100 * (1 - (
sum by (instance, job, probe) (rate(probe_all_success_sum{}[10m]))
/
sum by (instance, job, probe) (rate(probe_all_success_count{}[10m]))
)) > 50
Alert rules
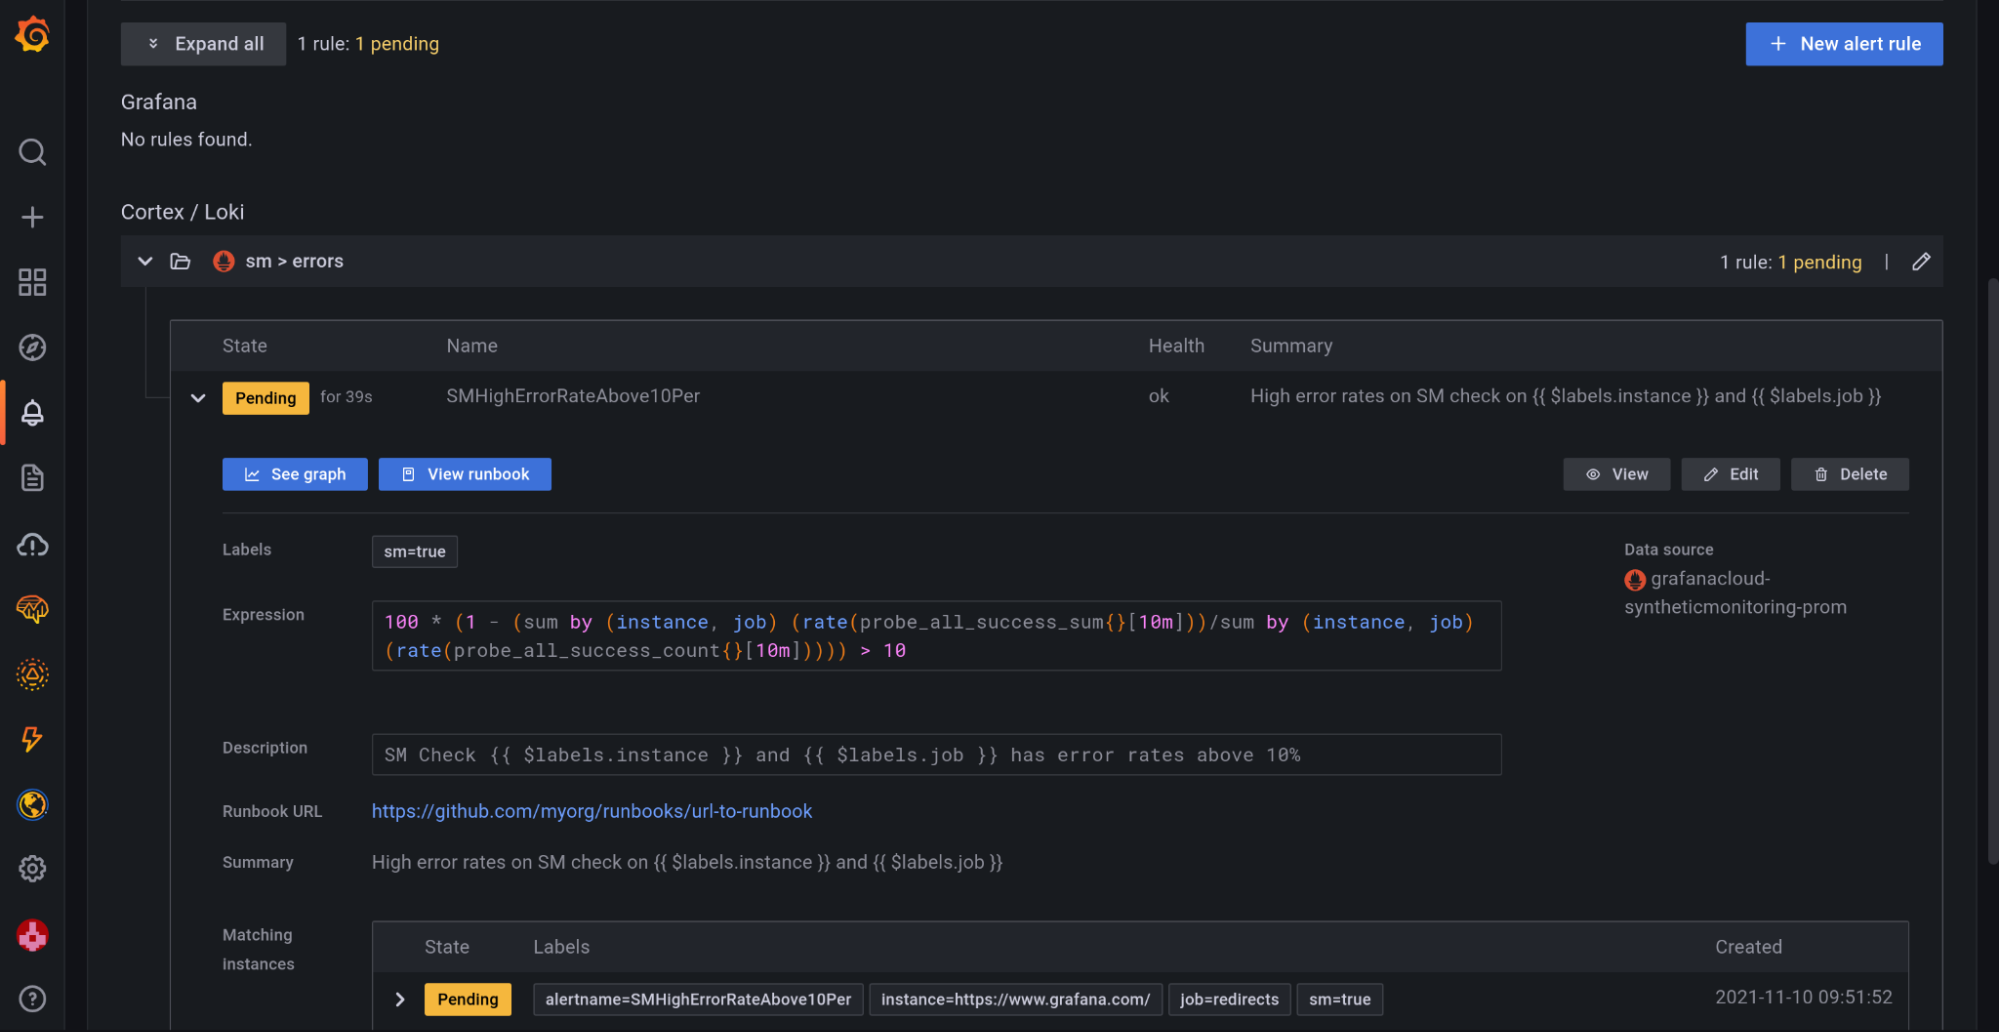
To build an alert, we need to add a condition in that expression. When that condition evaluates to true (i.e., returns some data), our alert is considered active.

Example alert rule:
alert: SMHighErrorRateAbove10Per
expr: 100 * (1 - (sum by (instance, job) (rate(probe_all_success_sum{}[10m]))/sum by (instance, job) (rate(probe_all_success_count{}[10m])))) > 10
for: 5m
annotations:
  summary: "High error rates on SM check on {{ $labels.instance }} and {{ $labels.job }}"
  description: "SM Check {{ $labels.instance }} and {{ $labels.job }} has error rates above 10%"
In this example alert rule, we are alerting when the error rate of any check across all probes goes above 10% in the last 10 minutes.
alert: SMHighErrorRateAbove10Per
is our alert name
expr: 100 * (1 - (sum by (instance, job) (rate(probe_all_success_sum{}[10m]))/sum by (instance, job) (rate(probe_all_success_count{}[10m]))))
is our promQL expression (with condition/threshold).
expr: 100 * (1 - (sum by (instance, job) (rate(probe_all_success_sum{}[10m]))/sum by (instance, job) (rate(probe_all_success_count{}[10m])))) > 10
is our promQL expression with condition/threshold (> 10 in this case). An alert rule needs an expression with condition.
You can take this expression and query it using Grafana Explore. If you get data back with condition, that means that alert will fire. You can test your alert expression and tweak thresholds.
for: 5m
Defines the duration to wait after our expression evaluates to true (i.e., returns data). In this case, the expression needs to evaluate to true for at least 5 minutes for the alert to fire. The alert will stay in a pending state for 5 minutes, and after that will transition into a firing state.
annotations:
This section can be used to define additional information such as alert descriptions, runbook links, or dashboard links. You can use templating in this section to display alert labels or other details.
TIP: You can look at the ALERTS{} Prometheus time series to see which alerts are active (pending or firing).
If you want to learn more, check out our session on synthetic monitoring in Grafana Cloud from GrafanaCONline 2021.
Don’t have a Grafana Cloud account? Sign up for free now and check out our generous forever-free offering and plans for every use case.


