
Five tricks for logging at scale in a Kubernetes environment with Grafana Loki
Editor’s note: In a previous version, we didn’t properly attribute all speakers. We have fixed this mistake and apologized to the parties involved.
Legacy logging solutions simply couldn’t keep up with the complex, hyperconverged regional infrastructure at Civo, a Kubernetes service provider that enables users to launch k8s clusters within 90 seconds.
“With our infrastructure and application deployment getting more complex and more distributed, we needed our logging solution and our entire observability stack to scale up with our needs,” said Anaïs Urlichs, Site Reliability Engineer at Civo.
In their recent ObservabilityCon 2021 session titled “Learning the tricks of Grafana Loki for distributed logging at scale in a Kubernetes environment,” Urlichs and her teammate, Principal Engineer Alex Jones, shared how Civo uses Promtail in concert with Grafana Loki and Grafana dashboards to collect and visualize logs across their entire infrastructure. They also shared five tips for success that they gleaned along the way.
Getting started with Grafana Loki for distributed logging
The session included a broad overview of Civo’s observability stack and how Loki seamlessly fit in. The team uses Promtail to gather and access logs in their k8s cluster, then forwards the logs into Grafana Loki for aggregation. The logs are then visualized in Grafana dashboards to deliver insights for the teams at Civo.
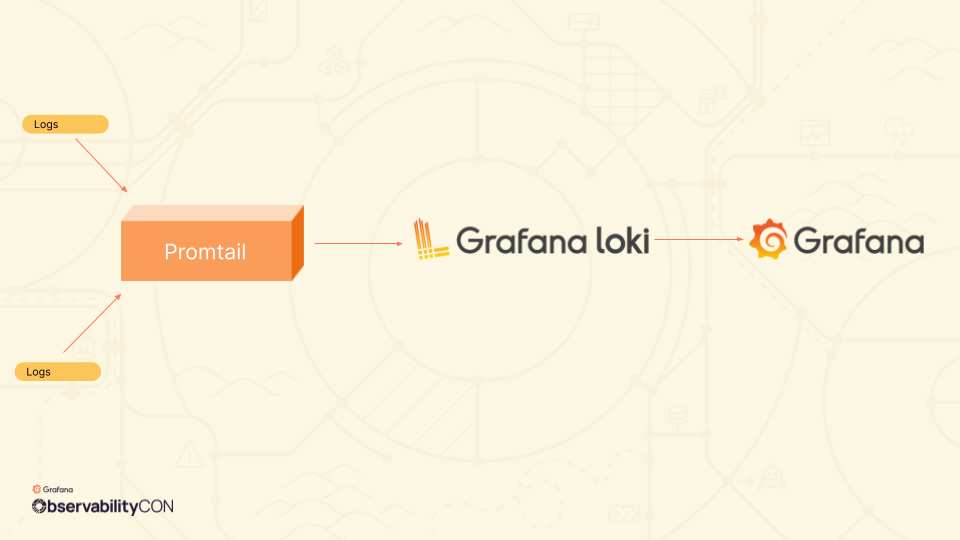
Above: Civo uses Promtail, Grafana Loki, and Grafana dashboards to achieve logging at scale in a Kubernetes environment.
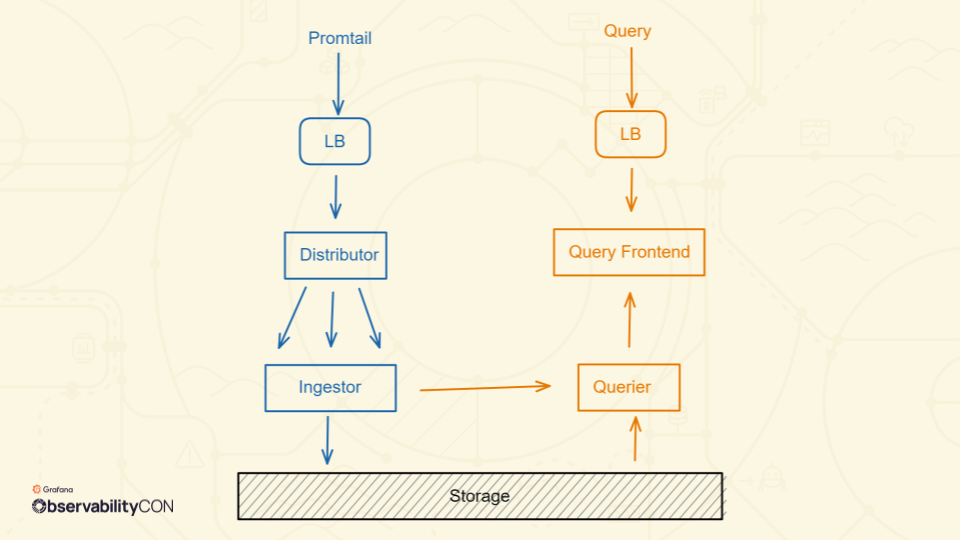
The talk then provided a more fine-tuned look at Civo’s Loki setup (below), outlining the necessary components to successfully process, store, and query logs.
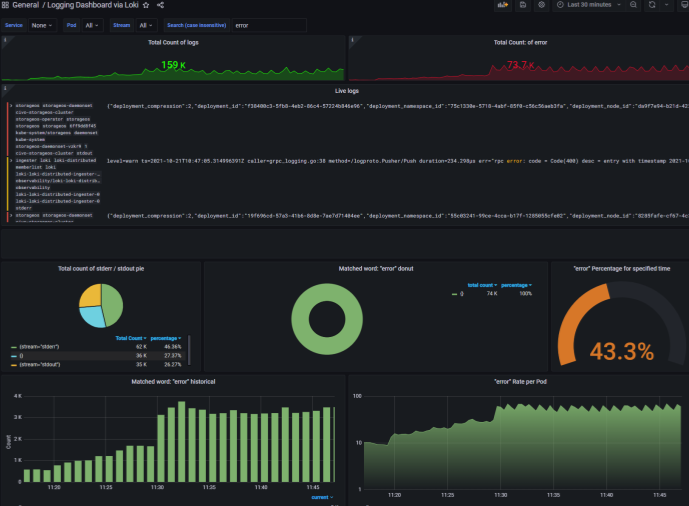
The Civo engineers went on to give a brief demo, showing exactly how to get started with Grafana Loki by spinning up a Civo cluster and installing the Promtail, Grafana, and Loki stack to provide cluster-level logging within minutes.
Then they showed how to how to visualize key metrics like average errors over time and create a new dashboard in Grafana. “Within 10 minutes, I’m adding value to my team because I can show them ‘Hey, I’m getting data from our logs that show the average number of errors in our logs are increasing over time,’” said Jones.
5 tips to get the most out of Grafana Loki
The team then shared five ways to maximize your use of Grafana Loki:
- Configure Grafana Loki to suit your infrastructure topology and ingestion needs. It’s pretty straightforward to tweak your Grafana Loki config in terms of scaling, KV stores, and caching.
- Combine Grafana Loki with Grafana Tempo to extract traces from your logs. With Grafana Tempo, you can pull out trace IDs from logs and create a side-by-side view within Explore.
- Leverage labels – they’re powerful shortcuts to your logs. Creating a standard set of labels and fields allows you to quickly drag and drop into those labels and get to the information you need faster.
- Take your querying to the next level with LogQL. Averaging, rate, and other commands are all there for you to use. This makes it simple to build dashboards and pull out useful information directly from your logs instead of using time-consuming chaining and filtering techniques.
- Create powerful visualizations with Grafana. Dashboards can provide immediate value to your team. There’s a saying at Civo: When you use Explore to take an expression and put it into a dashboard, “you’re effectively falling into a pit of success."
What’s next?
Now that the Civo team has mastered logging at scale in their Kubernetes environment, they’re planning to implement inter-regional logging, deliver supply chain observability, and deploy additional synthetic monitoring for tenant clusters.
See the full demo and get more detail on the Civo team’s best tips for logging at scale with Grafana Loki by watching the full session. All our sessions from ObservabilityCON 2021 are now available on demand.
Scale Kubernetes logging even faster on Grafana Cloud. Get started with up to 50GB of free log storage using our forever-free plan and check out our quickstart guide for shipping logs to Grafana Cloud.


