How product teams can manage their performance using Grafana, Prometheus, and Oracle metrics
Ever known a project manager who thinks a task takes minutes when it really takes hours? One company has developed a helpful monitoring tool that not only helps project managers make more realistic estimates, but also helps product teams save time, increase efficiency, and improve their overall performance.
At ObservabilityCON 2021, Walter Ritzel Paixão Côrtes, a product designer at Dell, gave a presentation about a data-driven solution his team developed called Product Team Observability. It uses Grafana, Prometheus, and Oracle to use metrics to monitor performances and track goals.

As Dell embarked on a digital transformation journey, Ritzel’s team recently started moving from a project focused approach to a product focused approach. “The main point that we have noticed that is different, is that we have huge ownership over our products,” he said. As a result, the team is learning to use a new set of tools and is doing things they hadn’t done before.
In the past, a product manager would rely on an up-to-date schedule and a good backlog to monitor a team’s performance and see if a delivery is on track to meet their goals. With the new product model, they also take into account a metrics backlog, user metrics, application metrics, survey feedback, dev ops metrics, and more. “Unless your product manager can grow several arms to deal with all that, we need to find a smarter way to collect all this information,” he said.
“A whole view of what our team is doing”
Product Team Observability is based on the three pillars of observability: metrics (data such as user, business, and stakeholder KPIs); tracing (for maturity levels progression and compliance reports); and logs (the focus includes pipeline logs and vulnerability logs). Ritzel explained they have created one ETL process that extracts information from different places, mostly using APIs.
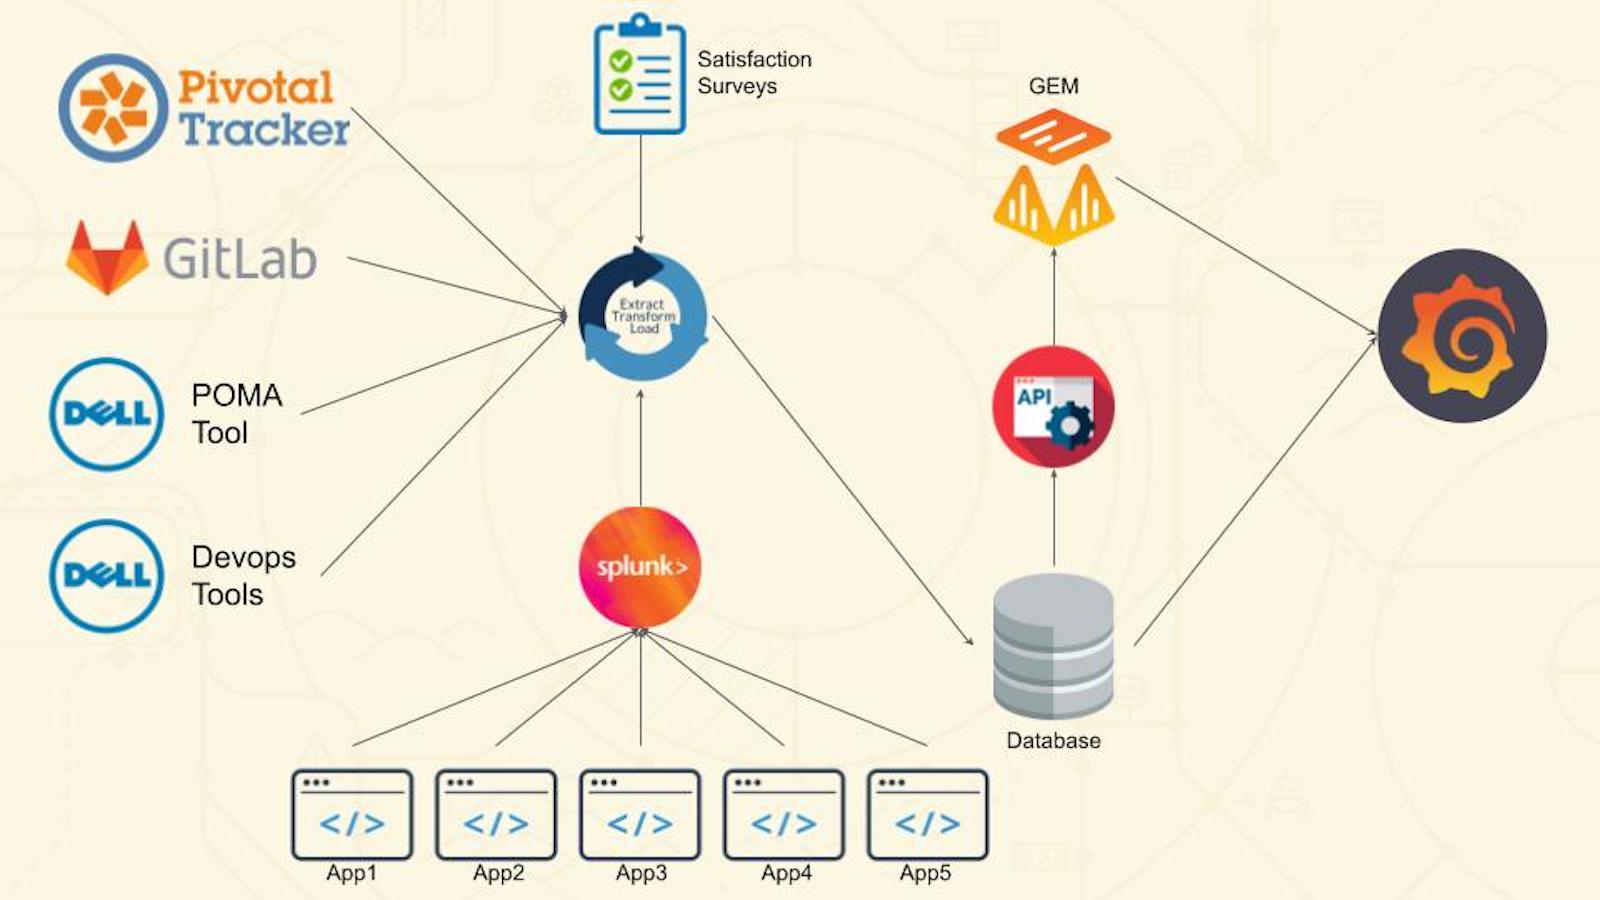
The key pieces of information that get stored in their database are later queried in two ways. Time series data is delivered into Grafana Enterprise Metrics through an API, while other non-time series data is delivered straight into Grafana.
About 15 different metrics are monitored in this one main dashboard:
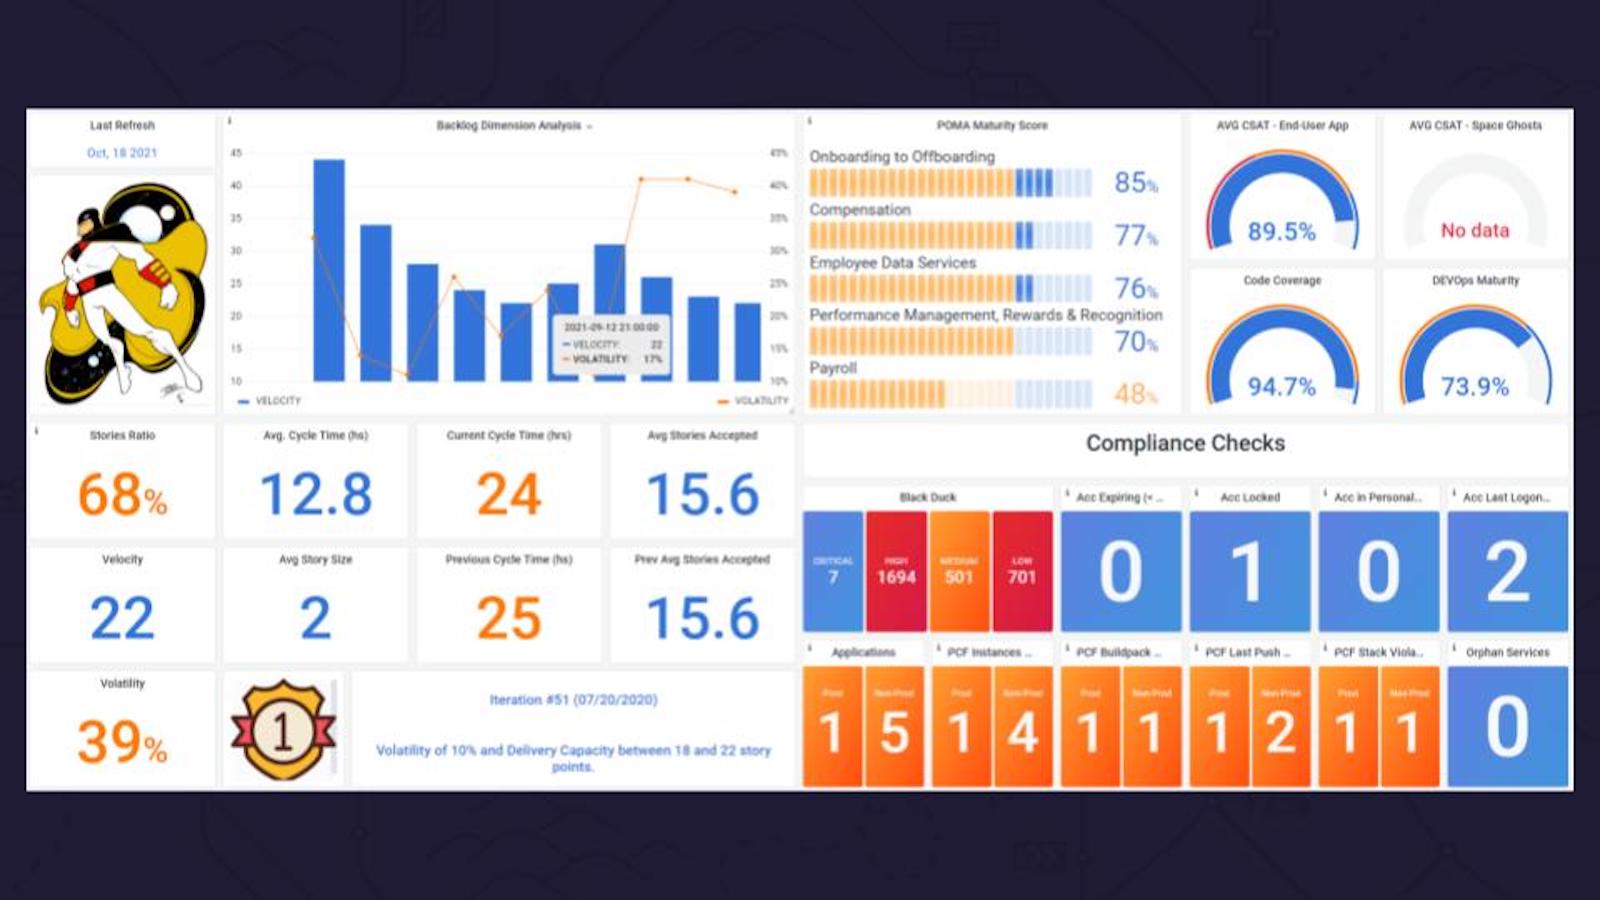
The left side features mostly backlog metrics, which include the Stories Ratio (which shows the team how much of their effort has a direct value to the end users) and the Cycle Time (the overall effort to complete the story). It also displays the velocity and volatility metrics. Ritzel called it “the most hated backlog metrics of all time,” but said it’s useful to help the team set its pace and be predictable.
The right side contains compliance metrics and verifications, such as a product maturity score and customer satisfaction metrics.
“We have a whole view of what our team is doing and how well we are [doing] on each aspect,” Ritzel said.
At the start of the year, five products being monitored with Product Team Observability had a product maturity score of about 15%. Thanks to a strong data-driven mindset, by the end of the third quarter, four out of five products had reached the goal of 70%.
According to Ritzel, the data-driven product observability approach has paid off in several ways:
- Saving six hours per week for the product manager, who now has more time to connect with the stakeholders and end users, which increases the team’s ability to understand and solve problems
- Increasing team efficiency by about 10%
- Improving the team’s ability to assess performance in creating action items by delivering read-to-use measures
- Creating a cultural change in the organization. “The executives and other teams have started to look at the metrics in a different way,” he said. Rather than looking at metrics as “good” or “bad,” they can “be drivers for planning changes and planning improvements.”
To learn more about managing and improving product team performance, check out the full ObservabilityCON session. All our sessions from ObservabilityCON 2021 are now available on demand.
If you’d like to learn more about Grafana Enterprise Metrics or try it out, contact us!