Grafana EMEA meetup recap: shift left observability, AI and load testing, monitoring plants, and more
On Dec. 8, we gathered the Grafana EMEA community for another dynamic meetup.
Experts from the Grafana Labs and k6 teams alongside observability pros from different organizations covered topics ranging from shift left observability practices to monitoring your green thumb at home with Grafana.
In case you missed the virtual get together, here’s a recap of each talk along with the session videos.
Planting the seed of observability
First up was Giordano Ricci, Grafana Labs Software Engineer. Gio convinced us that monitoring your houseplants doesn’t need to come with a lot of wires or cost a bunch of money. Instead he showed the community how to use the free Grafana Cloud plan to set up a monitoring system for your at-home greenhouse.
While there’s plenty more for Gio to experiment with, such as fine-tuning sensors for the different seasons, you can follow his step-by-step instructions for a basic setup of broadcasters and observers.
Shift left observability
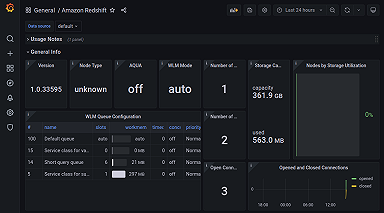
In her session titled “Monitoring microservices on AWS," Sara Gerion, Senior Solutions Architect at Amazon Web Services, showed how data points can be utilized and displayed in Amazon Managed Grafana dashboards to better assess the health of your microservices — not to mention your overall system.
The big takeaway? The ability to understand how your system is behaving at a glance and to quickly identify the root cause of downtime demands that teams shift left and start thinking about observability even before building their microservices.
AI + load testing
Yusuf Tayman, Senior Software QA Engineer at OpenPayd, showcased how the GitHub Copilot extension for VS Code helps him write his load tests. In technical preview, Copilot works especially well for the more commonly used frameworks like JavaScript, which is what is used to write scenarios in k6.
Check out Yusaf’s 10-minute demo, which featured GitHub Copilot suggesting whole lines of code as well as entire functions.
Cloud native observability 101
Richard “RichiH” Hartmann, Director of Community at Grafana Labs, Prometheus team member, OpenMetrics founder, and CNCF TAG Observability chair, discussed how it’s easy to lose sight of the valuable concepts underpinning some of the cloud native technologies that have gained so much hype in recent years.
In this introductory talk, RichiH took a step back from the noise and defined a good set of default tools that work in the cloud and more traditional environments alike.
Join us for the next EMEA meetup!
Our next EMEA meetup is planned for Jan. 26. Head over to the Grafana Labs events page to learn more about our upcoming meetups, webinars, community meetings, and more.
Interested in speaking at one of our future meetups? Guest speakers are given 8 to 15 minutes to present with an additional 5 minutes for audience Q&A. If you’d like to participate in a future Grafana meetup, please fill out our speaker application form.


