Query and analyze Amazon S3 data with the new Amazon Athena plugin for Grafana
This blog post was co-authored by Sarah Zinger, Software Engineer in R&D at Grafana who works as part of the cloud data sources squad that builds open source data source plugins to connect Grafana with major cloud providers, and Robbie Rolins, a Software Development Engineer on the Amazon Managed Grafana team.
In collaboration with the AWS team, we have recently released the new Athena data source plugin for Grafana.
Athena is an interactive serverless service that makes it easy to analyze data in Amazon S3 using standard SQL. Athena supports a wide variety of data formats including CSV, JSON, ORC, Arvo, and Parquet. Athena also integrates with AWS Glue Data Catalog, which allows you to create tables and query data based on a central metadata store of many AWS services, such as CloudFront, ELB, and more. Athena is the easiest way to run ad-hoc queries for data in S3 without the need to set up or manage servers.
Now with this plugin, users can visualize all of their Athena queries in Grafana, taking full advantage of the wide range of visualization options that Grafana offers and combining them with other data from multiple sources in a single Grafana dashboard.
Athena plugin features
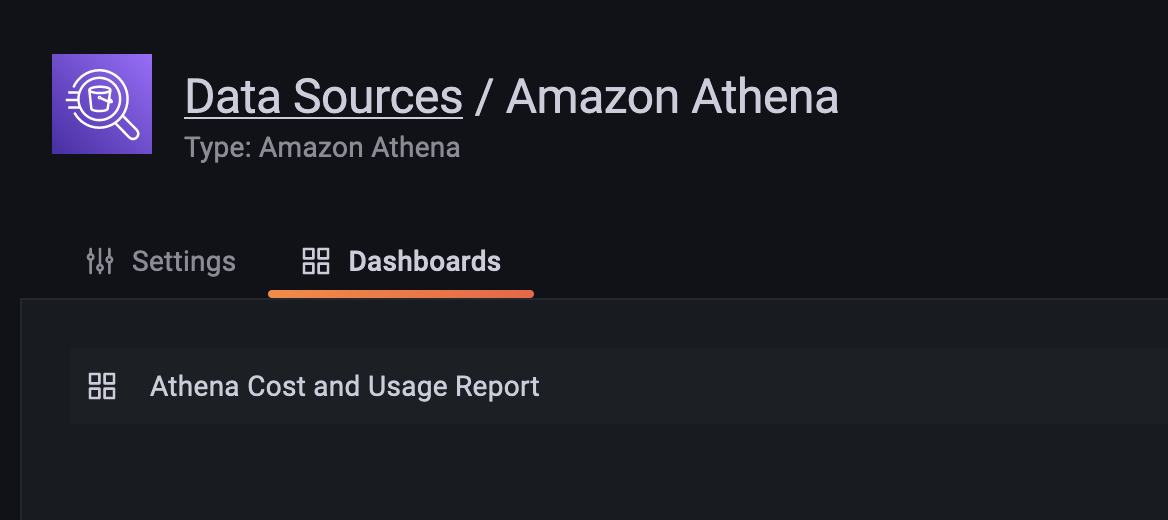
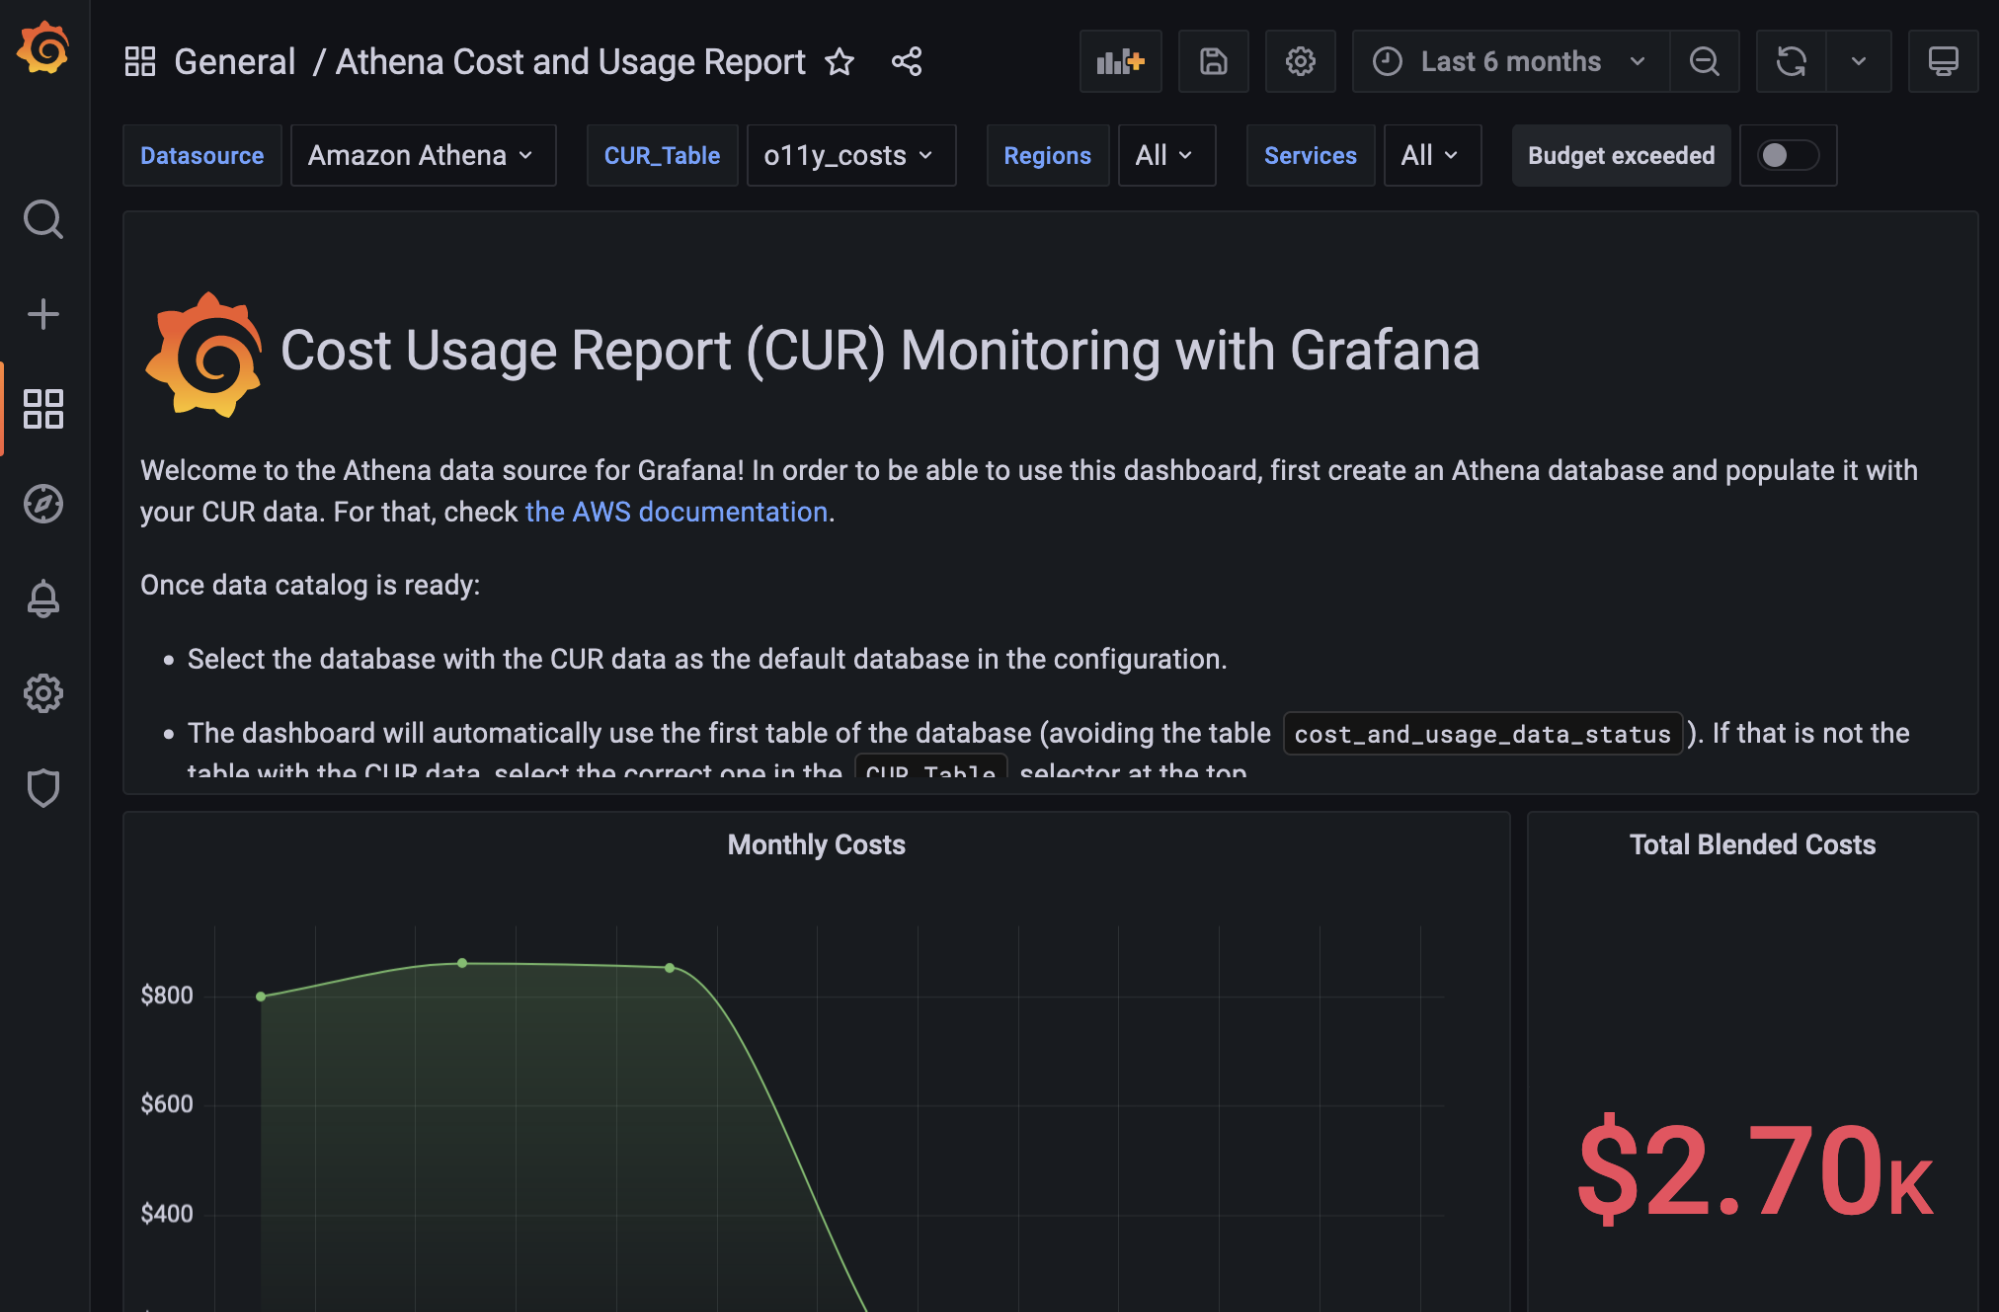
When you install the Athena data source plugin for Grafana, you’ll see in the Dashboards tab on the configuration page that this plugin comes with a curated dashboard that is set up to read AWS Cost Usage Reports (CUR) data.
Query editor with macros
When we edit a panel from our CUR dashboard, we see the query editor for the plugin comes with SQL syntax highlighting and allows us to make queries per region, per data source, and per database, or use default selections as set on the plugin’s configuration page.
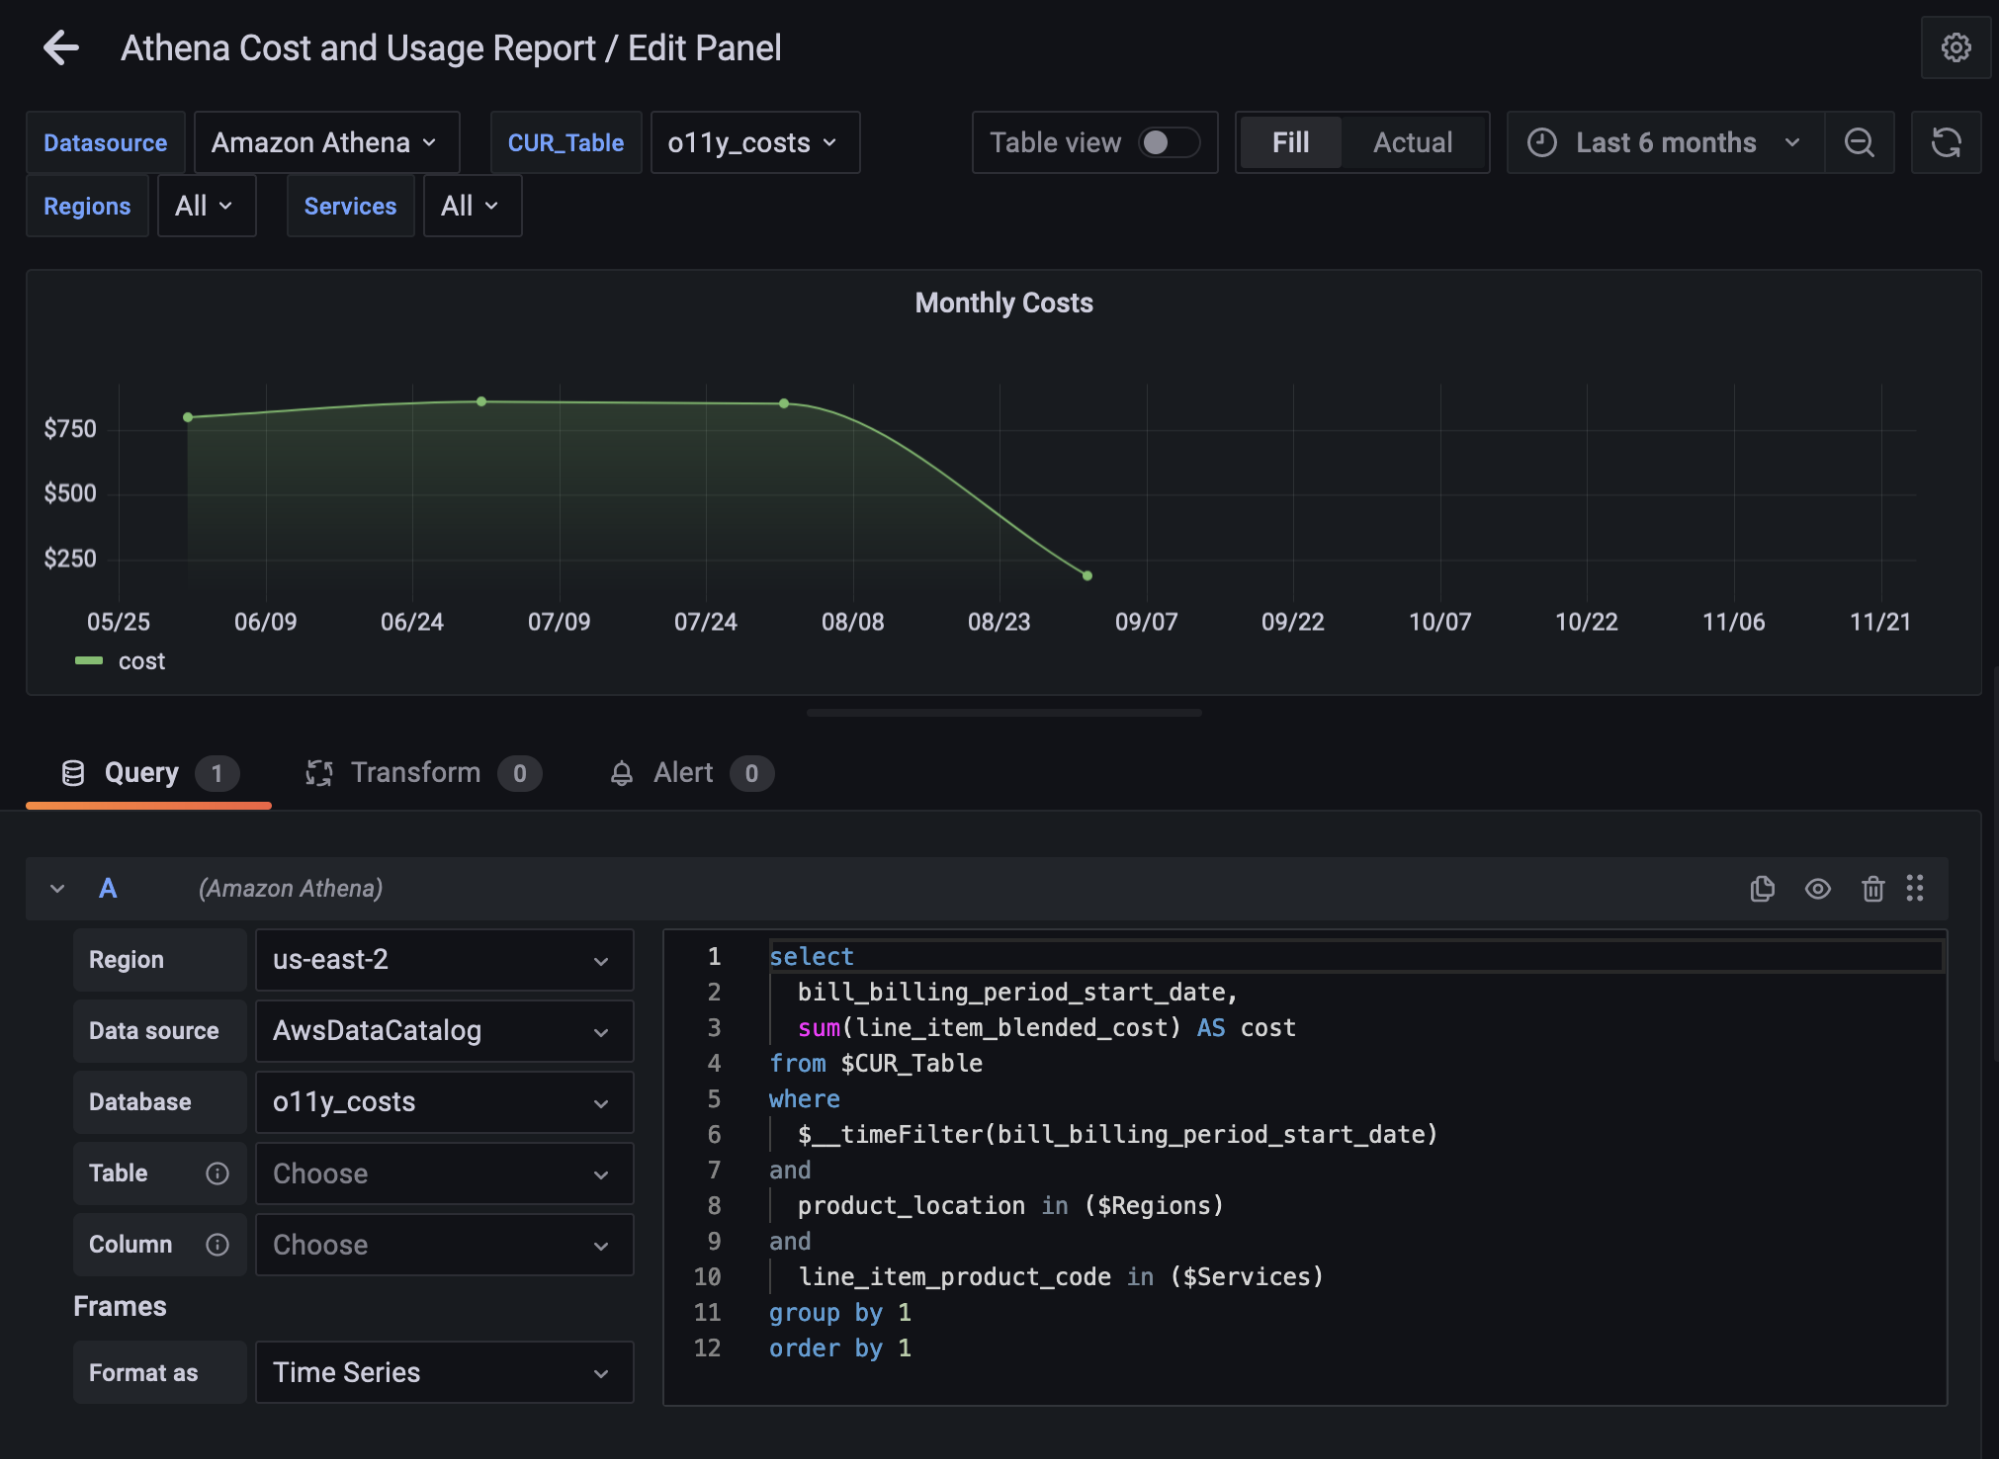
The editor also has a selection of macros that can be used in a query that are documented in the plugin’s readme. In the example above, we make use of the $__timeFilter macro that selects data dynamically based on your Grafana time selection.
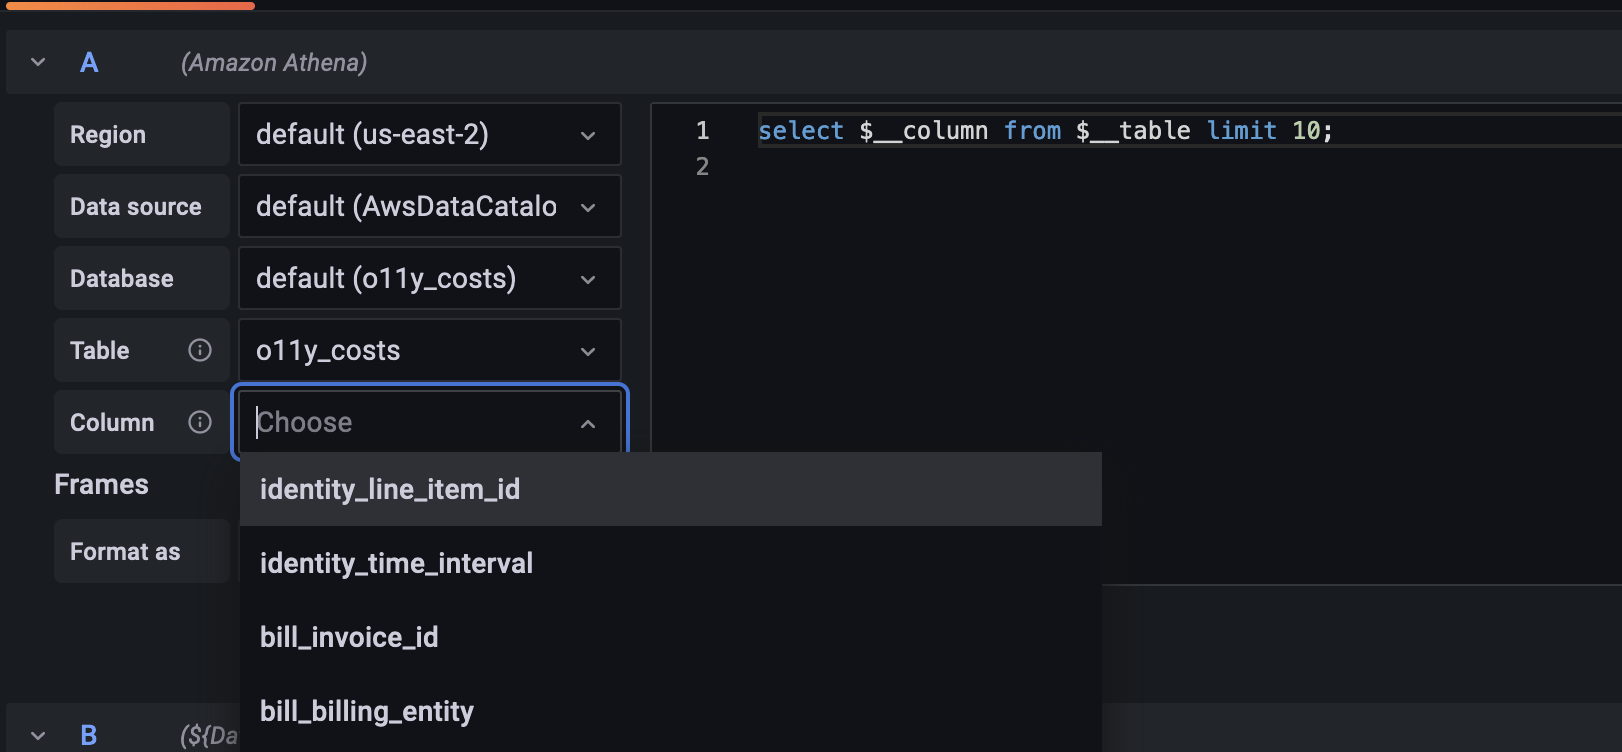
The $__table and $__column dropdown macros allow you to explore your data’s tables and columns and allow you to write dynamic queries based on your selection.
Template variables
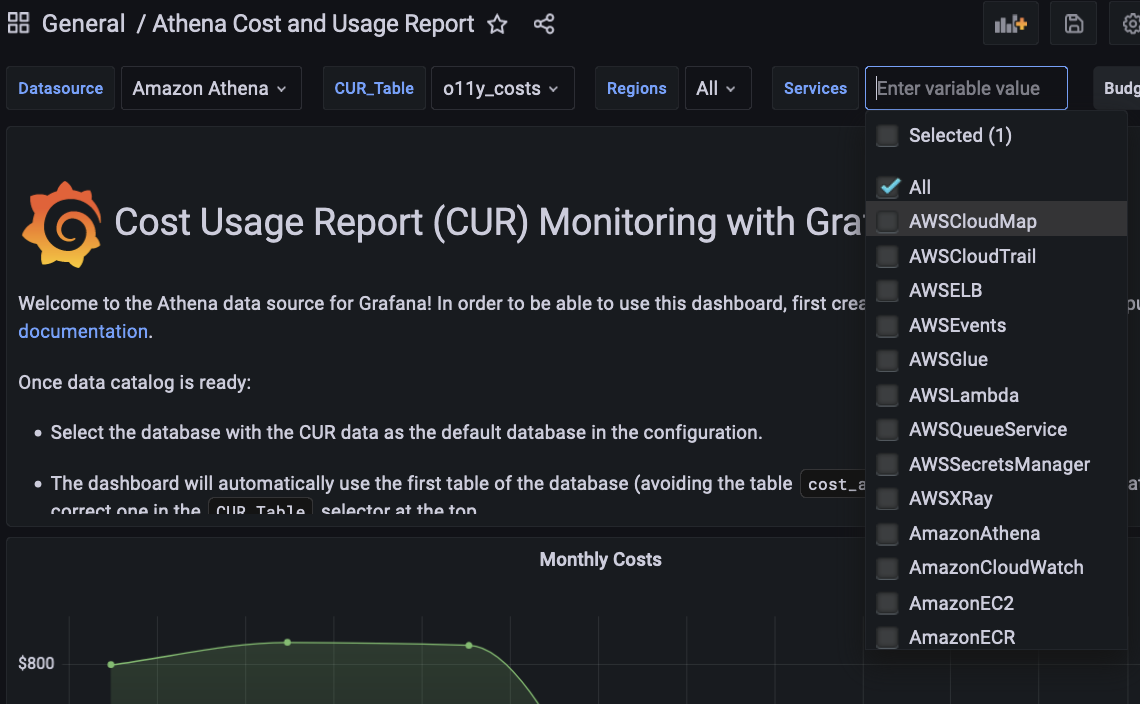
You can see in our Athena Cost & Usage Report dashboard that we use several template variables to make browsing between different data sources and services easier. For example, here you can see we use a template variable to select all services which lets us drill down into the costs for a particular service.
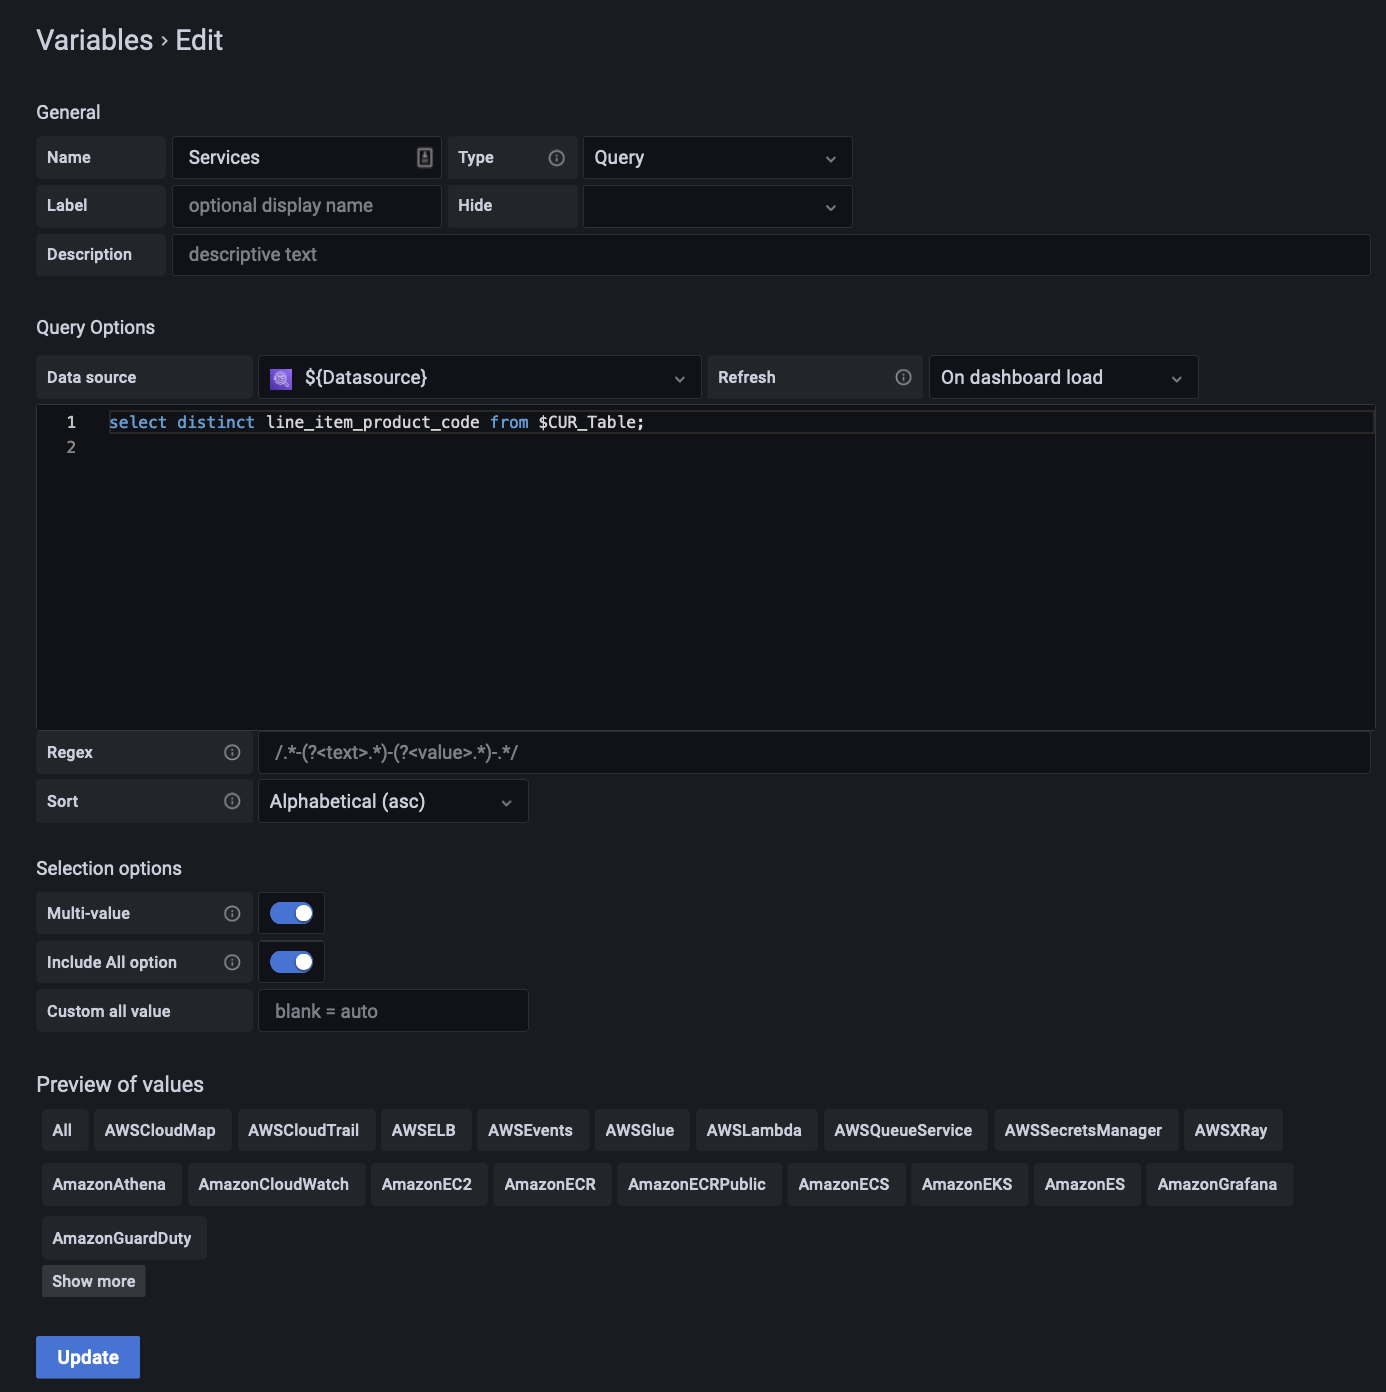
We create this template variable by going into the Variables tab on the dashboard settings page and using the query editor there.
Annotations
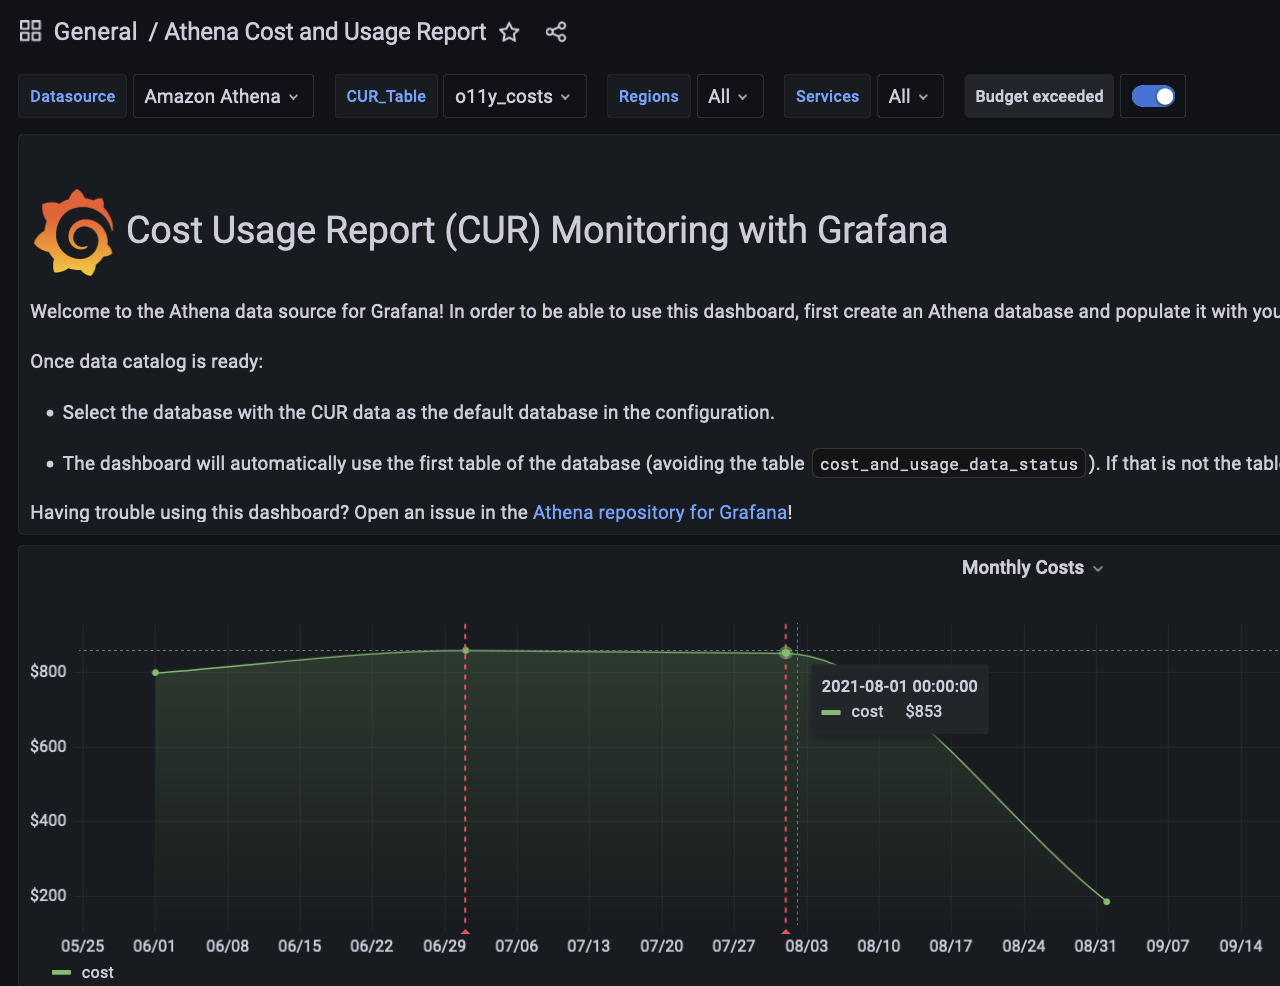
We also have an example of an annotations set up in a sample dashboard with a “Budget exceeded” tab. When we turn it on, we can see a dotted line appear on our graph every time our monthly costs exceed our budget of $850.
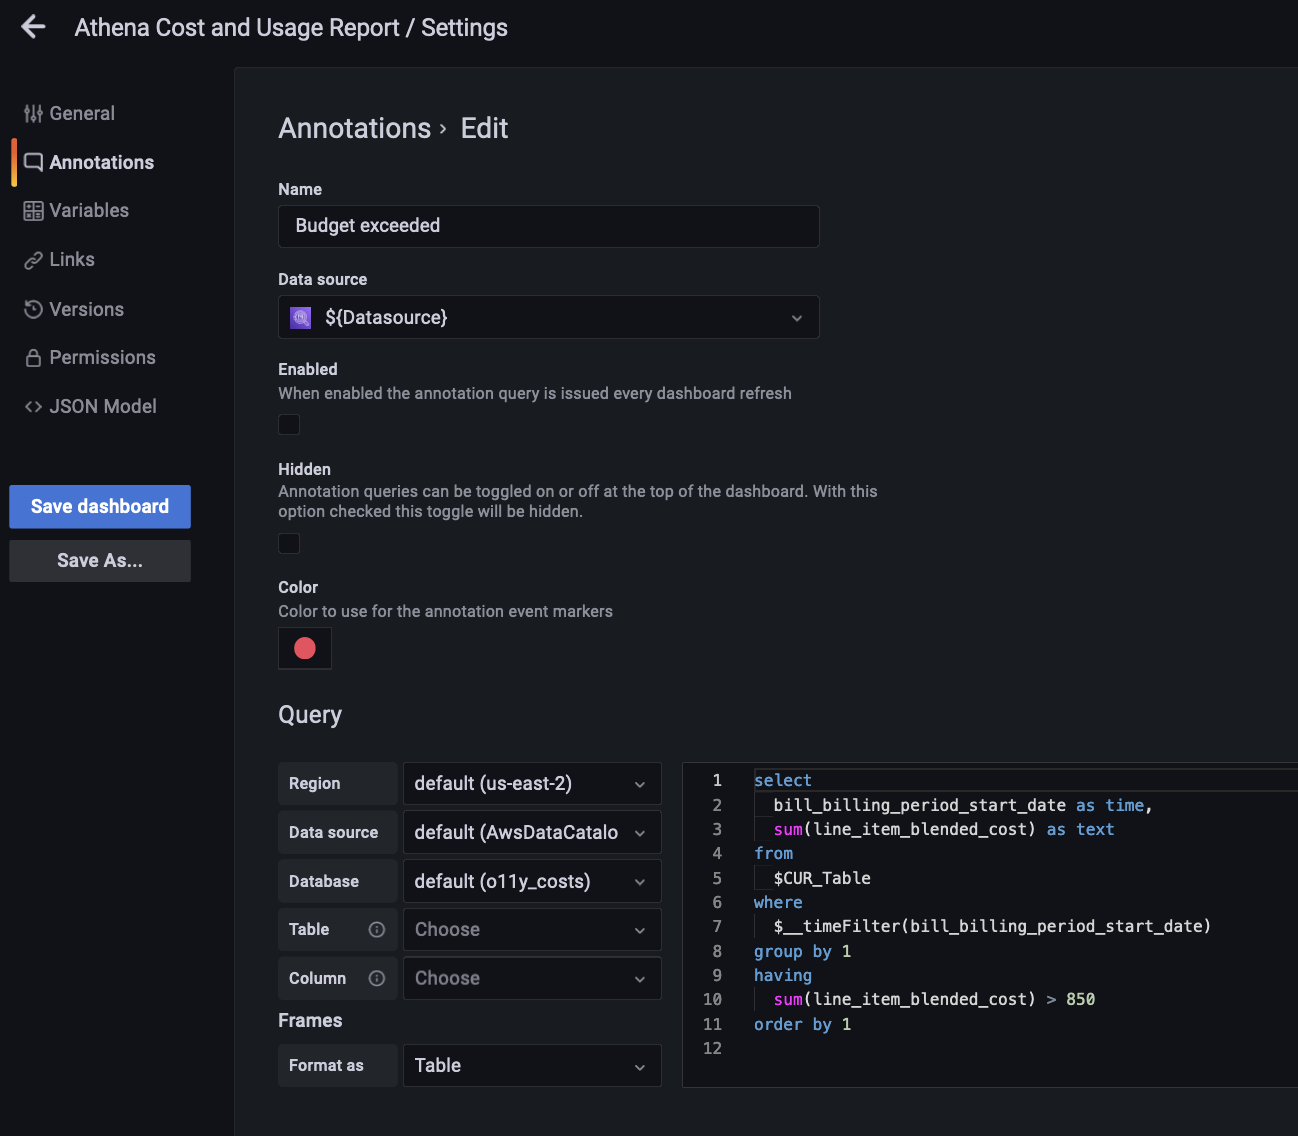
This is set up much in the same way as a variable, by going to the Annotations tab on the dashboard settings page and using the query editor there.
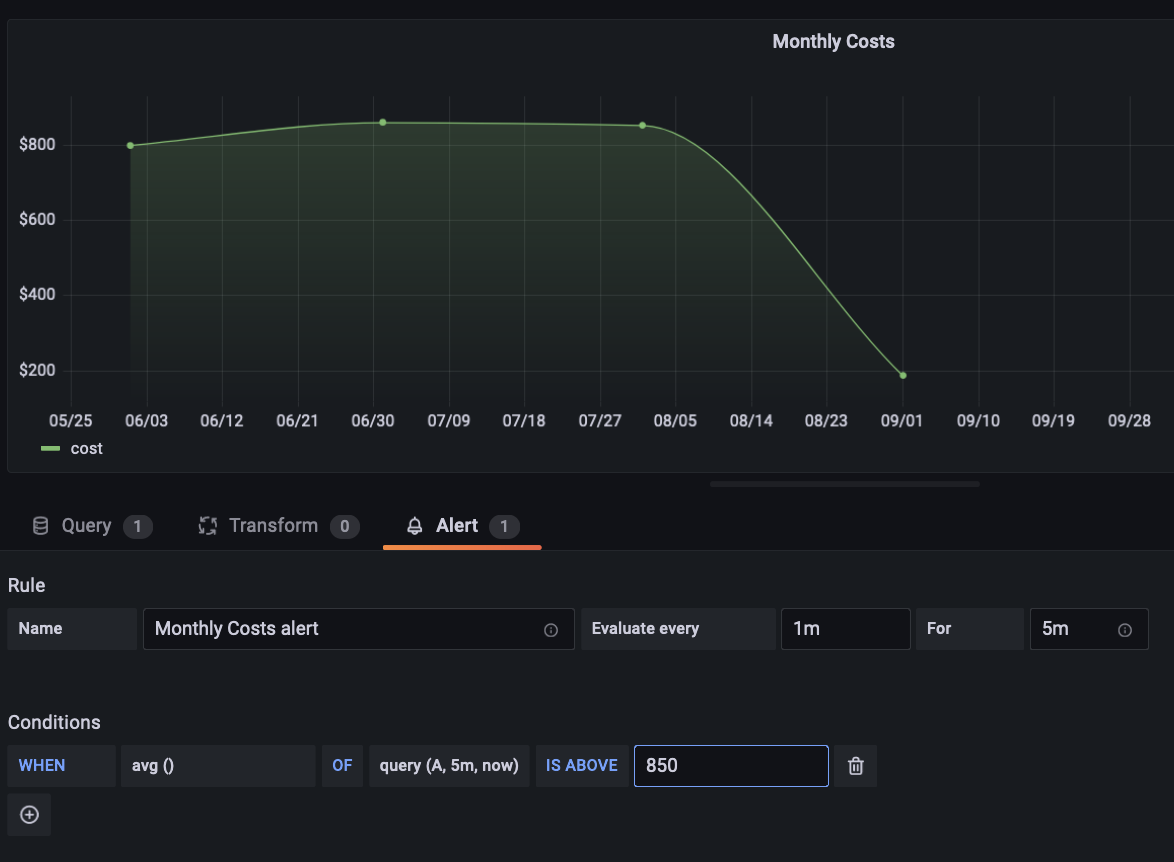
Alerts
The plugin also supports alerting: Simply create a query and select the Alert tab and configure the conditions under which you’d like to send off your alert.
Learn more about the Athena plugin
You can learn more about the Athena plugin for Grafana by checking out the project’s readme. To learn more about using Athena, you can also visit Amazon’s overview documentation.