Don't miss our webinars on the Grafana Stack, Grafana Enterprise, Grafana Machine Learning, and more!
Join us next week for three dynamic webinars featuring in-depth demos and live Q&A sessions that will focus on how to effectively use the Grafana Stack, Grafana Enterprise, and Grafana Machine Learning in your organizations.
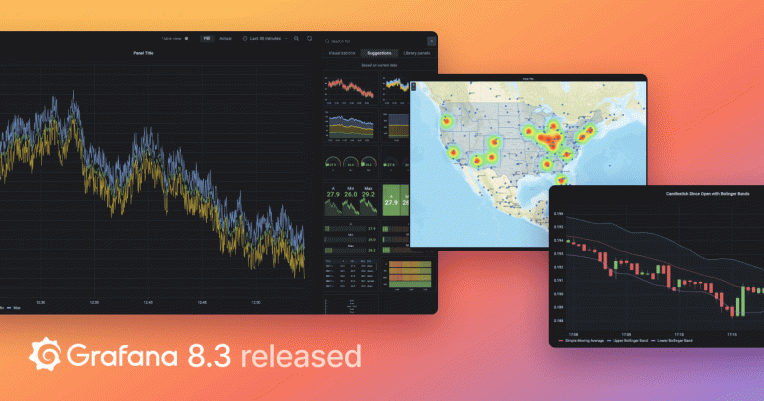
Reducing your observability TCO (total cost of ownership) with the Grafana Stack
Tuesday, December 14 | 9:30 PST, 12:30 EST, 17:30 UTC
Nowadays, companies can choose from a wide variety of open source and proprietary technologies which signals a strong desire for engineers to create more custom observability solutions. These technologies bring positive business outcomes, such as reducing the impact of downtime, improving customer experience, and boosting operational excellence. However, observability practitioners often lack the tools required to effectively shift the conversation from the technical aspects to the monetary benefits a project brings to an organization.
Grafana Labs Principal Solutions Engineer Abdelkrim Hadjidj will help you do that. In this webinar, we will explain how the Grafana Stack and value engineering (VE) tools can help decode the real cost (and savings!) of an observability stack. You will learn how to build and customize a total cost of ownership (TCO) tool to produce quantifiable and actionable metrics for business stakeholders, whether you are justifying a budget for a new observability project or looking for data to ask for a promotion.

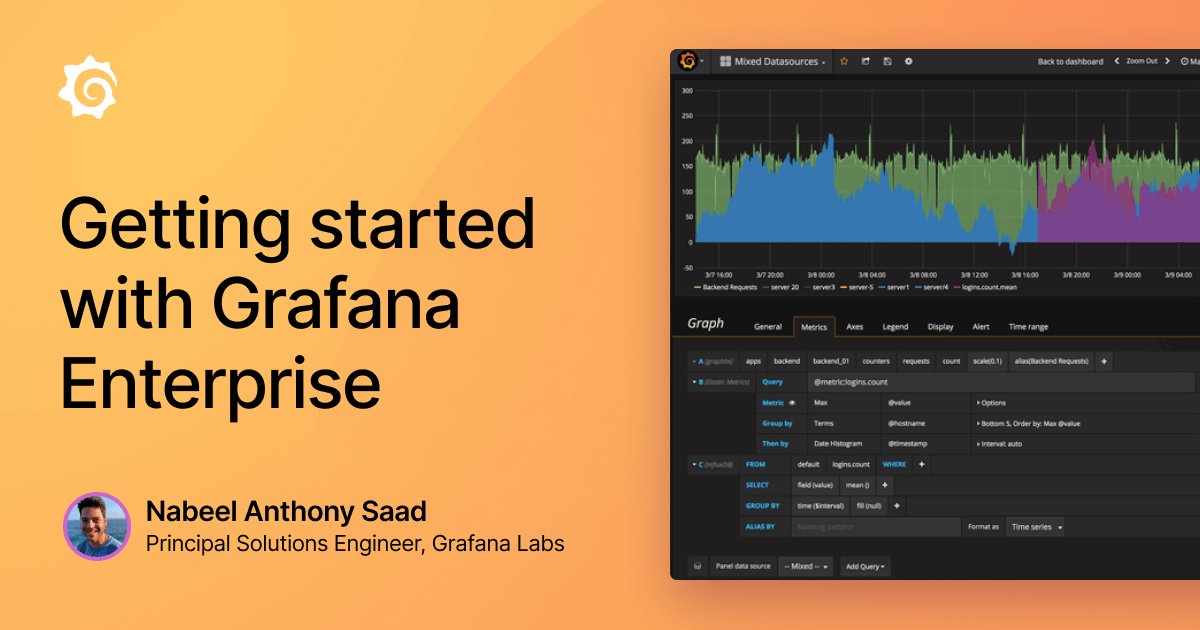
Getting started with Grafana Enterprise & observability (EMEA)
Wednesday, December 15 | 10:00 CET, 09:00 UTC
Go from zero to observability with this live, 30-minute demo of how to get started with the Grafana Enterprise Stack.
Led by Grafana Labs Principal Solutions Engineer Nabeel Anthony Saad, this webinar (scheduled at an EMEA-friendly time) will walk through how to set up monitoring for a web service that uses Prometheus for metrics, Loki for logs, and Tempo for traces as well as highlight popular Grafana Enterprise features such as data source permissions, PDF reporting, and more. You’ll also learn how to set up and use Enterprise plugins such as Splunk and New Relic to better connect, collect, and visualize all your data in Grafana.
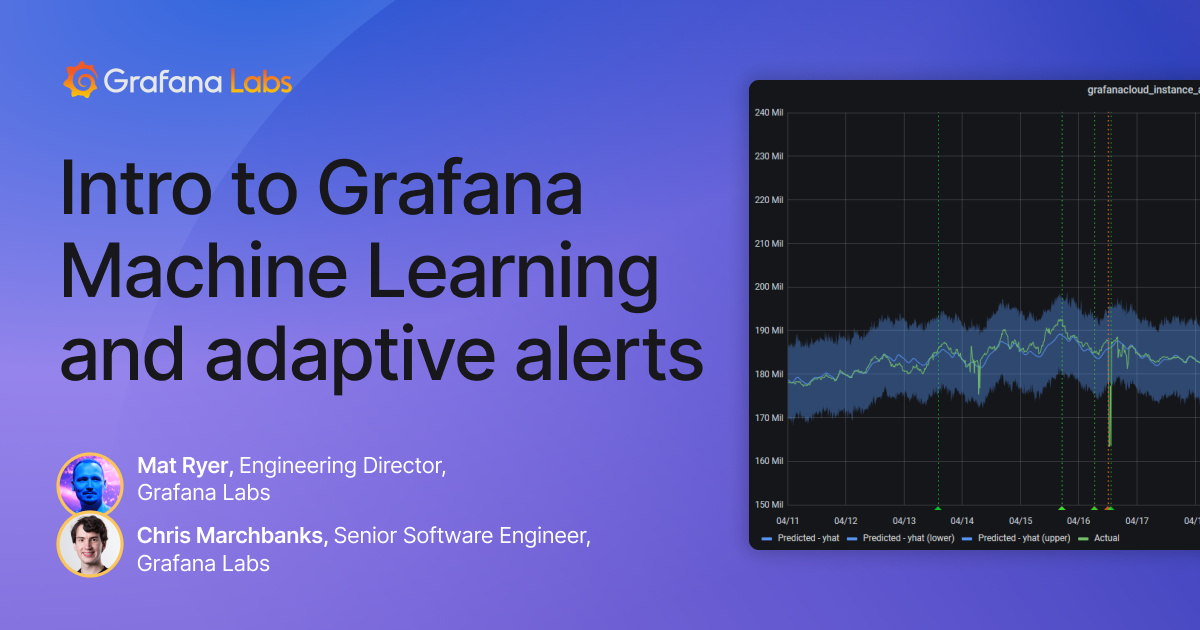
Intro to Grafana Machine Learning and adaptive alerts
Wednesday, December 15 | 9:30 PST, 12:30 EST, 17:30 UTC
Do you want to alert on when a key metric is too high or low but aren’t certain what the value should be? Do you struggle to maintain static thresholds for some of your alerts? Here’s where you can take a deep dive into Grafana Machine Learning, which was recently launched in Grafana Cloud to address problems like these.
Grafana Labs Director of Engineering Mat Ryer and Senior Software Engineer Chris Marchbanks on the machine learning team will walk you through the basics of how to use Grafana Machine Learning to create metric forecasts and configure alerts; how to query forecasts and visualize them in Grafana; and how to determine when this type of adaptive alerting is most effective in your organization.
Check out all of our webinars and on-demand conference videos for in-depth demos, deep dive discussions, helpful Q&As, and more!