
How to build performance tests into your CI pipeline with k6, GitHub Actions, and Grafana
Performance testing is an essential component of building fast and reliable web services. Until recently, this testing typically happened later in the development process and was often performed by a separate team or even a third party. But speed is the competitive advantage for companies, and prioritizing testing during the development process can speed time to market for new applications. Now, many companies are shifting left, incorporating performance testing much earlier in the development process and often within the development team itself.
The benefits of using CI pipelines for performance testing
In his recent talk at ObservabilityCon 2021, Vonage QA Architect Matthew Churcher demonstrated how he builds performance testing directly into the CI/CD pipeline with k6, GitHub Actions, and Grafana. “There’s an adage, ‘If there’s no test, then it’s broken,” said Churcher. “That applies to functional tests and equally to performance testing.”
Incorporating that performance testing directly into the CI pipeline doesn’t have to be painful or expensive, and it can actually save time in getting to the final build. “By testing earlier in your pipeline, you find bugs sooner. It’s been shown that bugs are cheaper and easier to repair if you find them sooner,” said Churcher.
When creating his setup, Churcher zeroed in on Grafana Labs’ open source load testing tool k6 due to its open source roots and high performance. Compared to other performance testing tools like Locust and hey, k6 delivered significantly higher requests per second (rps). It’s also well suited for containerization and official containers are available from the Docker repo. Combined with GitHub Actions for CI/CD and Grafana for visualizing his results, Churcher has a setup that allows him to run performance tests on every commit without breaking the bank or tying up all his engineers.
In his talk, Churcher showcased the architecture of his setup. He builds a sample app in his pipeline and deploys it to Kubernetes. He then deploys k6 to Kubernetes and uses Grafana Cloud to access his performance testing dashboard and look at results.

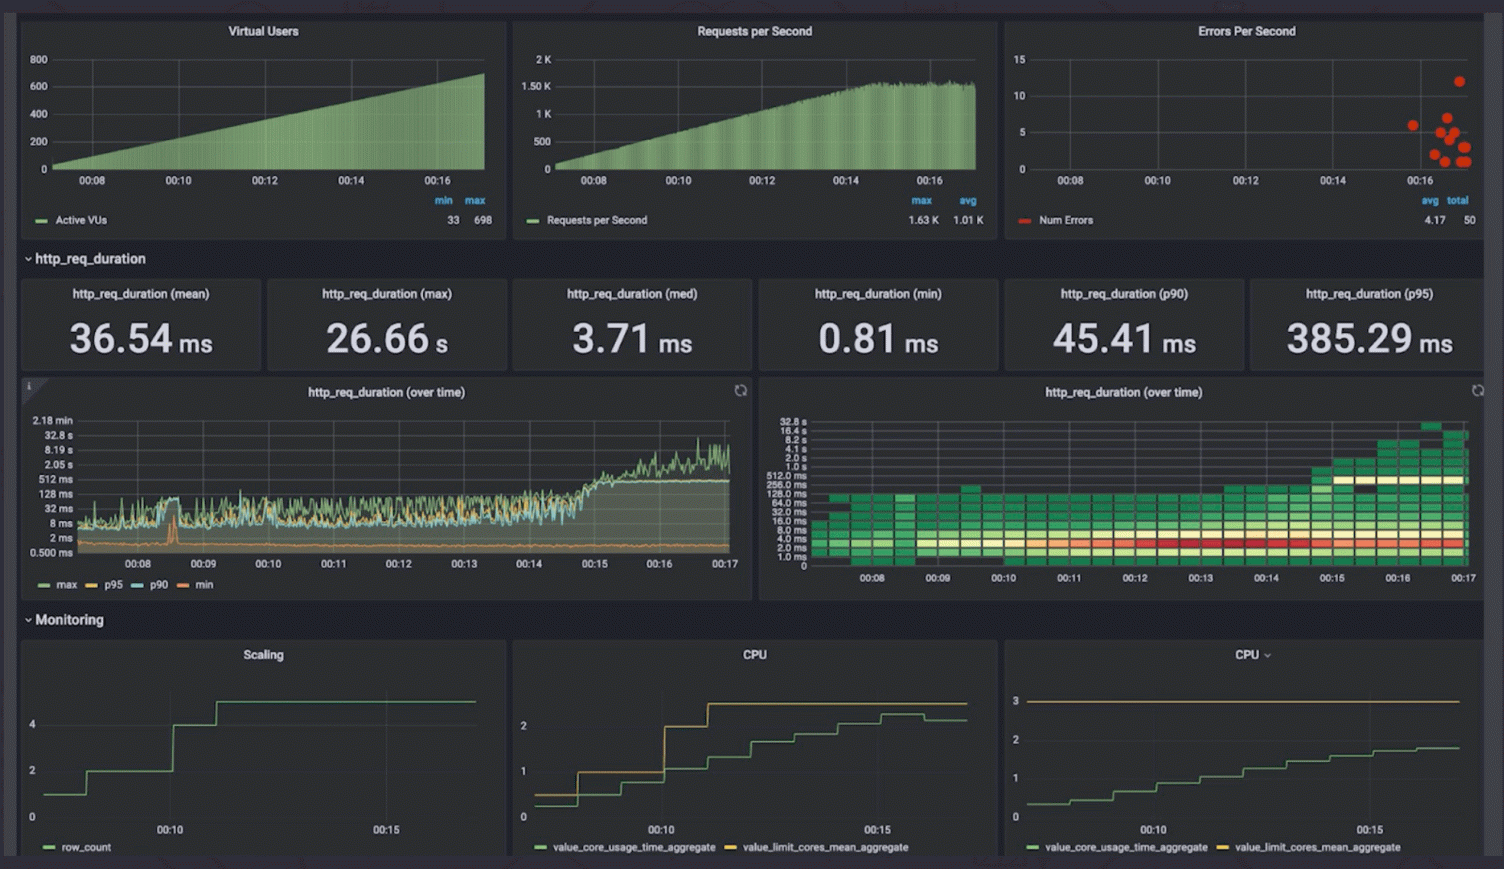
Above: A Grafana dashboard showcasing k6 performance testing results for a sample app.
The dashboards showcase useful metrics like active virtual users (displayed from multiple hosts), requests per second, and errors per second. It’s a handy overview of how the application is performing throughout the test. Churcher also has visuals that show trends over time so he can track how tests are improving. And he’s created a custom visualization using the graph plugin that shows trends by build number instead of by time.
Best practices for setting k6 thresholds
Churcher also shared a few best practices for setting up performance testing thresholds. “It’s important to set the correct thresholds,” he said. “You don’t want to fail a build for just a few things.”
Instead, you might use k6 thresholds to specify that you want 95% of requests to come in at a certain time. He also recommended not setting your desired latency as your threshold. “You’re going to want to be a little more flexible than that so you don’t take action too early,” said Churcher. Instead, you may want to work out your production acceptance criteria and make that your threshold.
“Please do try adding performance tests to your CI/CD pipeline,” Churcher said. He also shared free resources that can help you get started, including monitoring resources from Grafana, cloud metrics, and dashboards.
To learn more about performance testing best practices and to see how to visualize trends over time and trends by build, watch the full ObservabilityCON talk. All of the ObservabilityCON 2021 sessions are now available on demand.
The easiest way to get started with k6 is through Grafana Cloud k6. The free tier includes 500 virtual user hours/month for k6 testing and more. Sign up for free now!


