
k6 introduces browser automation and Prometheus support in k6 OSS
While there is a lot of focus on the three pillars of observability to provide insight into application performance in production, load testing is the other side of the observability story.
By using the open source load testing tool k6 — which Grafana Labs acquired earlier this year — developers can simulate real-world traffic to test the reliability and performance of software changes and new features, not to mention flag performance issues before impacting end users.
During ObservabilityCON 2021, the k6 team introduced two new key features that showcase the flexibility of the tool and how it can effectively improve application performance, reliability, and stability.

Introducing k6 browser automation
With the launch of the xk6-browser extension, the k6 team delivers the most requested feature within the community.
With xk6-browser, you can interact with the browser to test your web applications end-to-end while accessing all of the k6 core features, including protocol-level APIs and other k6 extensions.
From a test authoring and scripting perspective, this means that you can script in terms of user actions (such as navigations, mouse and keyboard actions, taking screenshots) rather than by making HTTP requests, WebSocket messages, etc. This has advantages, such as improving the developer experience in use cases where scripting using protocol-level APIs would be cumbersome, fragile, and difficult to maintain.
The xk6-browser API aims for rough compatibility with the Playwright API for NodeJS, adding browser automation via the Chrome Devtools Protocol (CDP).
xk6-browser also allows for mixing browser-level and protocol-level APIs. You can now simulate the bulk of traffic with protocol-level scenarios as usual, and at the same time, have a Virtual User interacting with your website or application using a real browser to collect frontend metrics (DOM content loaded, load, first contentful paint, etc.).
For the first time, there is a single tool for both protocol- and browser-level testing. No more refactoring. No more attempting to link two tools together. No more cross-training in multiple scripting languages. Now we can write one test suite, or even one script, and use it for both protocol- and browser-level testing.
To find out more about k6 browser automation, check out the documentation and GitHub repository.
k6 OSS launches Prometheus support
k6 OSS supports sending k6 metrics to multiple outputs such as InfluxDB, New Relic, StatsD, and more. But Prometheus has always been absent from that list, despite being the standard in cloud native monitoring.
Until now. Prometheus is now supported in k6 OSS with xk6-output-prometheus-remote, which finally allows you to store k6 metrics in Prometheus. Beyond Prometheus, any compatible remote-write solution can also be used with this output extension.
Visualizing k6 metrics with Grafana
Once you set up the Prometheus output extension, k6 OSS is directly compatible with Grafana Cloud and Grafana Enterprise Metrics.
There are up to 25 built-in metrics in k6 that each test run generates by default, like metrics for virtual users, iterations and their duration, and measurements for data flow:

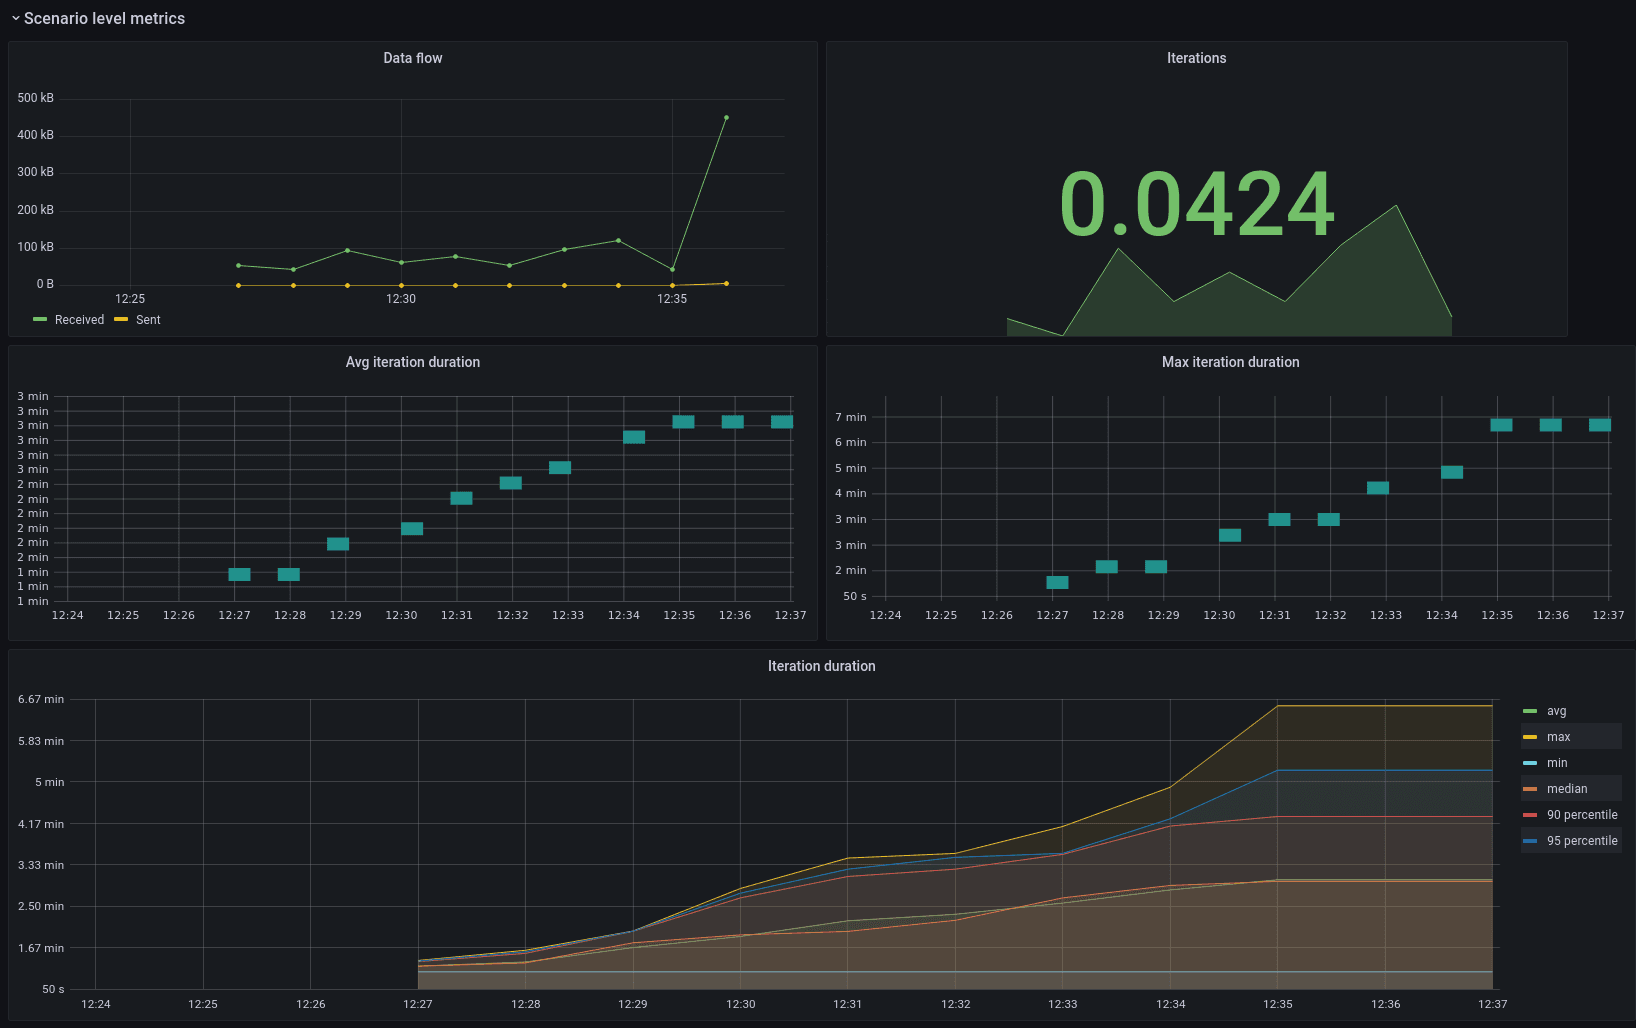
Most k6 metrics for duration are of the Trend metric type, and each consists of several values as can be seen for iteration duration above.
As HTTP is the most common protocol at the moment, there is quite a lot of basic data describing HTTP requests generated by k6. Depending on the use case and one’s imagination, it can be viewed with different visualizations and data thresholds, alerts, etc. Here are some examples of how RPS, response rate, total requests, and errors from a k6 test run can be represented in Grafana Cloud:

Since the Prometheus Remote Write extension gathers metrics with labels by default, there is also a quick way to add filtering by label values to a Grafana dashboard like this:

And now plots and tables can be filtered by URLs, scenarios and HTTP methods as well:

Feedback welcome!
What do you think about the xk6-output-prometheus-remote extension? And what about xk6-browser?
We are always looking for feedback, so we can better understand the needs of the community. Please share your ideas for improvements in the issues section on the GitHub repository, or find us on our community forum or Slack.
Or if you get stuck or have any questions for the team, please reach out to us on the k6 Forum, GitHub, or Slack.
The easiest way to get started with k6 is through Grafana Cloud k6. The free tier includes 500 virtual user hours/month for k6 testing and more. Sign up for free now!

