Visualizing IoT security metrics with Grafana at Network to Code
As the number of connected gadgets in our homes, offices, and industrial networks continues to grow exponentially, keeping IoT devices secure has become a vital part of our everyday lives. However, our webcams, printers, and smart plugs often lack security features due to their fast time to market, making them particularly vulnerable to attack. And because security metrics themselves can be tricky to assess, tracking IoT device security is increasingly a challenge.
This is a problem that Dr. Xenia Mountrouidou (who goes by Dr. X) thinks about extensively in her role as a Network Automation Engineer at Network to Code. As part of her job, Dr. X designs solutions for clients who are looking to automate network workflows using Python and Ansible. Those clients are keen to protect the IoT devices on their networks — and thus, IoT Spy was born.
“Security is a moving target”
IoT Spy is an open source tcpdump streaming solution for gathering and visualizing IoT security metrics. In her talk at ObservabilityCon 2021 titled “IoT spy: Security metrics for smart devices with Telegraf, InfluxDB, and Grafana,” Dr. X shared how the Grafana dashboards in her open source solution make it possible to visualize IoT security metrics in a completely new way.
Security metrics can be challenging to measure because they involve attempting to measure the unknown. “Security is a moving target, and it’s also a set of attributes. It’s not a single feature in our system,” said Dr. X.
To work around these challenges, she has identified a novel set of security metrics to track. IoT Spy visualizes data on the number of inbound connections, the number of outbound connections, the number of active services (open ports), and packet statistics for each IoT device. This gives monitoring teams a good indication of whether an IoT device is behaving normally, has been the victim of a security breach, or is undergoing attempted security breaches.
How IoT Spy works
Utilizing a Telgraf-Influx-Grafana (TIG) Stack, IoT Spy provides a complete setup for collecting tcpdump data, creating metadata based on MAC addresses, and outputting data to Influxdb. Then the security metrics are funneled into high-impact Grafana dashboards, which include probabilistic CDFs, histograms, time series graphs, and pivot tables.
All of these align to the exploratory data analysis framework that uncovers patterns, extracts important variables, and detects anomalies.
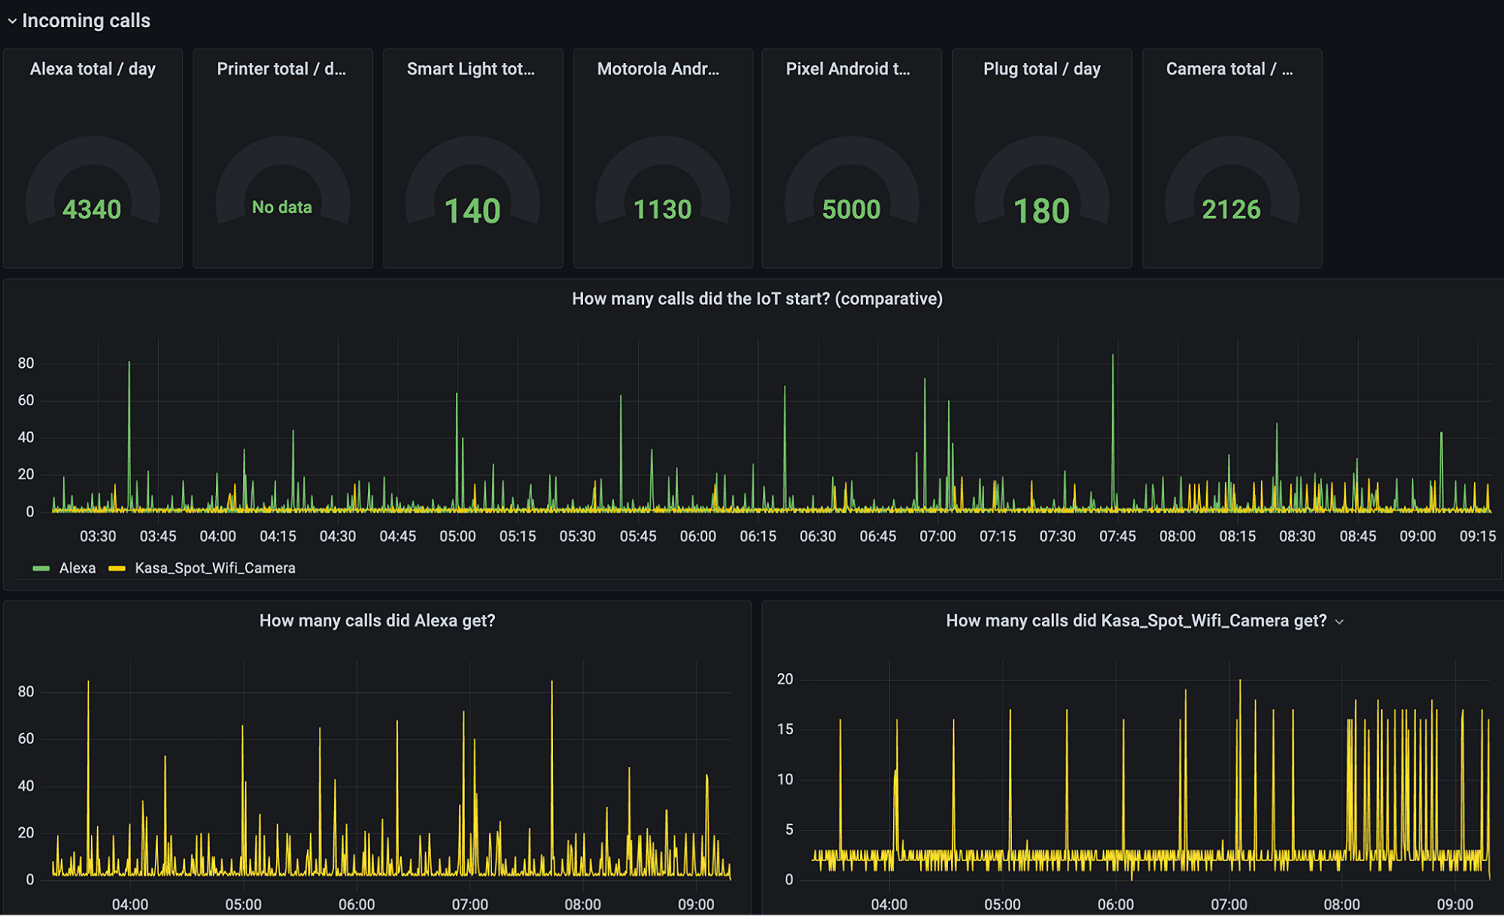
“The heart of the visualizations is the time series. Grafana can visualize really nicely those time series and show us patterns,” said Dr. X. “The tables can show variables that correspond to parts of the framework, and then the probability graphs are probability and distribution functions."
Using these visualizations, Dr. X can produce probability scores for each device indicating how likely it is that the device has been compromised.
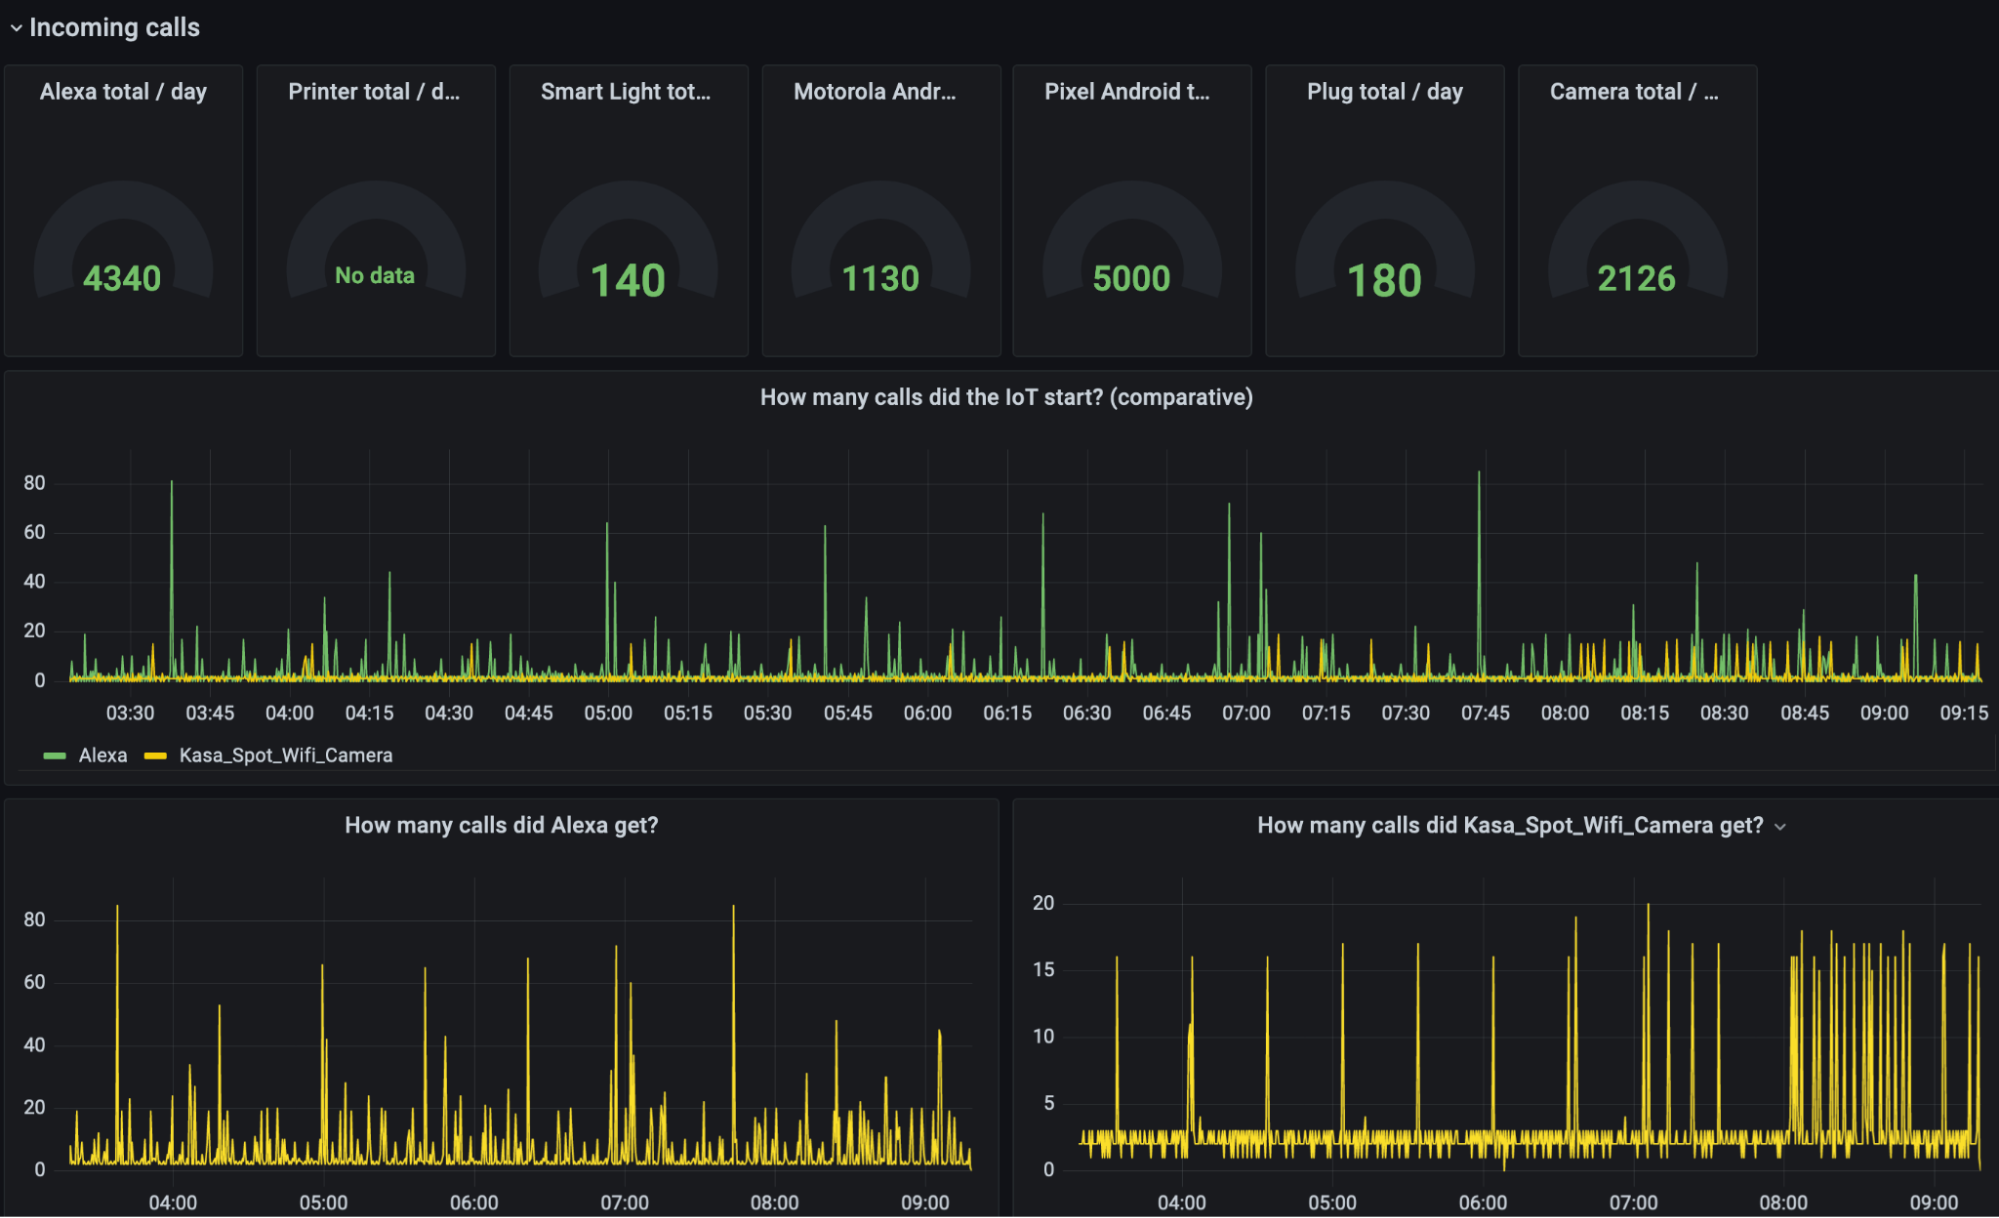
Above: A Grafana dashboard of incoming calls to IoT devices to quantify security risk.
In her talk, Dr. X shared a complete walkthrough of visualizations for the security data in her testbed, which has common IoT devices such as printers, phones, webcams, speakers, and smart lights.
Looking ahead, the Network to Code team will focus on using Z scores to show deviation from the mean and working on a generalized implementation to a Telegraf plugin — all in hopes to keep more smart devices safe and secure. Says Dr. X: “The future work will be about using better anomaly detection with these metrics."
Learn more about the IoT Spy project and check out all the Grafana dashboards Dr. X created to monitor connected device security by watching the full session. All our sessions from ObservabilityCON 2021 are now available on demand.