Introducing the AWS CloudWatch integration, Grafana Cloud's first fully managed integration
At Grafana Labs, we are continuing to build integrations that make it easier than ever to observe your systems, no matter which tools or software you choose.
Today, we’re excited to talk about the latest integration available in Grafana Cloud: the AWS CloudWatch metrics integration, the first of our fully managed integrations that makes it simple to connect and visualize your data in Grafana.
AWS CloudWatch: plugin vs. integration
AWS CloudWatch is a powerful tool to monitor the resources you have provisioned in the cloud and to help understand their usage, utilization, and performance. In fact, CloudWatch is such an important tool to monitor AWS services that it is already one of the most popular core Grafana data source plugins.
With the CloudWatch integration, you will now be able to quickly and easily export your AWS metrics into Grafana Cloud with just a few clicks.
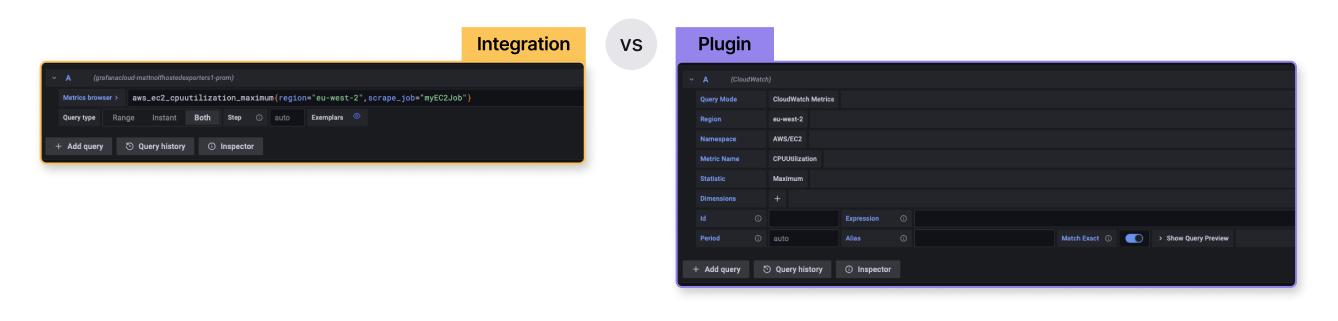
To understand whether the integration or plugin best fits your use case, it’s important to understand the differences:
- The plugin enables you to query both metrics and logs straight from the CloudWatch API, but it does not store any data so queries are always resolved by requesting from CloudWatch directly.
- The integration, on the other hand, leverages an open source exporter to continually pull CloudWatch metrics and store them in a Prometheus format for you to query later at no additional cost.
- As the integration stores your metrics in Prometheus format, querying them is done using the powerful Prometheus query language (PromQL) , enabling you to run familiar expressions such as `aws_ec2_cpuutilization_maximum{region=“eu-west-2”, scrape_job=”myEC2Job”}`. In contrast, the plugin provides its own querying interface for filtering metrics and logs, so there is no need to write your own query expressions.
With the CloudWatch metrics integration, there is no need to run the Grafana Agent or a specific exporter yourself. Instead, you only need to give Grafana access to scrape your CloudWatch metrics via AWS account delegation. (More on what this is and how to set it up below!) Along with storing your data, metric collection (scraping) is also taken care of, further reducing operational complexity.
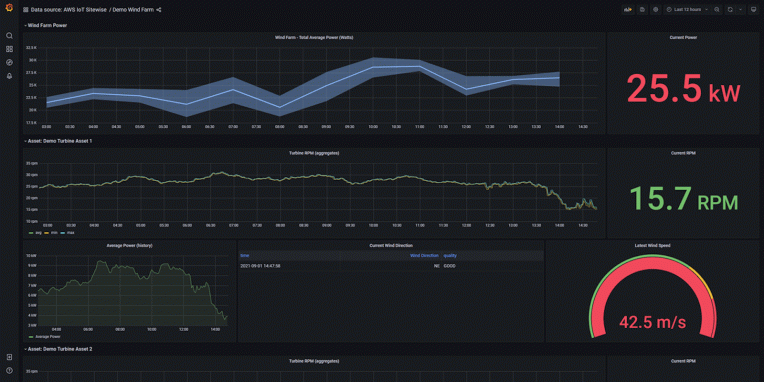
While exporting your metrics into Grafana Cloud is extremely useful in and of itself, it’s only half the story. As with all integrations, we’ve bundled a number of pre-built dashboards so once installed, you can jump straight into visualizing your services and telling your observability story.
Setting up the AWS CloudWatch integration
Let’s take a quick look at how the integration works with a step-by-step tour of the installation flow.
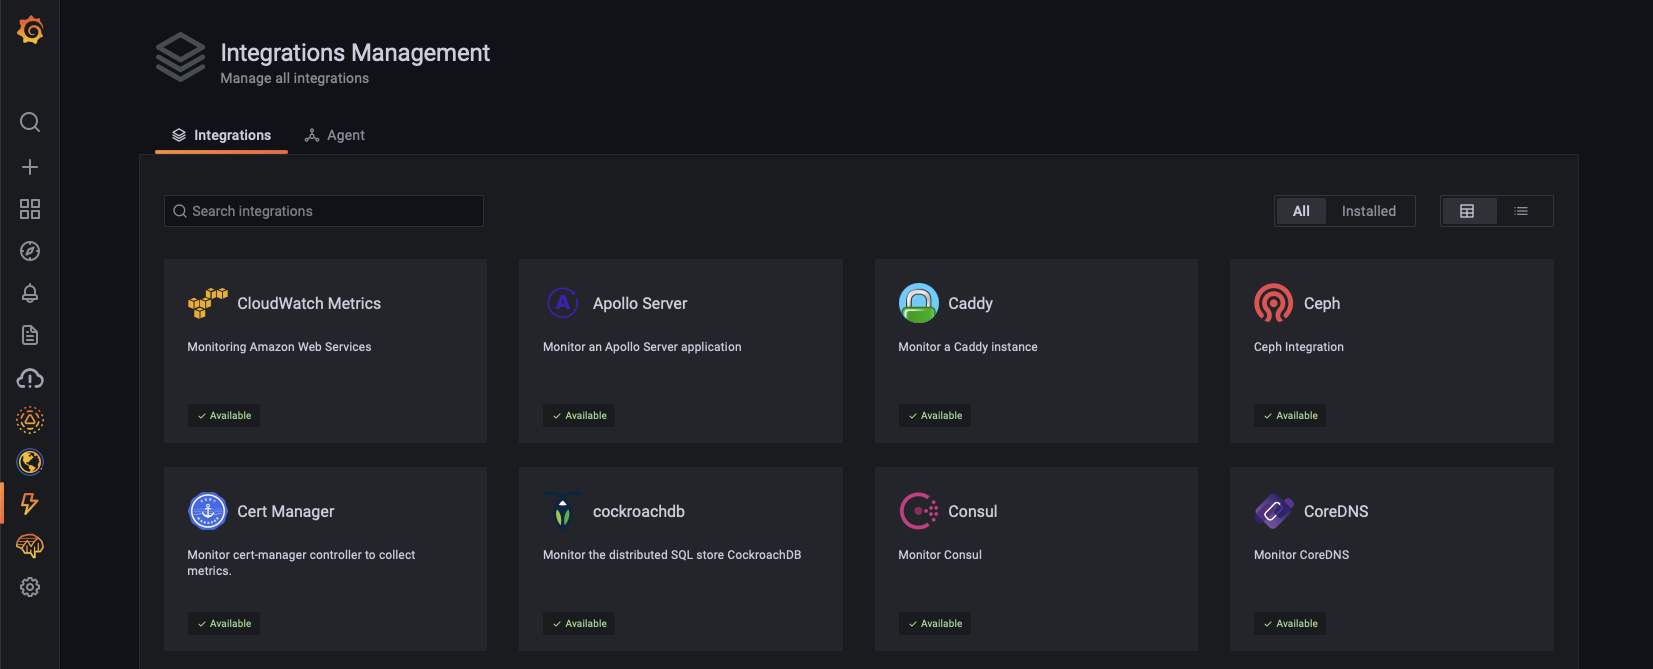
Navigate to the Integrations Management view from the onboarding menu within Grafana Cloud and select the CloudWatch Metrics integration.
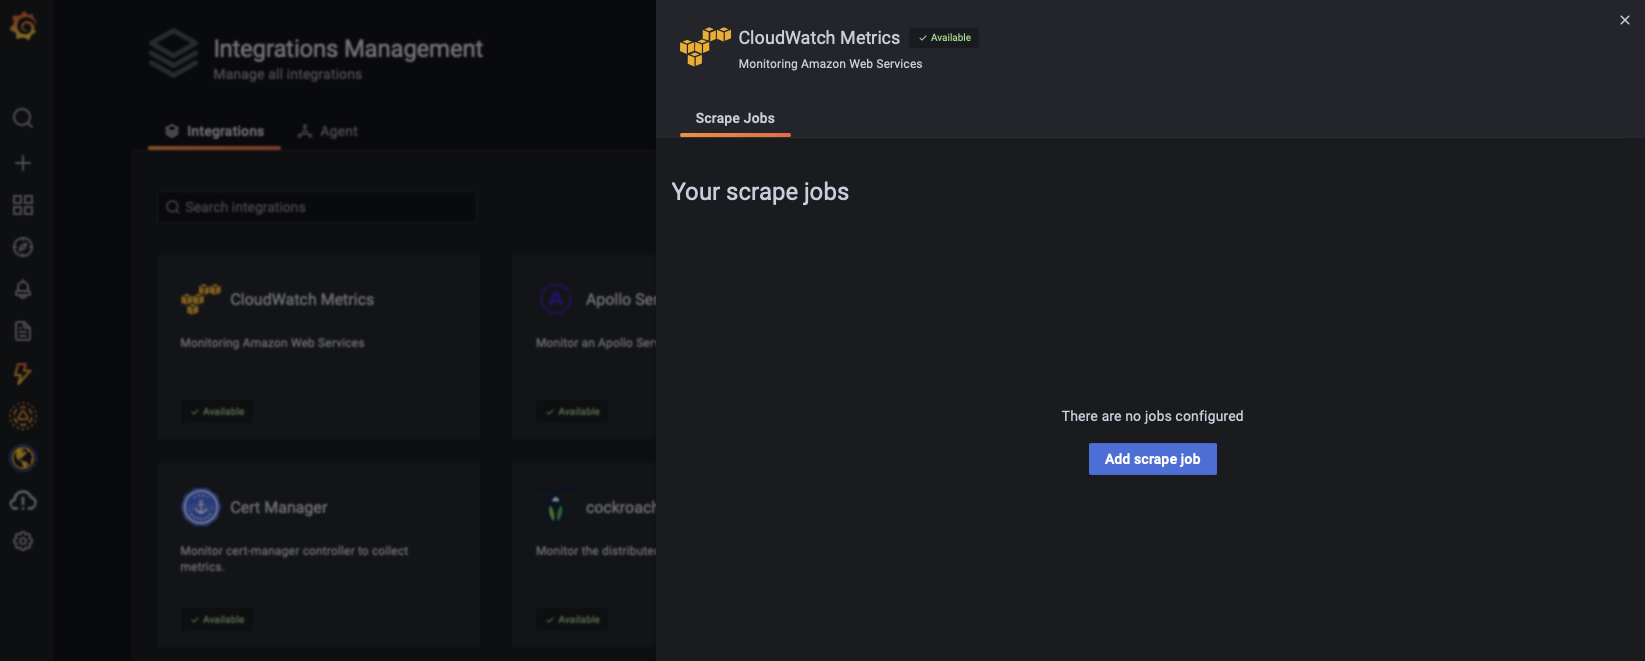
Within the integration, you can create any number of ‘jobs’ — sets of configuration dictating which services, regions, and AWS account to collect from. This enables you to logically split your data into specific jobs and scrape any number of AWS accounts to better organize your data.
As part of creating a job, Grafana needs to be granted access to the CloudWatch data available in your account. To do so, we leverage AWS Account delegation, which enables Grafana to assume a role that can access only your CloudWatch data without the need to share access and secret keys. (If you want to take a further look into how this works, check out this documentation.)
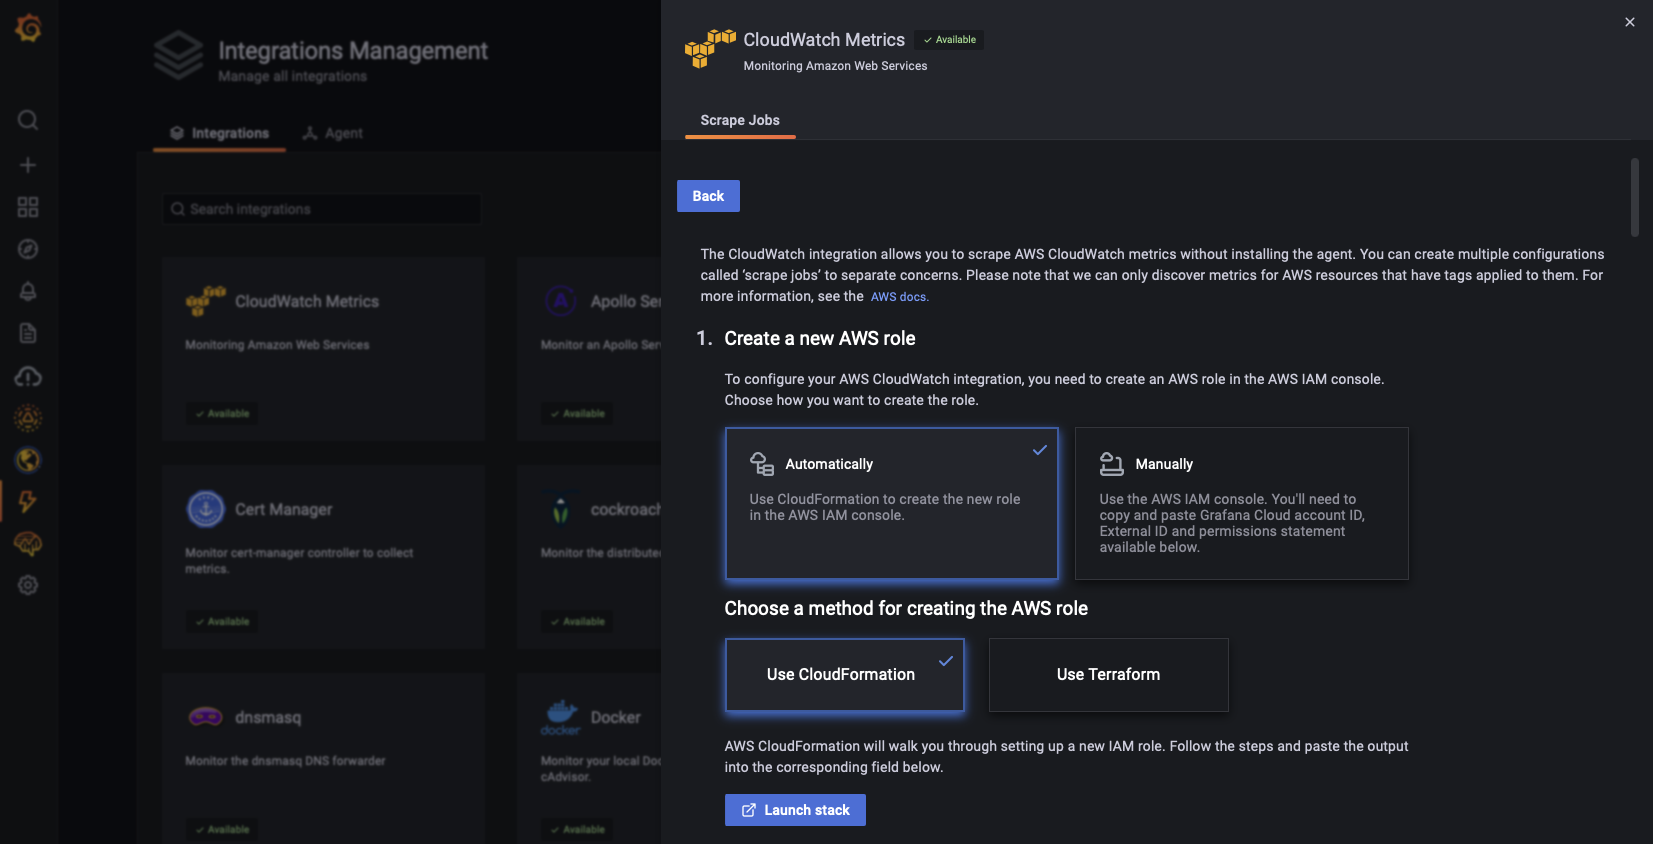
To set up the account delegation, you can leverage one of the provided infrastructure-as-code solutions: CloudFormation and Terraform. We recommend choosing the one that fits into your existing setup, as they not only automate the process but also enable you to keep track of the resources created. If, however, you do not wish to use CloudFormation or Terraform, simply choose ‘manually,’ which provides the details on how to configure account delegation manually.
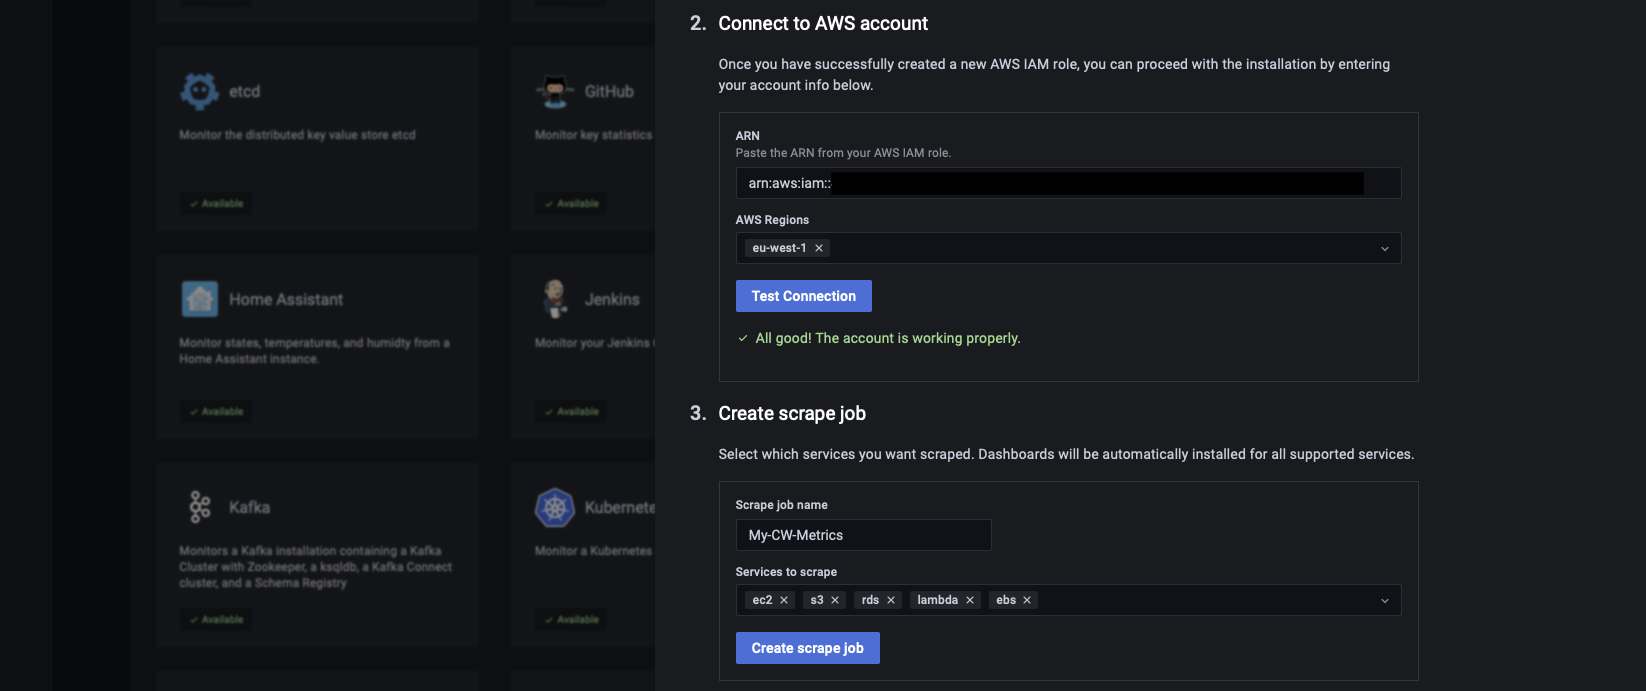
Once done, make sure to test the connection to ensure everything is configured correctly!
Give the job a name and choose from the available services to begin scraping. All resources of the selected services that are tagged will automatically be scraped using tag auto discovery.
Finally, click Create to submit the scrape job. At this point Grafana will now begin importing your CloudWatch metrics into Prometheus!
Observing AWS CloudWatch
Once you’re set up with a job, a number of dashboards will also be installed, allowing you to jump in and visualize your data being scraped.
EC2
Visualize your EC2 instances and quickly view key indicators such as CPU utilization, network traffic, disk performance, and system checks.

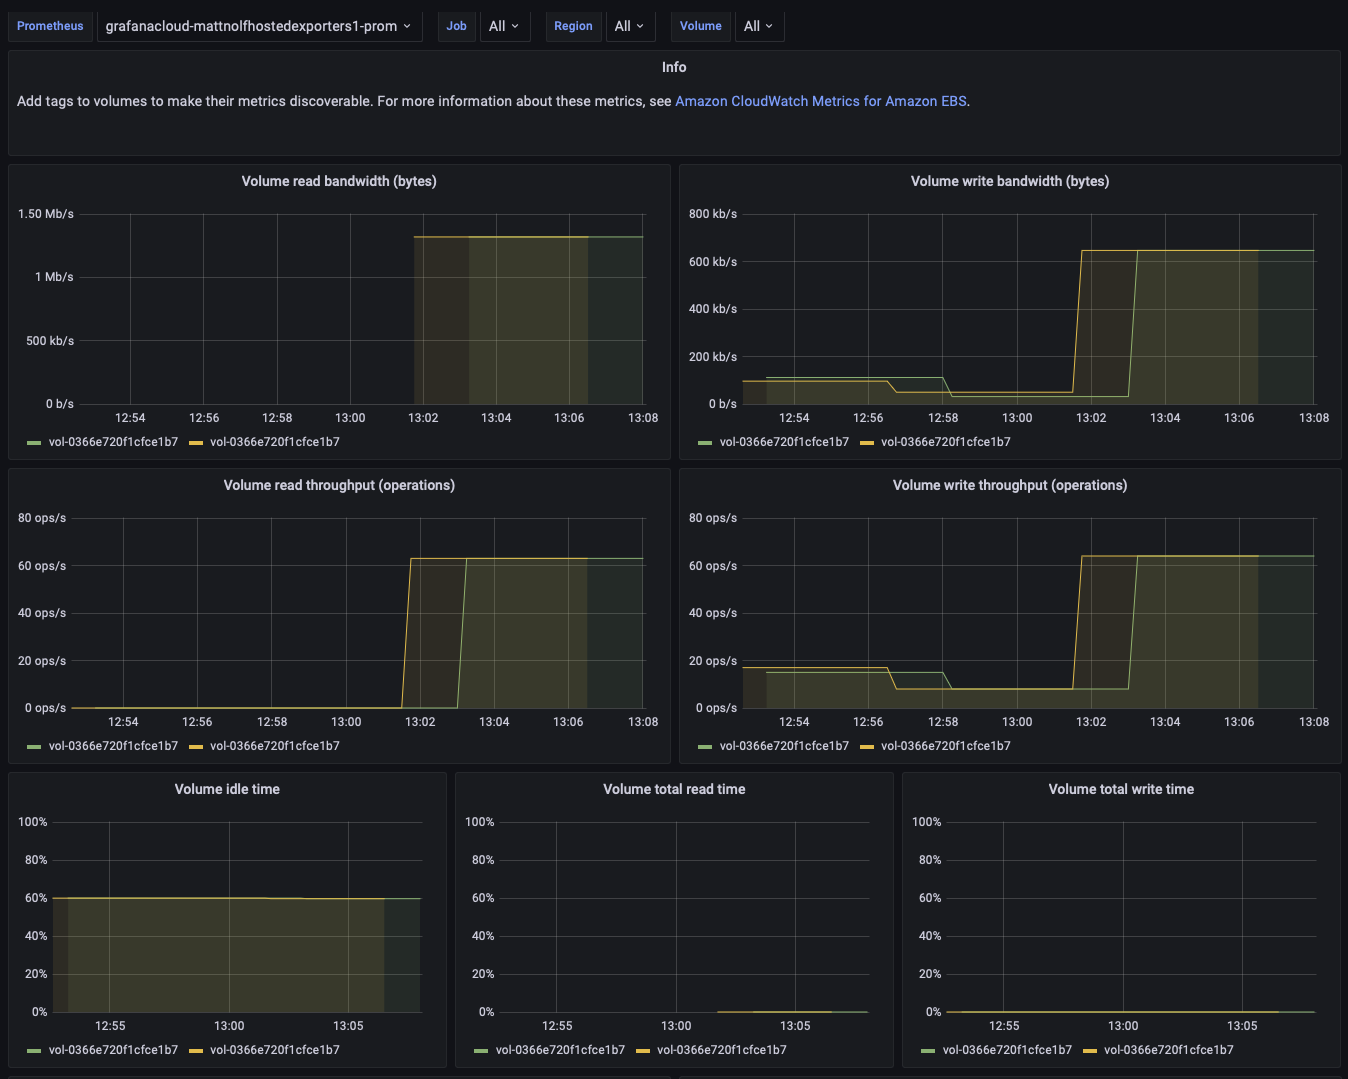
EBS
Monitor Elastic block storage volumes to quickly understand their throughput and bandwidth.
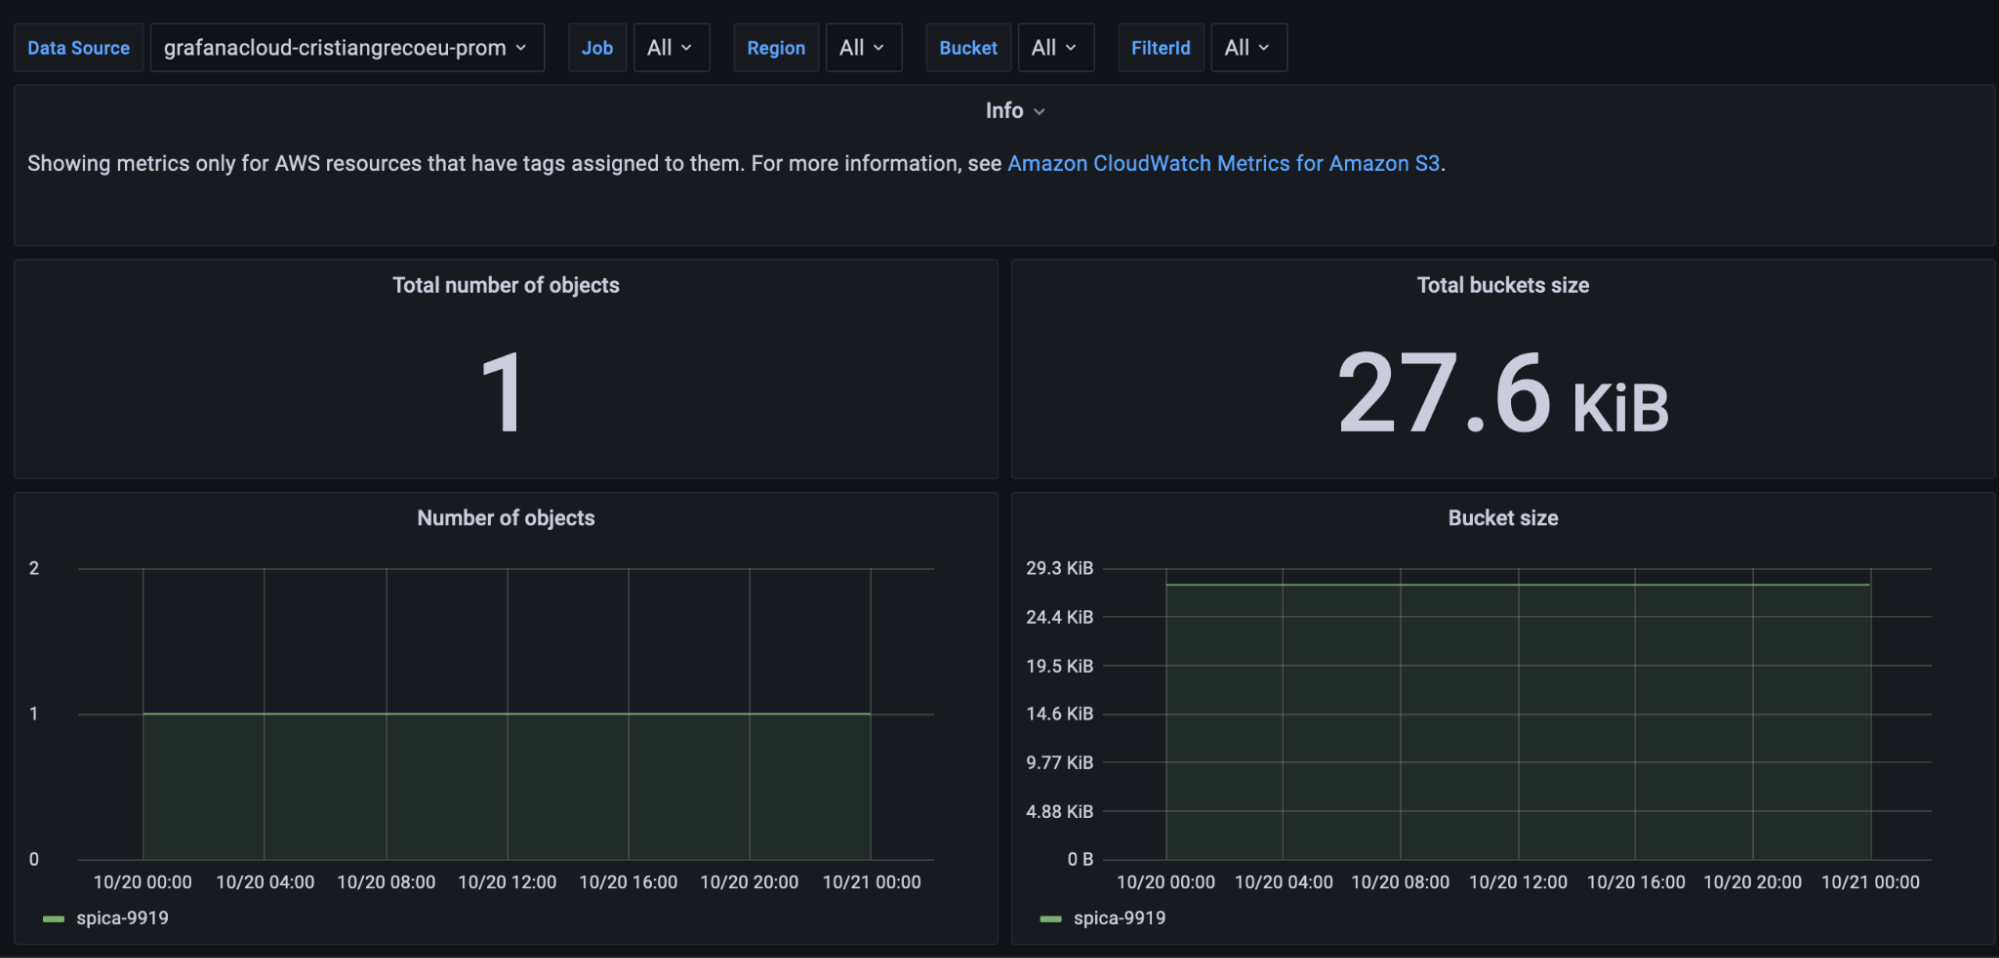
S3
The S3 dashboard enables you to monitor your object buckets, keeping track of their size, volume of data, and number of objects.
Here, you also have access to view request metrics such as latency and error rate.
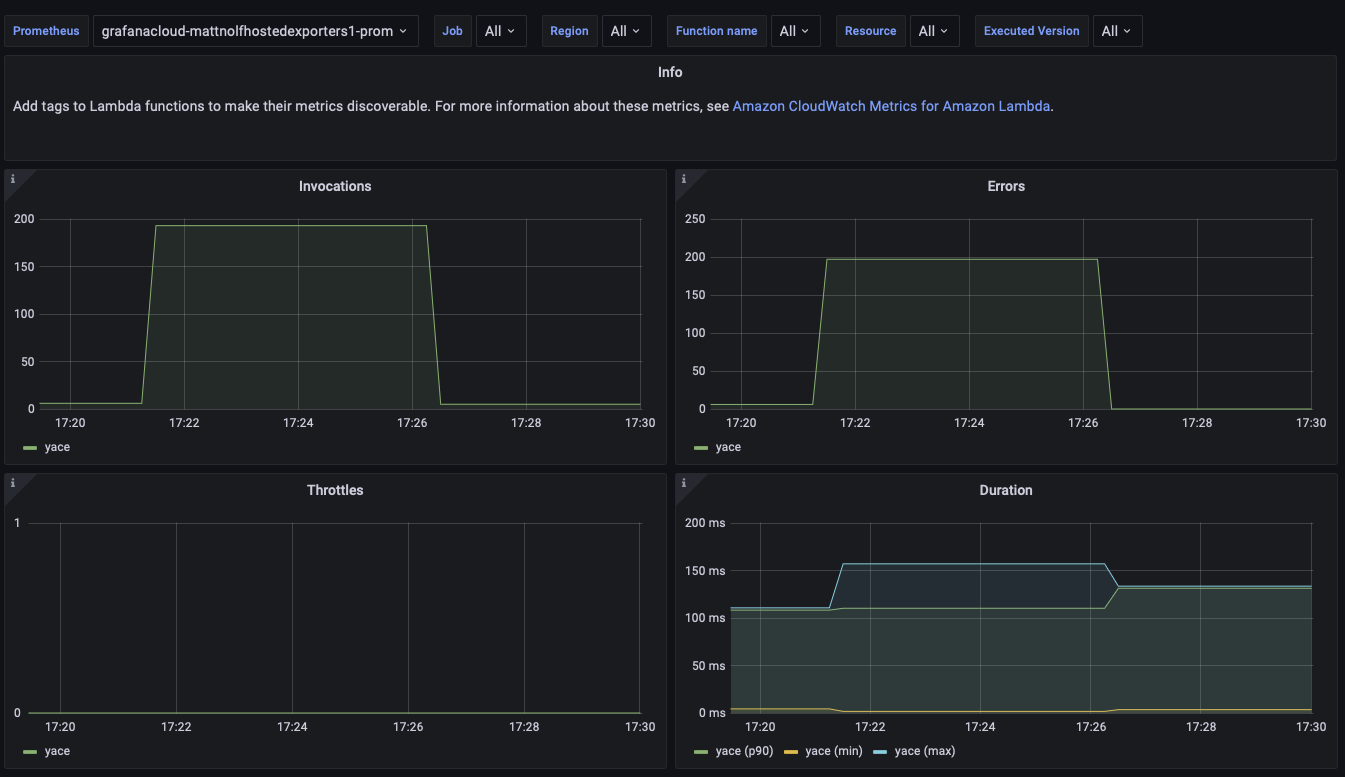
Lambda
Keep track of your Lambda functions by viewing key RED metrics — invocations, errors, and duration of requests.
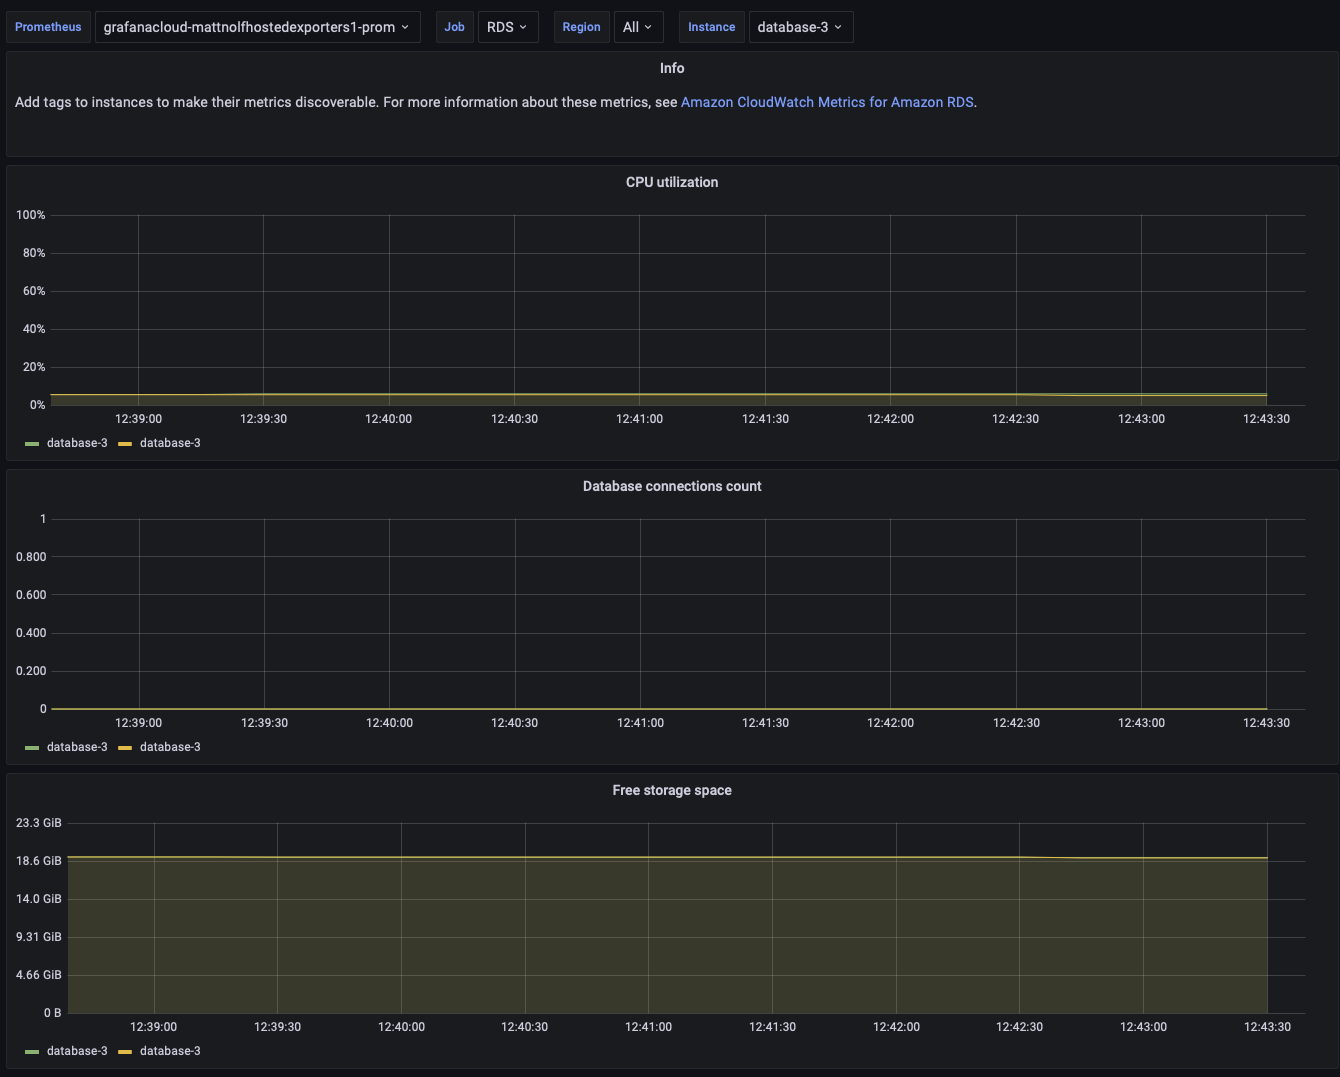
RDS
Monitor your RDS instance health by visualizing key indicators such as CPU utilization, connection count, as well as disk throughput, IOPS, and availability.
Conclusion
We hope you find these dashboards useful in order to monitor your AWS resources, but this is only the beginning! As the metrics are stored in your Prometheus instance, they are available to you so you can continue exploring, build further visualizations, and configure alerts to ensure you’re aware when something isn’t right.
We think this latest integration will make it even easier to monitor your AWS services without having to worry about additional operational complexity — and it’s all within a few easy steps.
For more details, check out our documentation or watch our ObservabilityCON 2021 session on Grafana’s 30+ integrations, which include AWS CloudWatch, Kubernetes, and Datadog.
Or take the AWS CloudWatch metrics integration for a spin yourself in Grafana Cloud, the easiest way to get started with metrics, logs, traces, and dashboards. (For a look at our generous forever-free tier and plans for every use case, sign up now!)
In the future, we’ll continue to add more AWS CloudWatch services and data types. In the meantime we’d love to hear your thoughts and feedback in the Grafana community slack at #integrations!