

What's new in Grafana Cloud for October 2021: Machine Learning, Grafana 8.2, new integrations, and more
Here at Grafana Labs, we’re constantly shipping new features to help our users get the most out of Grafana Cloud. To help our new and existing customers learn about the latest and greatest, here’s a roundup of all the new features and improvements you should know about to make the most of Grafana Cloud.
Get started with Grafana Cloud: If you’re not already familiar with it, Grafana Cloud is the easiest way to get started observing metrics (Prometheus and Graphite), logs (Grafana Loki), traces (Grafana Tempo), and dashboards. We have free and paid Grafana Cloud plans to suit every use case — you can sign up for free now.
New features now available in Grafana Cloud
Grafana Machine Learning
Earlier this month, we introduced Grafana Machine Learning, our new metrics forecasting capability that allows customers to run modern data science techniques on Grafana Cloud metrics. With Machine Learning, customers can visualize predictions and solve real-world problems such as:
Adaptive alerting — Alerts that follow the natural ebb and flow of your systems. Imagine, for example, a food delivery app that has lots of usage at lunch and dinner times, but it’s pretty quiet in the early hours of the morning. The same threshold doesn’t work well for both scenarios and could lead to missing incidents and/or noisy alerts. What if we could learn from our metrics in the past and create alerts that adapt to our data and context over time? Grafana Machine Learning lets you train a model to learn the patterns within your systems and use it to make confident predictions into the future.
Anomaly detection — Detect the unexpected. When you know what is likely to happen, you can infer when things fall outside of these expectations. Detecting anomalies early can let you get ahead of potential problems so they don’t take you by surprise.

Above: Grafana Machine Learning predicting the future. The green line is the actual data; the blue line represents the predicted values into the future. The shaded blue areas show the confidence levels of the model. As you can see, in this case it becomes less confident as time goes on.
Capacity planning — Automatically anticipate when you need to scale up and down. Most capacity planning is reactive; it spins up resources to meet demand. Having predictions into the future lets you plan ahead. This can be particularly useful if preparing the resources is expensive or takes a significant amount of time.
Grafana Machine Learning is available now to all customers on Pro or Advanced plans. You can read more about it in the announcement blog post or get started using the documentation.
Grafana 8.2 is here!
Grafana 8.2 marks the start of our work to bring Grafana closer to all users with a focus on increasing Grafana’s accessibility, part of our continuing mission to democratize metrics for everyone. There are a bunch of new and improved features you can read about in the announcement blog, but here are some of the highlights for Grafana Cloud customers:
We’ve continued to bolster the new, unified alerting system launched in Grafana 8.0. One of those key updates includes contact points.
Contact points allow customers to test an alert notification right from the contact points page. This feature makes it easier to configure Grafana 8.0 alerting and gives you the confidence in knowing that your contact points are working as expected before they fire.
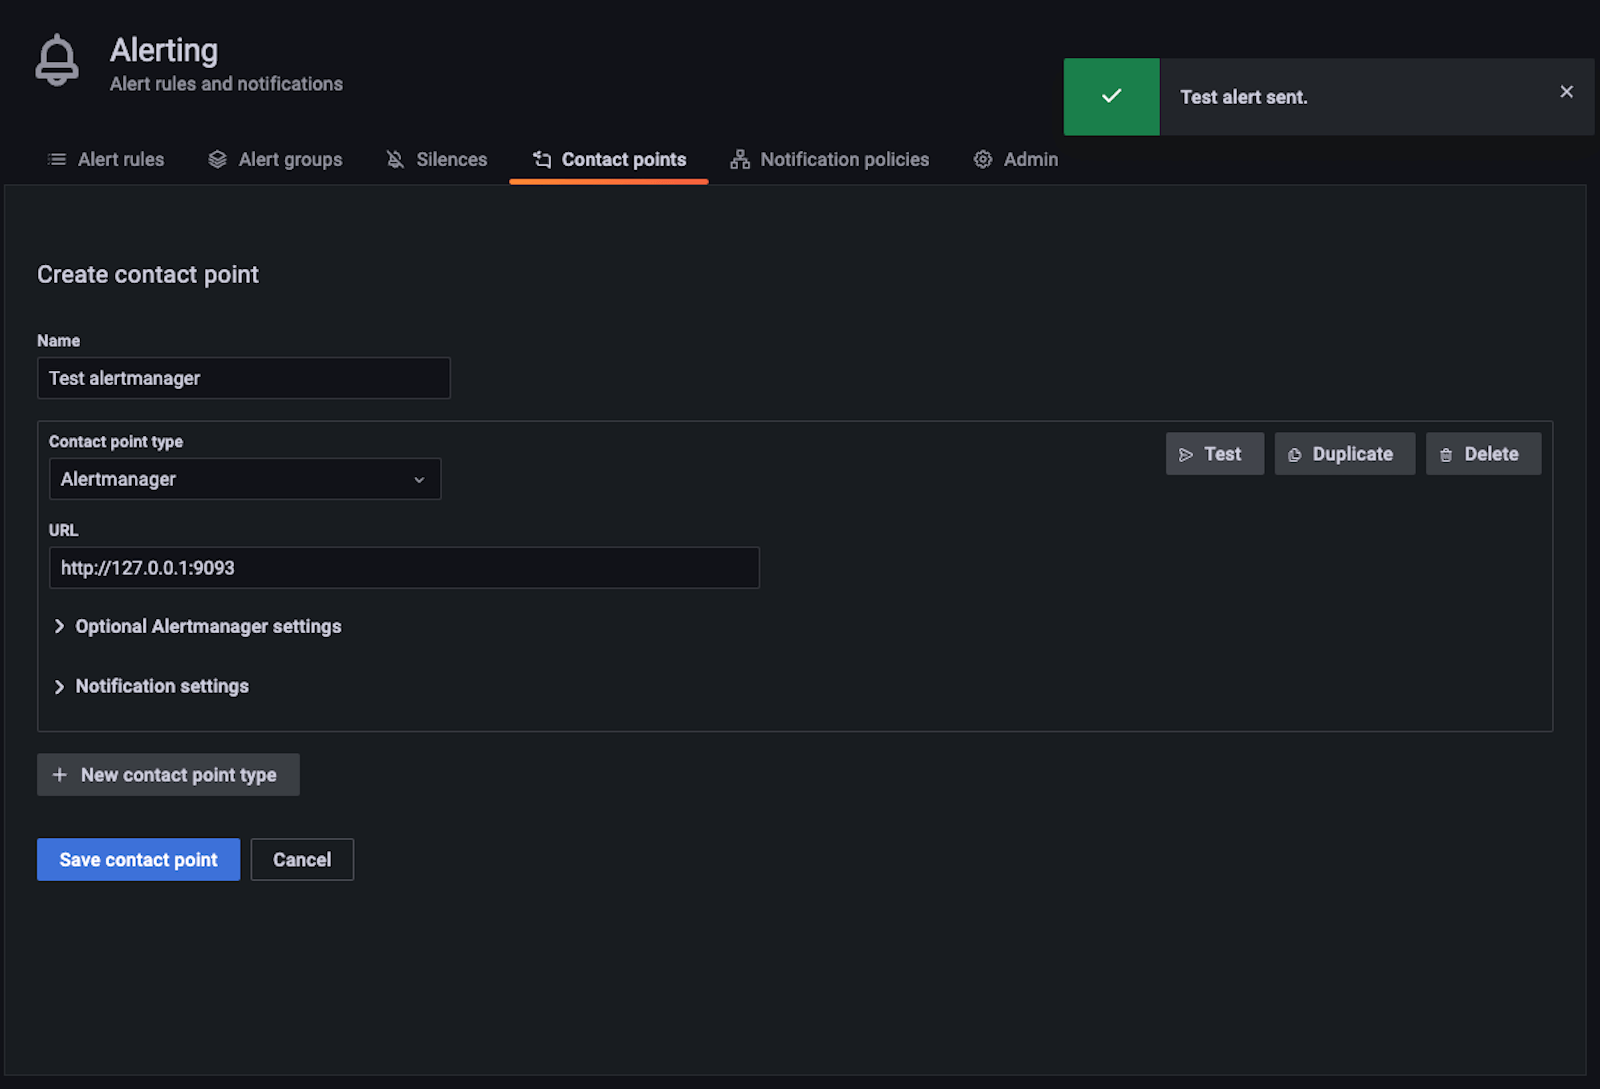
Contact point testing is available in Grafana Cloud. Users setting up a new Grafana Cloud instance will have access to the latest version of Grafana and this feature. More information on contact points and Grafana 8.0 alerting can be found in the official documentation.
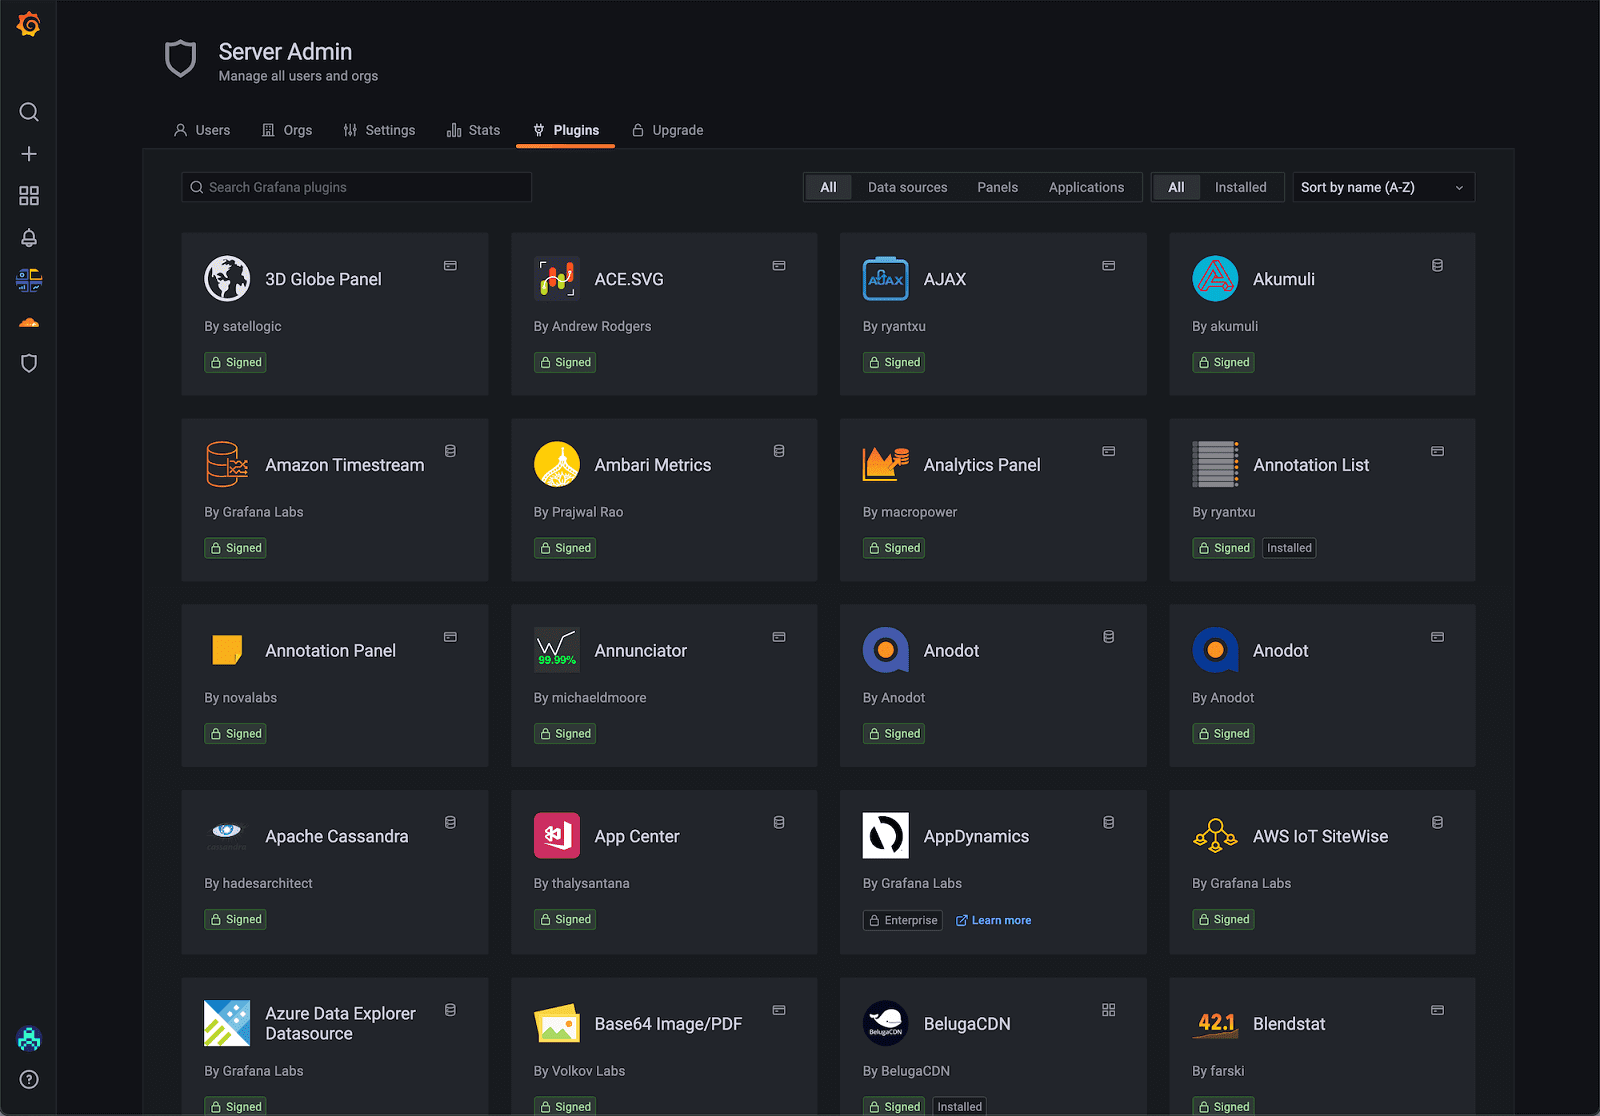
Another exciting feature included in Grafana 8.2 is the new plugin catalog, which is now on by default. You can use the plugin catalog to find, install, and uninstall your plugins directly from within Grafana without needing the Grafana CLI or to restart Grafana.
The biggest change to dashboards in Grafana 8.2 is the updated time picker which includes configurable fiscal quarters. This option enables fiscal quarters as time ranges, which can be helpful for business-focused and executive dashboards in addition to many other common use cases. Check out the time range controls documentation for configuration options.

Above: As the options for the time ranges have grown, we’ve also included a search for the quick time rangers to further speed up your workflows.
There have also been enhancements to Grafana’s image rendering that enables customers to generate JPEG and PDF images of panels and dashboards. The recent update includes additional metrics to the image renderer to help you diagnose its performance, and we have included guidance in our documentation to help you configure it for the best mix of performance and resource usage.

Above: By following this guidance, we were able to reduce image load time from a 95th percentile of up to 20 seconds to less than 5 seconds with 10 images rendered concurrently.
New Cloud integrations
The two latest integrations include out-of-the-box dashboards and alerts for:
- Ceph The Grafana Cloud Ceph integration includes alerts and a single, complete dashboard, which summarizes all the information of a Ceph cluster in a single glance.
- MongoDB This integration includes three different dashboards for monitoring a MongoDB cluster, a specific instance, and a ReplicaSet. It also ships with Prometheus alerts.
If you’re not already familiar, Cloud integrations include a curated set of default metrics, preconfigured Grafana dashboards, and alerts, all driven by the Grafana Agent deployed into your environment. As a result, Cloud integrations abstract away all of the work previously required to configure, install, connect, and maintain any services you wanted to monitor in Grafana. See our documentation on how to install and manage integrations to learn how to use integrations. And check out the list of currently available integrations.
Avoid dropped logs with Grafana Cloud Logs
Dropped log lines due to out-of-order timestamps are now a thing of the past! Allowing out-of-order writes has been one of the most-requested features, and we’re happy to announce that there is no longer a requirement to have log lines arrive in order by timestamp. Read more and see examples of this new feature in the announcement blog post.
Better interoperability between Datadog and Grafana Cloud
Datadog is a powerful product used by many teams, and we hear a lot from customers about how we should further embrace and support this critical data source — which is why we created the Datadog data source plugin a few years ago. Recently, our community and customers have asked us to provide a deeper interoperability with Datadog, offering an experience that is not limited by the Datadog API rate limits.
Which is why we recently introduced new capabilities in the plugin that allow you to:
- Send metrics from Datadog agents directly to Grafana Cloud, removing the need to rewrite instrumentation code. You can then query metrics stored in Grafana Cloud using the Datadog-style query language.
- Translate certain Datadog dashboards into Grafana dashboards, simplifying the process of bringing dashboards to Grafana Cloud for Datadog data source users.

Above: You can now explore and visualize your Datadog metrics in Grafana Cloud.
This feature is only available for customers using the Grafana Cloud Advanced tier with an Enterprise plugin license. Read more in start setting up your Datadog agents with Grafana Cloud.
ObservabilityCON 2021: Join us Nov 8-10
From Nov. 8 to 10, we’re bringing together observability experts from around the world for a special series of tech talks and exciting new product announcements during ObservabilityCON 2021. You won’t want to miss any of the sessions on observability-driven development, bridging Prometheus with legacy monitoring, IoT SecOps, plus the latest features and news from Grafana, Prometheus, Loki, and Tempo.
Here are some agenda highlights around Grafana Cloud and more:
- How TomTom is improving developer experience by building an observability-centric culture with Grafana Cloud
- Migrating from an in-house Graphite solution to Grafana Cloud
- Monitoring user workstations with Grafana Cloud and Prometheus
Register now for ObservabilityCON 2021. (It’s free!)
ICYMI: The latest resources to help you optimize Grafana Cloud
Tips and tricks:
- Video: Intro to monitoring Kubernetes with Grafana Cloud
- Intro to distributed tracing with Tempo, OpenTelemetry, and Grafana Cloud
Cool use cases:
- How Sitech builds modern industrial IoT monitoring solutions on Grafana Cloud
- How we use Grafana and Prometheus to monitor the traffic of our many GitHub repositories
Grafana Cloud is the easiest way to get started with metrics, logs, traces, and dashboards. We have a generous forever-free tier and plans for every use case. Sign up for free now!