
Grafana EMEA meetup recap: accessibility, k6 testing, and multi-DC observability stacks
On Oct. 5, we hosted the first Grafana Virtual Meetup for an EMEA-based audience.
Each Grafana meetup features “bite-sized” presentations from our user community and members of the Grafana Labs team. We want to provide opportunities (even virtually!) for members of our community to connect with one another and share what they’re working on or have learned.
If you’re interested in presenting at a future Grafana Meetup, be sure to fill out our guest speaker application with your talk idea!
With five talks covering a broad spectrum of topics from creating solutions to improve accessibility to bootstrapping multi-DC cloud native stacks, we had a jam-packed agenda for our Grafana EMEA Virtual Meetup. In case you missed it, here’s a recap of each session and an accompanying video. Let’s dive into what was discussed!
Making data accessible with sound
At Grafana we address accessibility both from a web standards perspective as well as in an attempt to find new and innovative ways to make software more accessible.
During an internal hackathon Kostas Pelelis, a Software Engineer at Grafana Labs living in Greece, and David Kaltschmidt, Director of Engineering at Grafana Labs based in Berlin, had a go at making data accessible by using sonification (sound) techniques.
They learned from a visually impaired astronomer, the wonderful Wanda Diaz Merced, that it was possible to use sonification to understand astronomical spectra. So they decided to turn Grafana’s time series into audio and add sound to Grafana’s alerting systems.
Next steps for the feature include identifying different metrics and assigning sounds to certain alerts. Although the project is in an “experimental stage,” and not yet merged, Kostas invites everyone to share their feedback: Join the #accessibility channel on the Grafana community Slack and let us know what you think!

Tales of A11y in Grafana OS: Introducing Pa11y CI into our pipeline
Alexa Vargas, a Software Engineer at Grafana Labs living in the Netherlands, shared how Grafana recently introduced Pa11y CI into the Grafana Continuous Integration pipeline.
Grafana is on a quest to make its GUI more accessible, following users’ requests. A study by WebAIM showed that 97.4% of the 1 million home pages they look at annually have detectable Web Content Accessibility Guidelines (WCAG) failures. These failures include low contrast text, missing ALT text, missing form input labels, and more. The keyword in this issue, however, is “detectable,” which means you can use automation to track these issues in your projects.
With Pa11y CI Grafana can:
- Collect accessibility metrics and send those to a Grafana CI metrics dashboard to track performance over time
- Prevent accessibility regressions from merging into the project by finding them early
For a demo, check out Alexa’s talk:

Testing with k6 + Grafana: Better together
Update: Grafana k6 load and performance testing is now available natively in Grafana Cloud. Existing k6 Cloud customers will not be impacted; they will be migrated to the new experience at a later date. Get started with Grafana Cloud k6 →
Nicole van der Hoeven is a Developer Advocate at k6, living in the Netherlands. k6 is one of the newest additions to the Grafana Labs family, bringing extensible testing to the open and composable Grafana observability stack.
Whereas Grafana brings observability, k6 provides the data. Nicole demonstrated how to use k6, how to write realistic load testing scripts, and how to integrate k6 with Grafana using the k6 data source plugin for Grafana or Prometheus Remote Write.
In a live demo, Nicole showed how to use the Command Line Interface (CLI) tool and made the case for using the power of the cloud (and the k6 Cloud SaaS solution) for large-scale tests and continuous testing.

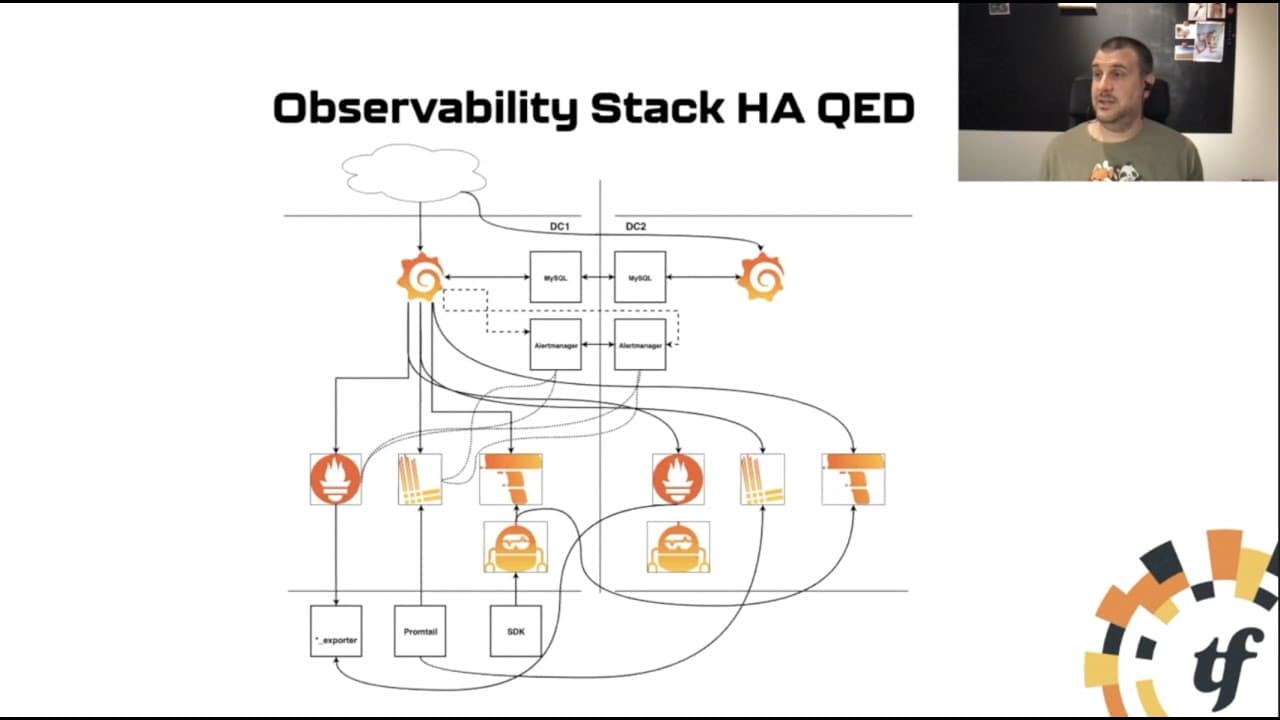
Bootstrapping a multi-DC cloud native observability stack
Bram Vogelaar spent the first part of his career as a molecular biologist, but then he moved on to supporting his peers by building tools and platforms for them with open source technologies. He now works as a DevOps Cloud Engineer at The Factory.
His presentation was an introduction to observability and how to set up a highly available monitoring platform, either across multiple data centers or on-prem.
Is multi-DC really a requirement? According to Bram it should be, and he referred to the OVH campus fire last March, which caused a huge outage.
Bram showed how to configure a monitoring setup across two data centers using Prometheus for metrics, Grafana Loki for logs, Grafana Tempo for traces, Prometheus’s Alertmanager, Grafana, and HashiCorp Consul.
Using Thanos to gain a unified way to query over multiple clusters
Wiard van Rij is a “Buzzword Engineer” at Fullstaq helping people, teams, and organizations facing various cloud-native challenges with a strong focus on Kubernetes and observability. Wiard is also a Thanos team member.
Wiard showed how you can aggregate results across clusters, even if those use different stacks, by introducing an “observee” / monitoring cluster running Grafana as per centralized endpoints for the different Prometheis (not a typo, as we learned during the meetup) to connect to. That way you have one place to query instead of “chasing the GUI.”
Thanos, among other things, is well-suited for global query view or scaling your Prometheus/Prometheis setup by enabling querying of your Prometheus metrics across multiple servers and clusters. Wiard also highlights the “unlimited retention” Thanos offers.
Thanos.io contains a lot of documentation to get you started with the project. Wiard is also active on the Grafana community Slack and available for any questions you may have after watching his presentation.

We’ll be back for another EMEA edition of the Grafana Virtual Meetup on Wednesday, Dec. 8. Until then, you can find more events, webinars, and workshops via grafana.com/about/events or on Meetup.com.

