How Lightbend uses Grafana Cloud to monitor a platform-as-a-service launch
When top companies have needed platforms for their demanding, globally distributed, cloud native application environments and streaming data pipelines, they’ve turned to Akka, the most popular implementation of the Actor Model for cloud native applications running on Kubernetes.
The company behind Akka is Lightbend, a leader in the world of cloud native applications and architectures. In June 2021, Lightbend announced the Open Beta of Akka Serverless (General Availability, November 2021), a new class of cloud native development platform-as-a-service.
With Akka Serverless, Lightbend co-locates “state” and functions, meaning that the data a function needs is delivered to the function when that data is needed. “We run those functions without knowing what they do or anything about their logic,” says the company’s Lead Site Reliability Engineer, Fernando Costa. “Observability gives us better understanding from the outside.”
Thanks to Grafana Cloud, Lightbend can stay on top of all of their customers’ functions without checking on them at every moment; have quicker response times to meet SLAs and SLOs; and they can see if something is wrong even before the customer notices.
Key dashboards
In some cases, using a Grafana dashboard saves a Lightbend support team member at least 20 to 30 minutes every time there’s an issue. Regular go-tos include a dashboard for operations (showing all production deployments, all containers, and everything that’s running) and one for synthetic monitoring (a key feature of Grafana Cloud).
Here are two of the company’s other key dashboards:
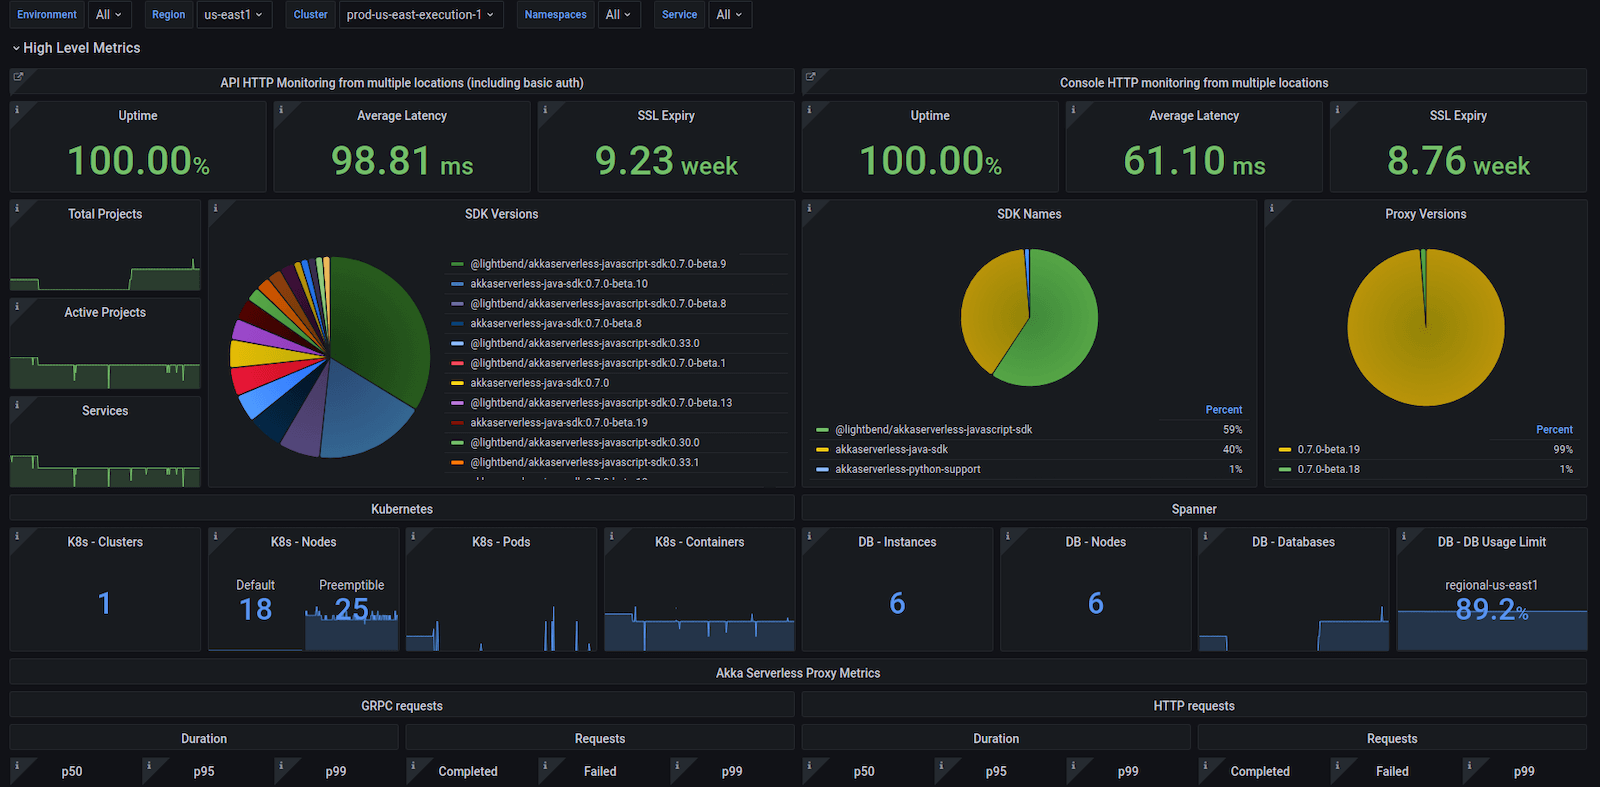
Akka Serverless general metrics
One of Costa’s favorite dashboards is used to monitor high-level metrics. Panels on the dashboard include total projects, active projects, services running on Akka Serverless, gRPC requests, commands, trends, and alerts. This data is shared daily across the company. “It’s pretty much all of the numbers from the past 24 hours,” he explains.
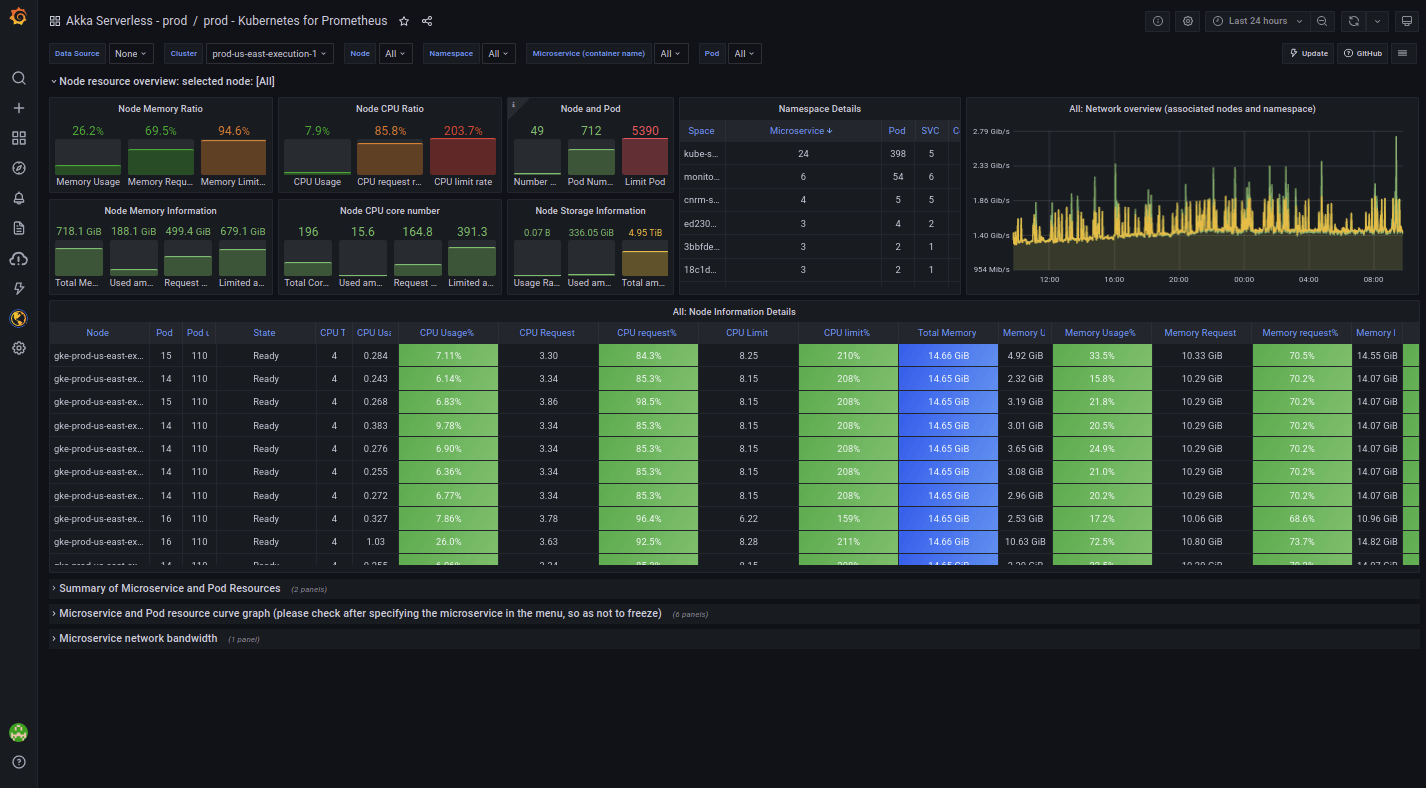
Kubernetes dashboard
This helps Lightbend fully visualize its Kubernetes clusters from top to bottom. They can all be checked at once for a generic view, or it’s possible to select specific clusters by name, region, type, and other filters. “It allows us to observe all kinds of resource consumption,” Costa says.
Looking forward
Costa is hopeful that in the future, Lightbend can begin using Loki (and Grafana Cloud Logs) so he can seamlessly correlate metrics and logs.
As he thinks about the way he relies on Grafana at Lightbend, he marvels at the way advances in technology have changed monitoring and observability over the years. “It’s amazing to see how with observability and automation, we can manage thousands of servers and thousands of applications.”
To find out more about Lightbend’s Grafana-based monitoring and see more of the company’s dashboards, check out their full success story here.
The easiest way to get started with Grafana, Prometheus, Loki for logging, and Tempo for tracing is Grafana Cloud, and we’ve recently added a new free plan and upgraded our paid plans. If you’re not already using Grafana Cloud, sign up today for free and see which plan meets your use case.