What's new in Grafana Cloud for September 2021: New panels, query caching, synthetic monitoring updates, and more
Here at Grafana, we’re constantly shipping new features to help our users get the most out of Grafana Cloud. Over the last few months, we’ve made it even easier to get started with out-of-the-box dashboards and new visualizations in Grafana Cloud. We also introduced capabilities like query caching, a “prettify JSON” option and commands for cortex-tools to make your data, dashboards, and queries more efficient. Finally we’ve added new ways to customize your Grafana Cloud experience with improved reporting, synthetic monitoring and more.
Get started with Grafana Cloud: If you’re not already familiar with it, Grafana Cloud is the easiest way to get started observing metrics (Prometheus and Graphite), logs (Grafana Loki), traces (Grafana Tempo), and dashboards. We have free and paid Grafana Cloud plans to suit every use case — you can sign up for free now.
Grafana 8.1: More visualizations and new ways to explore your logs and traces in Grafana Cloud
We are excited to announce that Grafana 8.1 is now available in Grafana Cloud and includes some pretty unique new visualizations like:
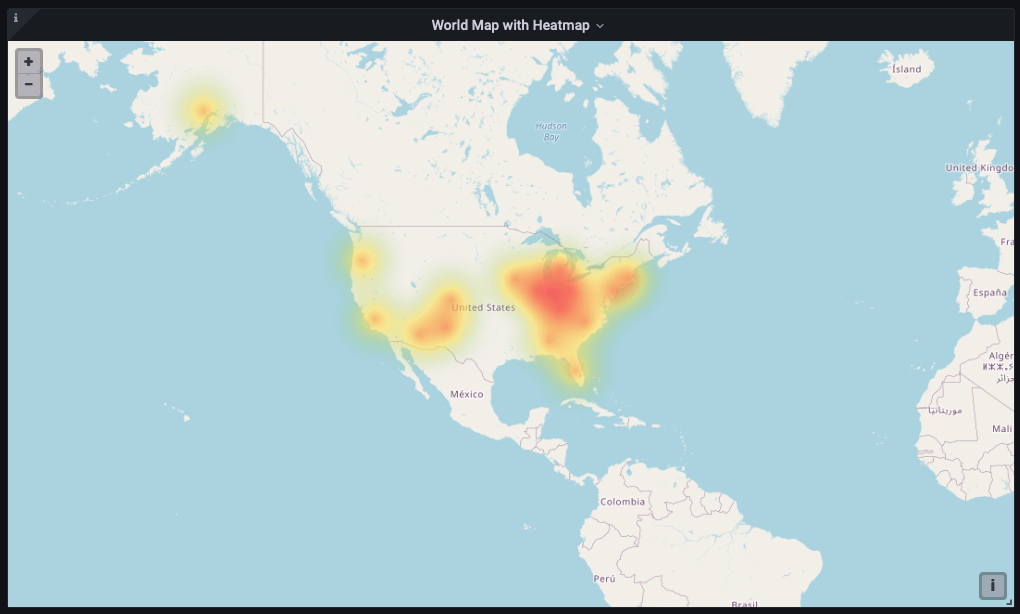
Geomap panel
With the Geomap panel, you can view and customize the world map using geospatial data. You can also easily configure various overlay styles and map view settings to focus on the important location-based characteristics of the data.
Learn more:
- See the docs to start using the Geomap panel
- Read the blog
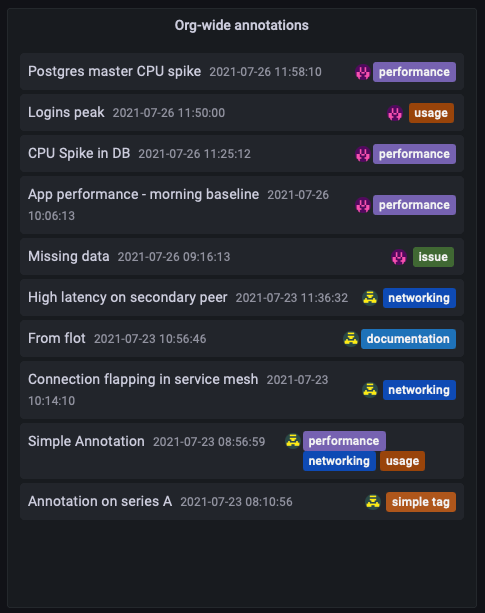
Annotations panel
This new panel allows you to list annotations, as well as query annotations by tag. You can even live filter by tag in the panel itself.
Learn more:
- See the docs to start using the annotations panel
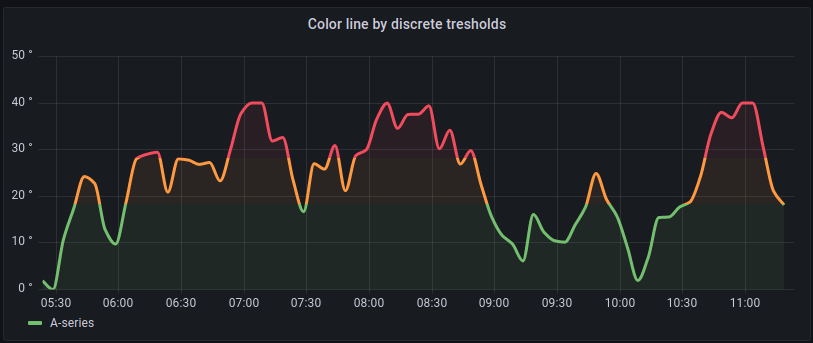
Improvements to the Time series panel
The Time series panel has been updated with the ability to color a series or line by thresholds or gradient color scales, making it easier to view the changes across thresholds at a glance.
Learn more:
- See the docs to start using the improved Time Series panel
- Read the blog
Prettify JSON for logs in Explore
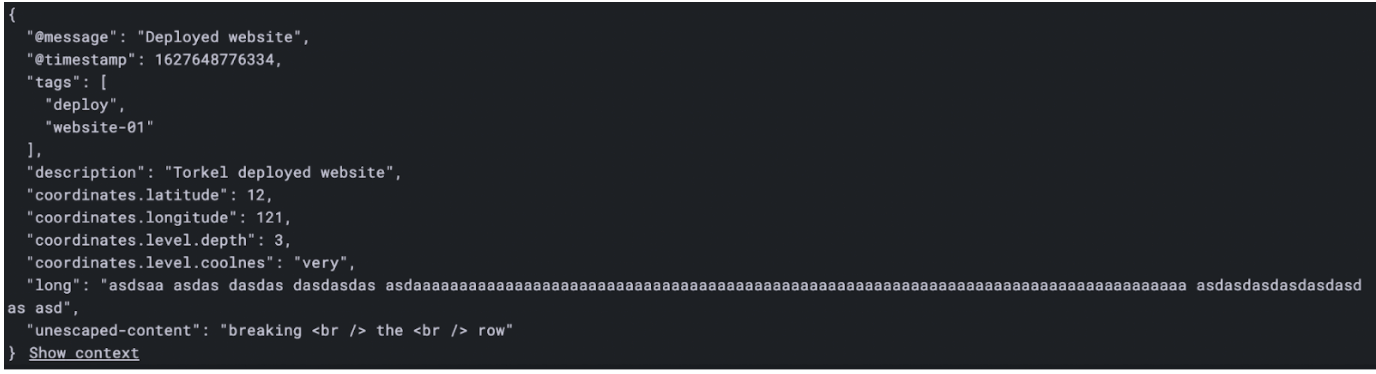
Grafana 8.1 also includes changes beyond visualizations. The new “prettify JSON” option makes it easier to view, review, and find relevant data in JSON format logs when you’re exploring your data.
This is a regular JSON log.

And here is the prettified JSON log.
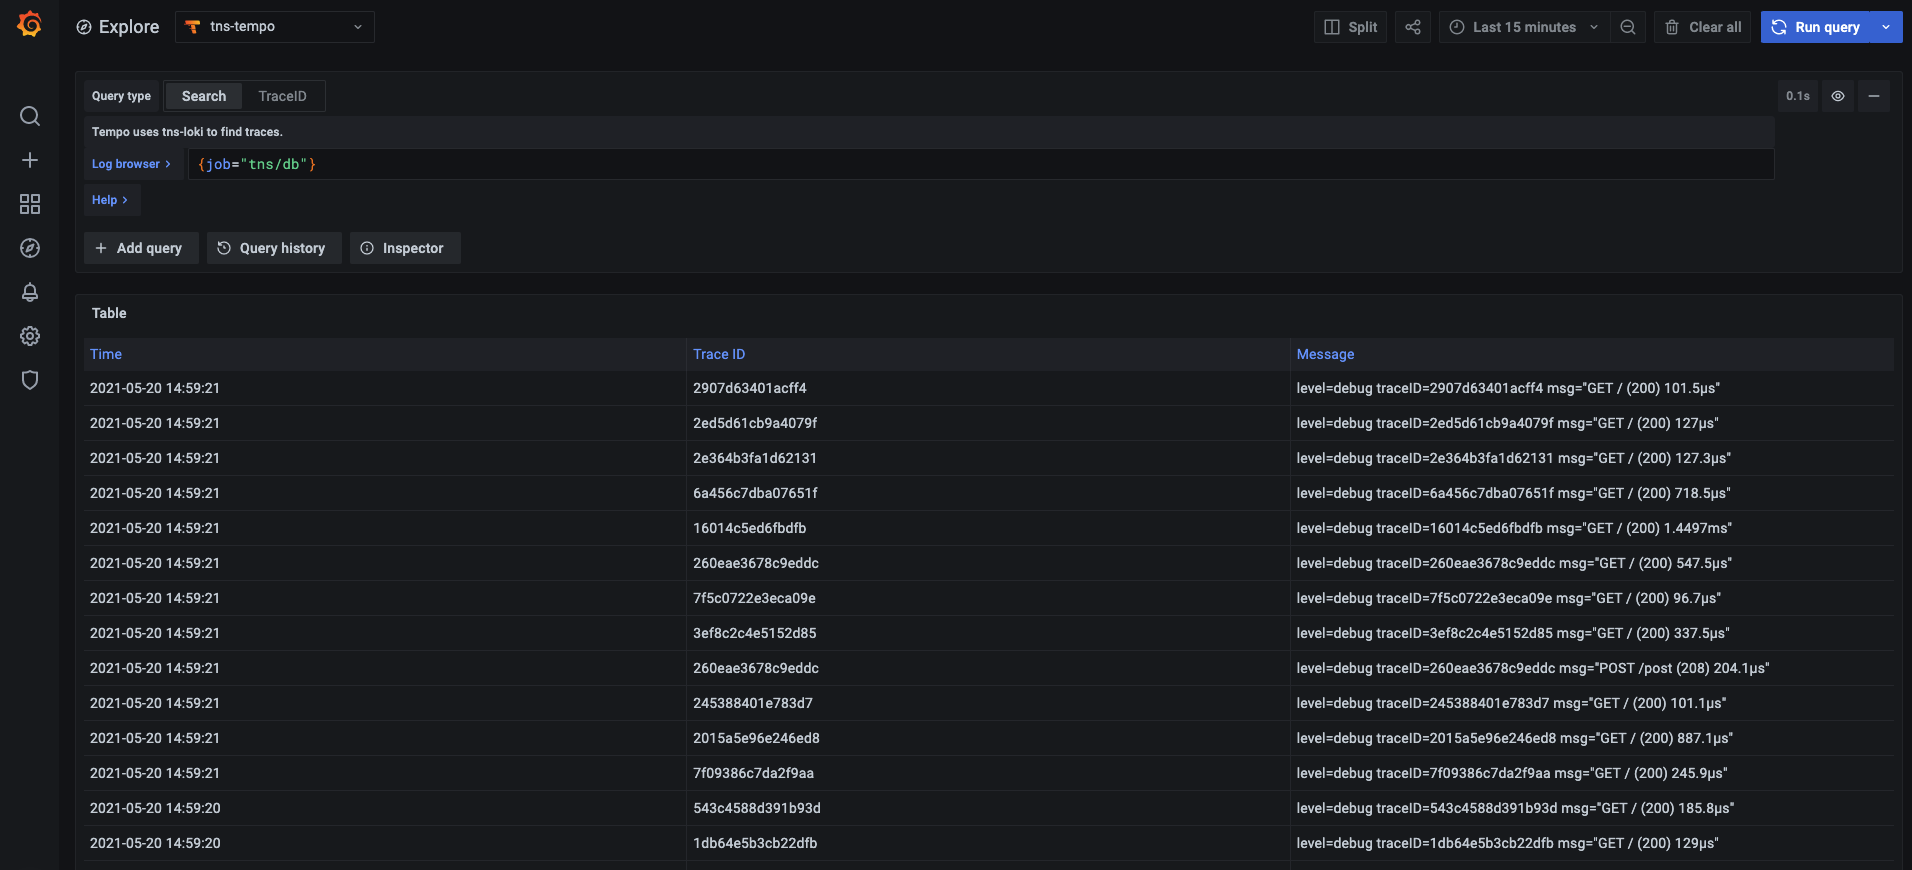
New ways to explore your logs and traces
We’ve also changed the default behavior from creating a 1-hour span Loki query to only query at the exact time the trace span started for the duration of it. For more fine-grained control over this, you can shift this time in the tracing data source settings. Also, it is now possible to shift the start time and end time of the Loki query by the set amount.
Learn more:
It’s easier than ever to connect all your data
More integrations mean out-of-the-box dashboards for Kafka, Nomad, Jenkins, and more. Configuring, installing, connecting, and maintaining all of these components often involves significant domain knowledge and can be tedious and time-consuming. Integrations abstract all of this work away.
Get preconfigured dashboards for your services with new Cloud integrations like:
Kafka
Get dashboards for your Kafka Broker clusters, Zookeeper clusters, Kafka Connect clusters, Schema Registry clusters, and ksqldb clusters, along with a specific dashboard for topics information and consumption lag.
Jenkins
This integration focuses on the state of the build infrastructure as well as the duration and health of defined jobs.
GitHub
The GitHub integration enables the agent to send metrics to Grafana Cloud along with a useful default dashboard for visualization.
New enterprise-grade features for large teams and lots of data
The following features are available to Grafana Cloud Pro and Advanced tier customers. If you’re not already using Grafana Cloud Pro or Advanced, sign up now for your free 14-day Pro trial or upgrade your subscription in the cloud portal under Billing/Manage Subscriptions.
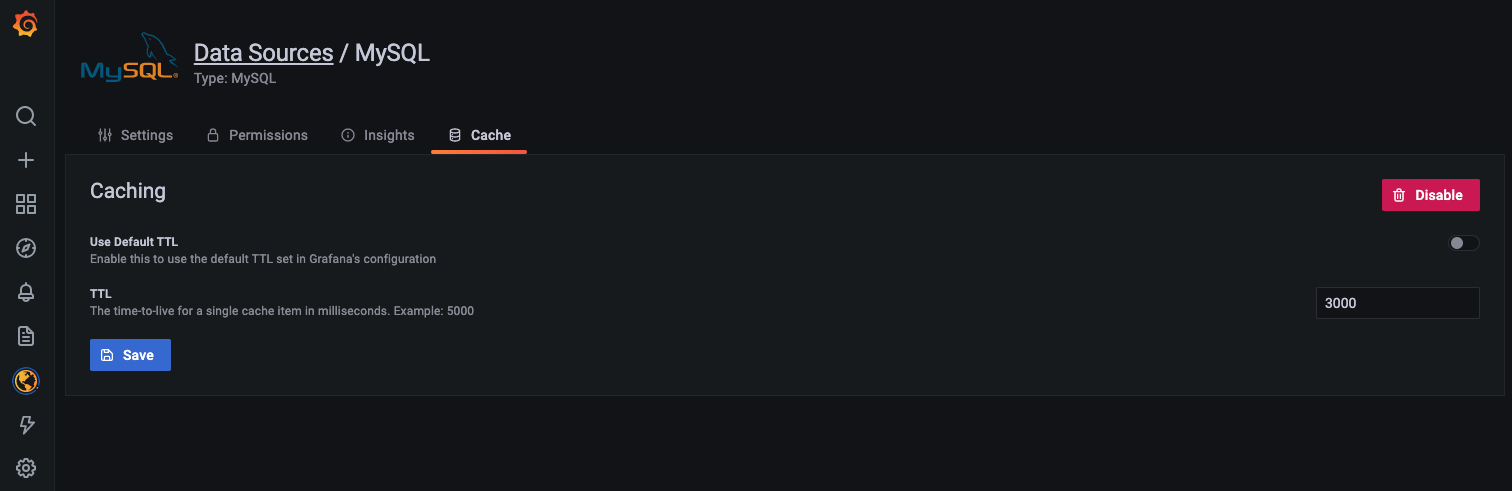
Get query caching in Grafana Cloud
Grafana Cloud will now cache the results of backend data source queries, eliminating unnecessary duplicate queries and reducing dashboard load times — as well as costs.
Query caching stores results for a period of time so that the next user to load a dashboard or run a query saves the round trip to the data source. This means snappier dashboards, reduced cost, and lower likelihood that users will hit the rate limit and pay for unnecessary queries.
Learn more:
- See the query caching section of the Grafana Enterprise docs
- Read the blog about how to reduce costs and increase performance with query caching in Grafana Cloud
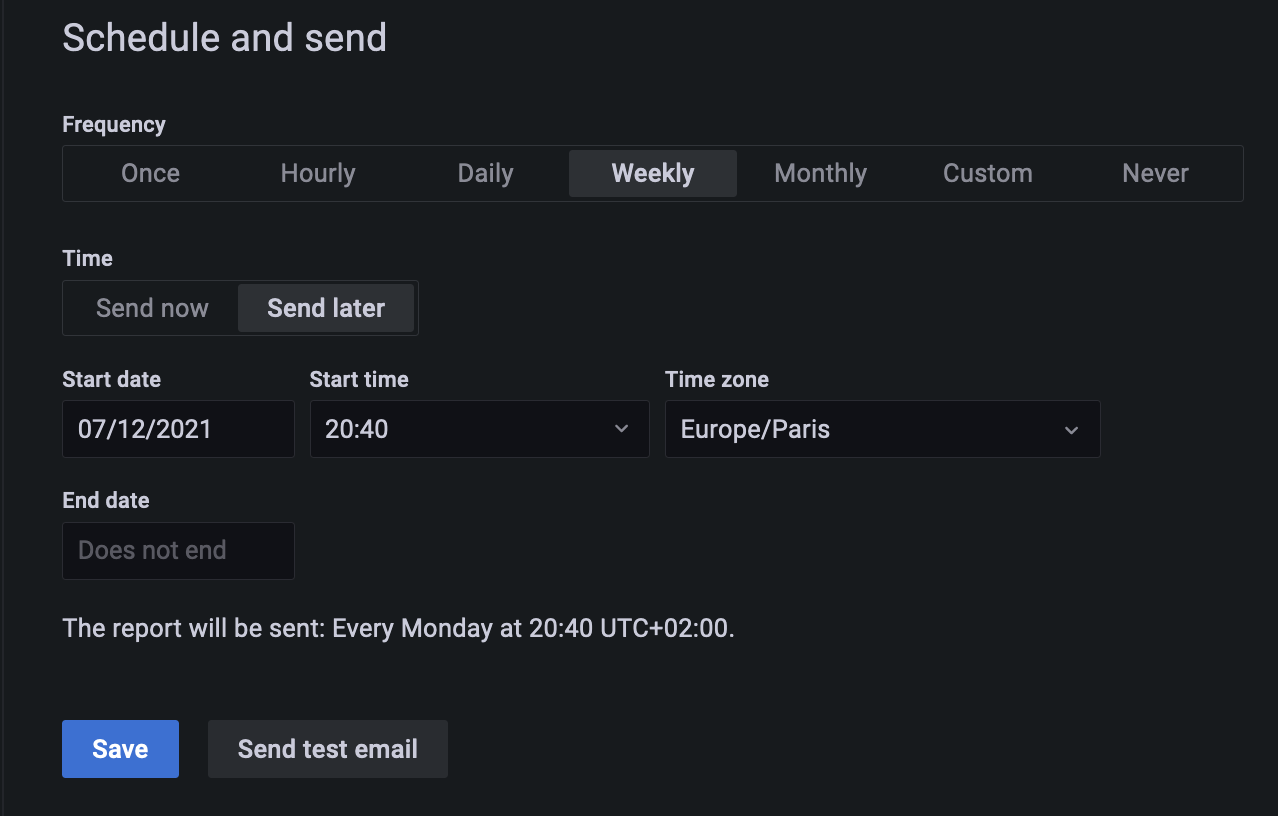
Send better reports for you and your team
With the new, improved reporting, you can now choose to send a report at custom intervals, such as every 4 hours or every 2 weeks. You can also send a report for a limited time period by providing a start and end date, or you can set a more specific cadence such as only on weekdays or, say, on the last day of each month. This change accompanies some other recent improvements to Reporting, like the ability to choose template variables for reports and an improved UX for authoring reports.
Learn more:
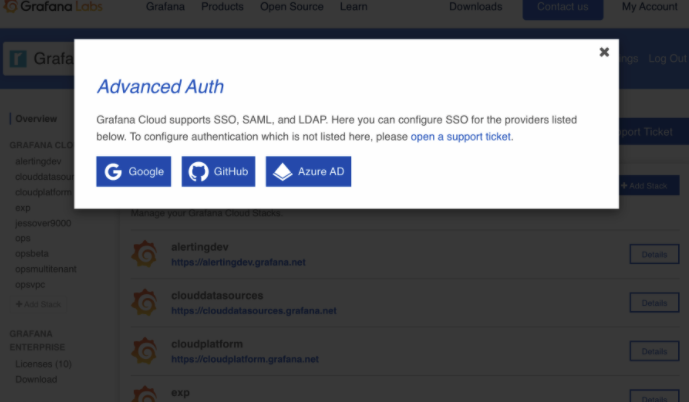
Configure OAuth for your Google, GitHub, or Azure AD account from the Cloud Portal
You can now configure Open Authorization (OAuth2) to allow users to login with their Google, GitHub, or Azure AD accounts — all directly from the Grafana Cloud Portal!
Learn more:
- See the docs to configure OAuth in Grafana Cloud
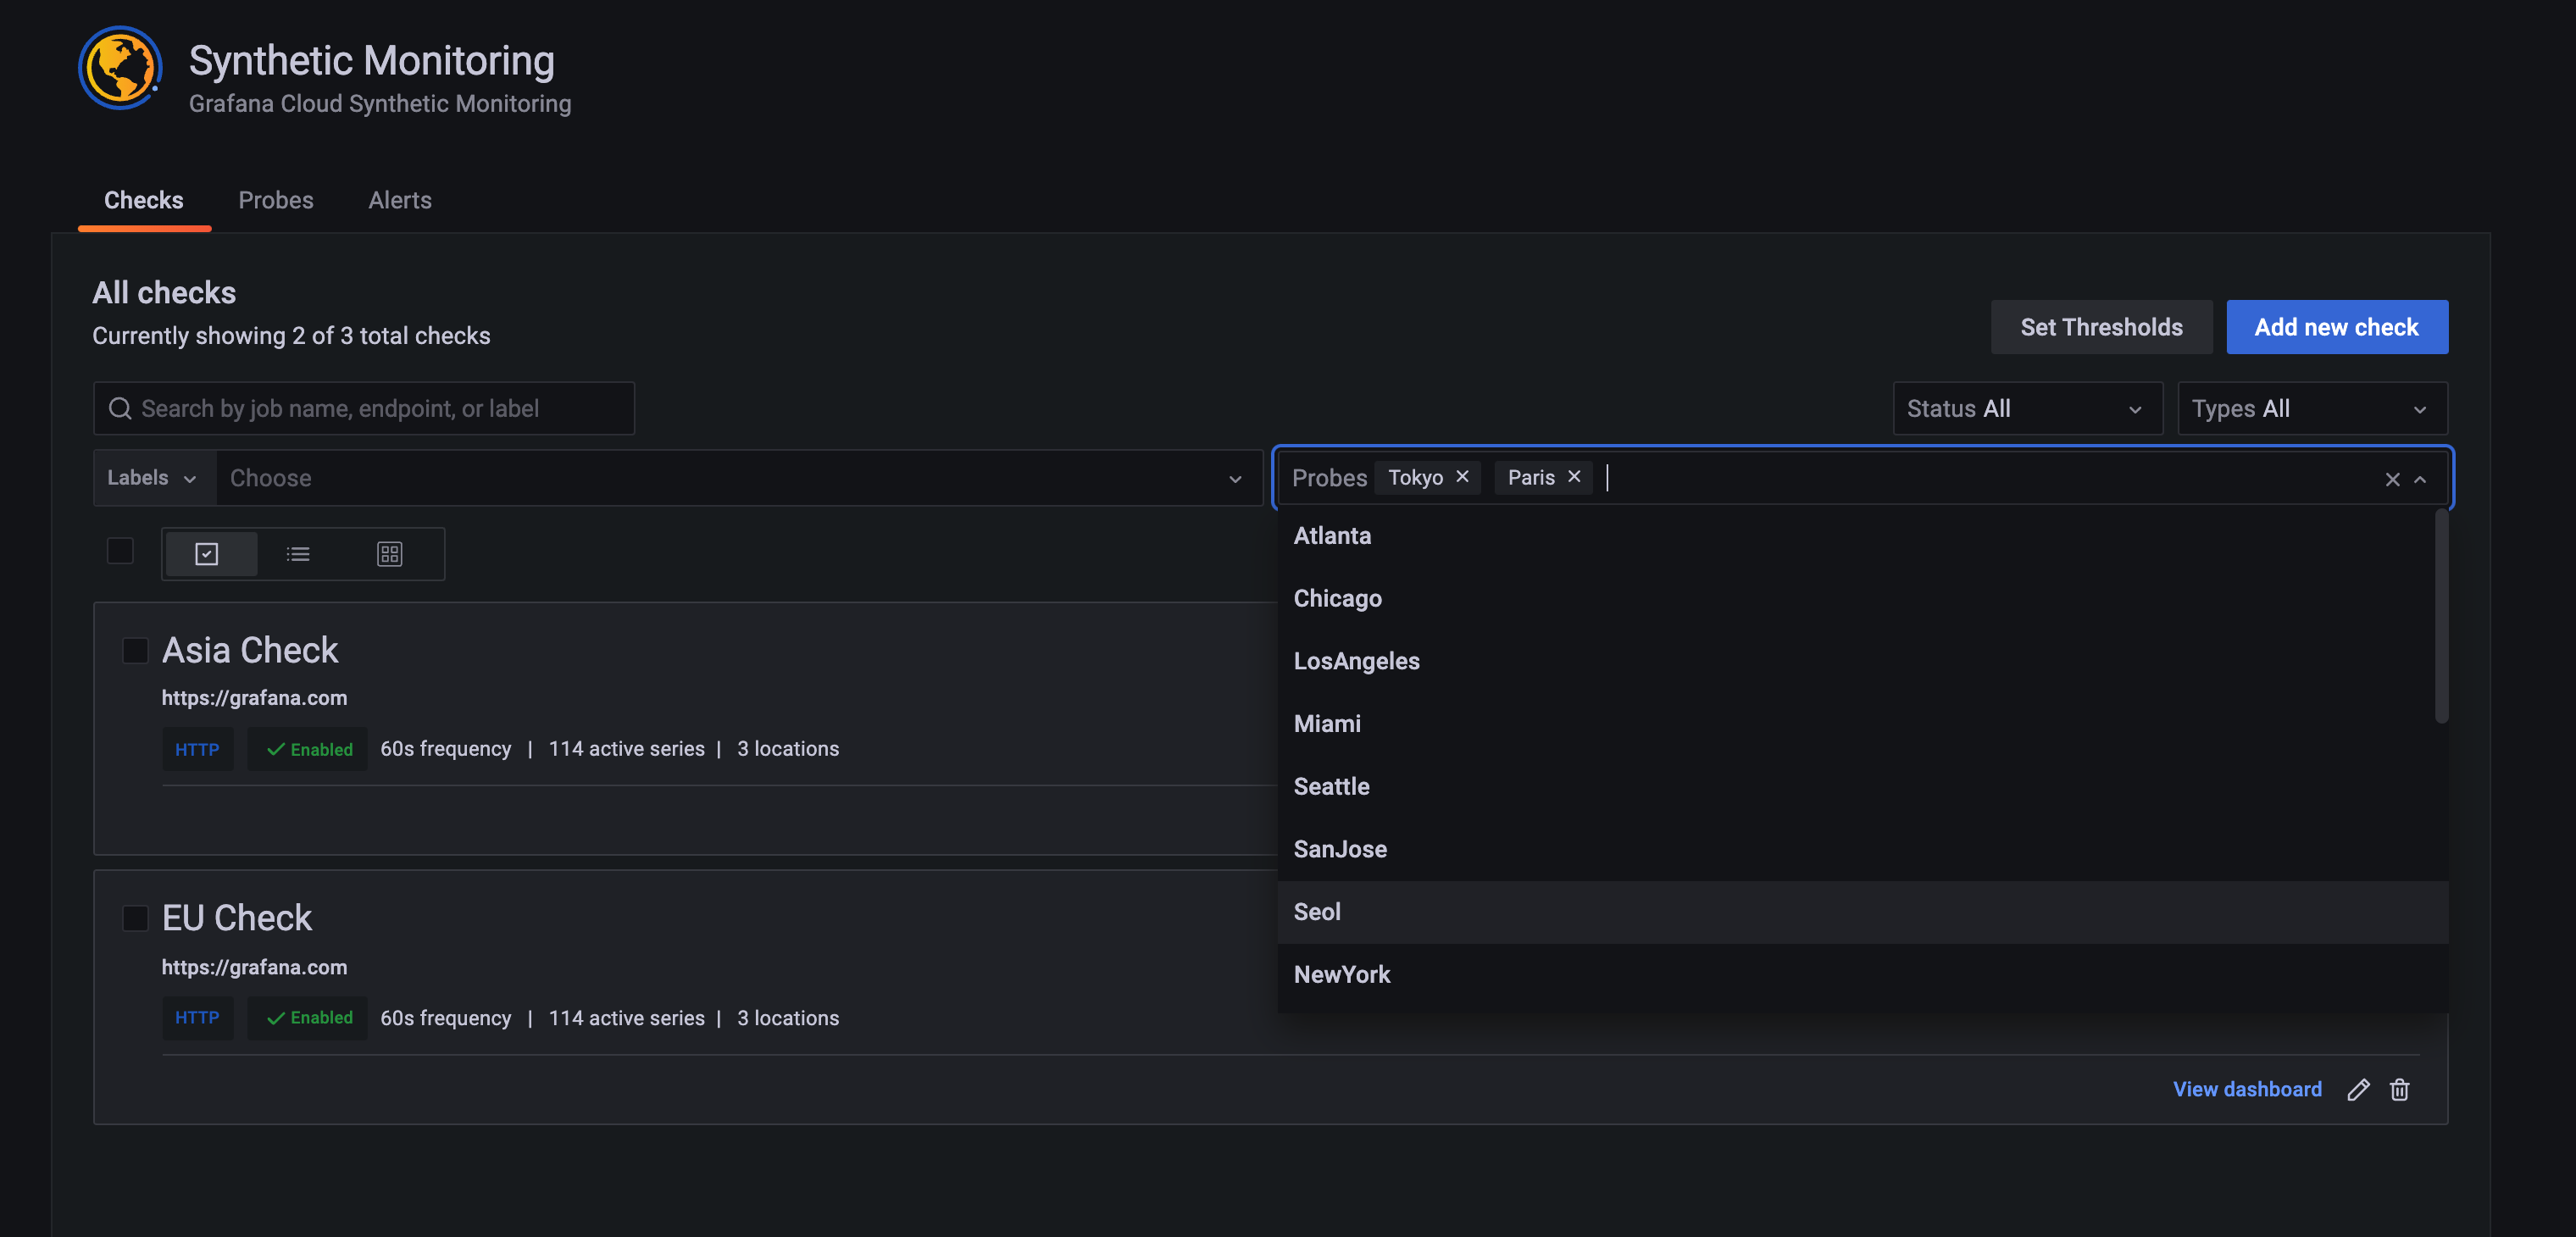
Synthetic monitoring: Customizable thresholds for checks and filters for your probe locations
The latest features included in synthetic monitoring allow you to customize thresholds for specific synthetic checks as well as easily filter by specific probe location.
Learn more:
- See the docs to get started with synthetic monitoring
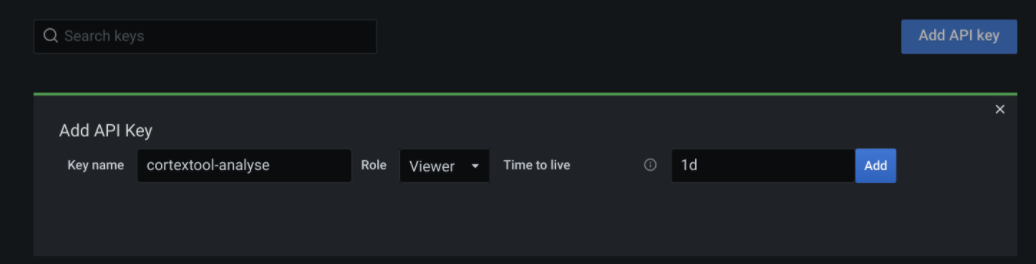
A new set of commands for cortex-tools
Figure out which metrics actually matter with a set of commands for cortex-tools — our command line tool for interacting with Grafana Cloud — that generates a list of metrics, ranked by cardinality, that are going unused.
Learn more:
- Check out the guide to learn how to analyze and reduce metrics usage with cortextool
Now available in the EU
Grafana Cloud is now available in the EU. When creating a new stack, just select the region where you want your data stored.
ICYMI: The latest resources to help you optimize Grafana Cloud
Finally, check out the most recent tips and tricks and cool use cases to help you get started with Grafana Cloud:
Tips and tricks:
- A guide to migrating a Kube-Prometheus Helm stack to Grafana Cloud
- How to set up synthetic monitoring at scale with Grafana Cloud
- Learn how to manage SLOs across multiple monitoring data sources
Cool use cases: