How to use AWS IoT SiteWise Edge and Grafana to collect and monitor industrial data on-premises
Tajammal is passionate about developing delightful zero to one experiences. He is currently a Product Manager on AWS IoT SiteWise, focusing on SiteWise Edge to empower industrial customers with operational insights. You can connect with him on LinkedIn.
The AWS IoT SiteWise plugin for Grafana was created to enable AWS IoT SiteWise customers to visualize and monitor industrial equipment data using Grafana dashboards. Industrial customers use AWS IoT SiteWise to collect, process, and monitor their industrial data at scale. This plugin allows them to use Grafana dashboards to monitor this data, stored by AWS IoT SiteWise in the AWS Cloud. We are now adding support for the SiteWise Edge feature to the AWS IoT SiteWise plugin, which will enable Grafana users to monitor industrial data processed and stored by AWS IoT SiteWise on-premises (i.e. at the edge).
In this post, I’ll introduce you to SiteWise Edge, a feature of AWS IoT SiteWise, and how to use it to collect, process, and monitor industrial equipment data.
But first, some background: Industrial customers across manufacturing, consumer & packaged goods (CPG), and oil & gas sectors are looking for ways to reduce waste by improving their operational efficiency, reducing product defects, and unplanned equipment downtime. They want to get insights into their operations by monitoring their industrial equipment in near real-time to reduce business impact as soon as issues are detected. They want to operate and monitor their operations within their constraints, such as intermittent connectivity on factory floors and low bandwidth connections. This requires the data collection, processing, and monitoring applications to work seamlessly in the cloud and on-premises in near real-time.
Developing a near real-time data collection, processing, and monitoring application can be quite challenging. Developers need to write data collection applications to collect data from various sources using a number of protocols. They need to add context to this data (e.g. associate the asset that is producing this data, add measurement units to the data), and then process the data to make it human-readable and actionable. Developers have to then create applications to visualize this data. In addition, they need to build infrastructure to store this data locally as well as in the cloud. For industrial customers with operational priorities and limited resources, this can be expensive and time-consuming to develop and maintain.
AWS launched AWS IoT SiteWise in general availability in July 2020 to address these customer needs, reducing the need for industrial developers to build and maintain their own data and analytics infrastructure for industrial applications. AWS IoT SiteWise is a managed service that makes it easy to collect, store, organize, and monitor data from industrial equipment at scale, which helps customers make better, data-driven decisions. With SiteWise Edge, customers can now process and monitor data on-premises. Monitoring their data on-premises ensures that they can always monitor their industrial equipment data even with intermittent connectivity. They can also access this data using AWS IoT SiteWise APIs for use in local applications. SiteWise Edge is available in all regions where AWS IoT SiteWise is available. For a full list of AWS Regions where AWS IoT SiteWise is available, visit the AWS region table.
How AWS IoT SiteWise works
The first step in monitoring industrial equipment data is collecting raw equipment data. You can connect your local servers to AWS IoT SiteWise using the SiteWise Edge software. You can configure this software in the AWS IoT SiteWise console and download a device installer for SiteWise Edge software. The software can be installed on gateway devices or industrial computers running the Linux operating system. Using this software, SiteWise Edge will collect, process, and store industrial data on-premises.
The next step is adding context to this data to make it readable and get insights from it. Context includes information about the equipment, units of measure, and status codes. Once this context is added, operators can derive business metrics from their equipment data by configuring metrics, such as Overall Equipment Efficiency (OEE). SiteWise uses the context and provided metric formulas to calculate metrics from raw data from industrial equipment on regular intervals. Using the AWS IoT SiteWise console, you can add context and specify metrics (and interim data transforms) by defining asset models. You only need to configure your asset models once and this configuration (context, transforms, metrics) is then applied to all assets you create from that asset model. AWS IoT SiteWise processes the data to compute transforms and metrics in the cloud by default, but you also easily move data processing on-premises through the edge configuration options on asset models.
Once data is collected and processed, customers usually want to share this data and metrics with their operational technicians and plant managers in near real-time so they can take actions when issues arise. AWS IoT SiteWise provides two options for visualizing and monitoring data in the cloud or at the edge — AWS IoT SiteWise Monitor or Grafana.
With the SiteWise Monitor feature, you can set up dashboards in the AWS IoT SiteWise console. You can visualize data by simply dragging and dropping the properties you want to view, without any code or development effort. These dashboards are configured in the AWS IoT SiteWise console in the AWS Cloud, but can also be viewed on-premises. The on-premises dashboards continue to function during intermittent connectivity. This simplified setup experience empowers workers in operational roles and enables them to be more productive, without having to rely on their IT team members for creating portals and visualizations.
The second option for visualizing and monitoring data is using Grafana dashboards. Grafana provides you with a flexible plugin-based approach for all your data, with native support for a variety of visualizations covering diverse use-cases. The built-in streaming capabilities through Grafana Live are an added benefit for real-time applications. A self-managed Grafana instance on the Edge also provides granular control over user administration, upgrades, and maintenance. You can use the AWS IoT SiteWise plugin for Grafana to connect to AWS IoT SiteWise and view your assets and data stored in AWS in Grafana dashboards. An added benefit of using Grafana for monitoring AWS IoT SiteWise data is the ability to monitor all your data — from AWS IoT SiteWise, other AWS sources, and third-party sources such as Enterprise Resource Planning (ERP) systems — in one dashboard. For example, you can view the state of your equipment (from AWS IoT SiteWise data) along with a list of active jobs (from ERP systems) in one dashboard. This simplifies getting insights from data spread across various data stores for operators.
With the new update to the AWS IoT SiteWise for Grafana plugin, you can connect your Grafana dashboards directly to the SiteWise Edge software and access your asset data stored on-premises. This enables you to visualize and monitor your industrial data using Grafana’s real-time monitoring dashboards.
How to monitor your data using SiteWise and Grafana on-premises
All it takes is four steps and you’ll be able to monitor industrial data using AWS IoT SiteWise and Grafana.
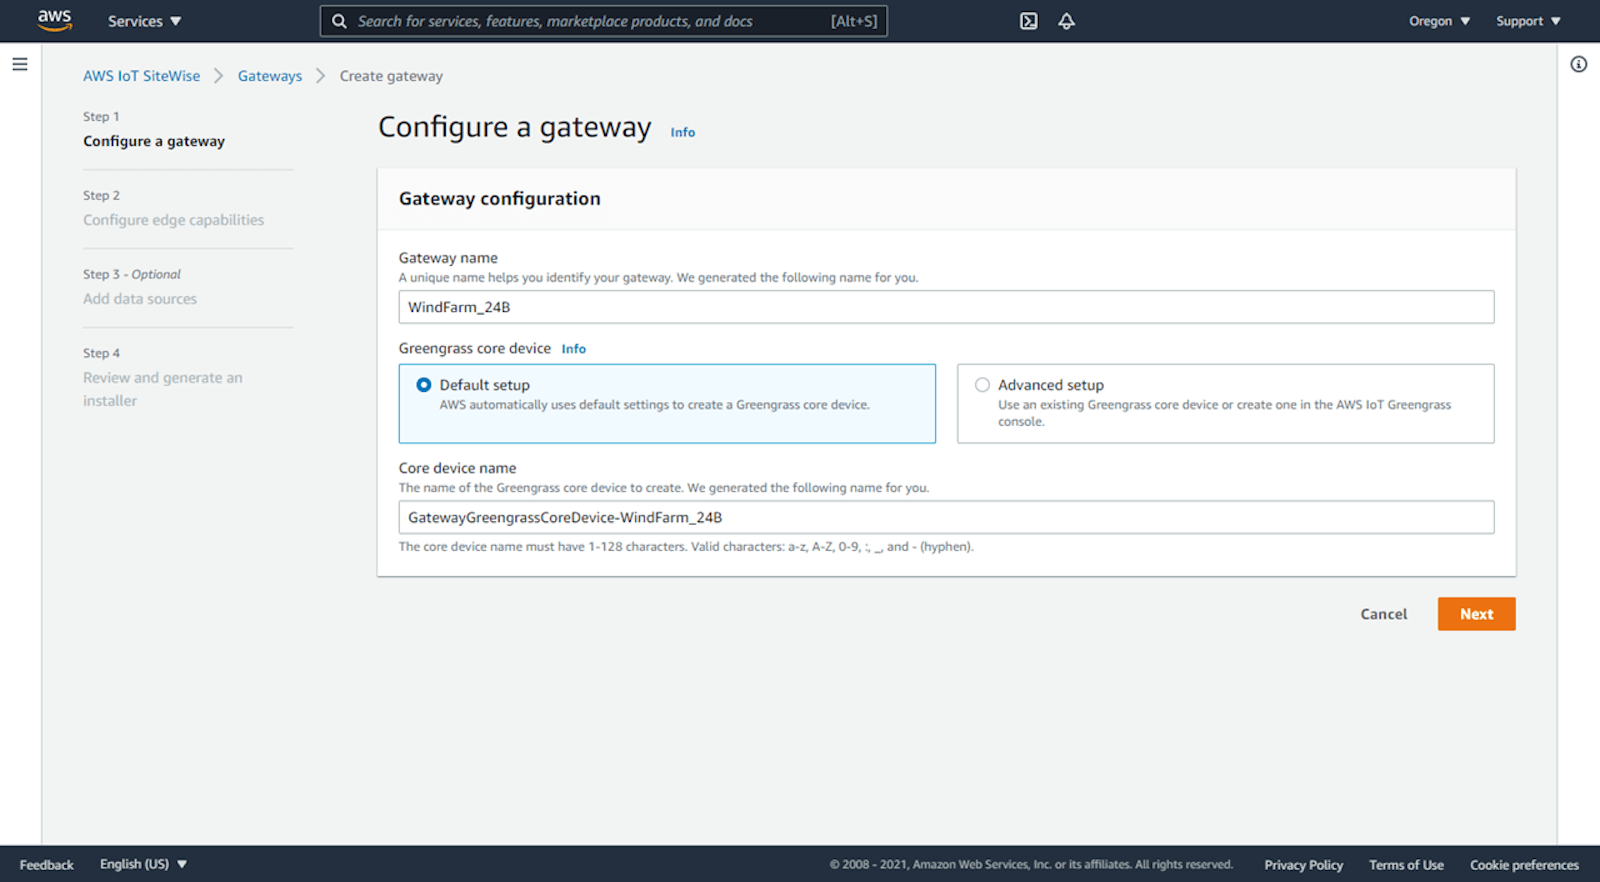
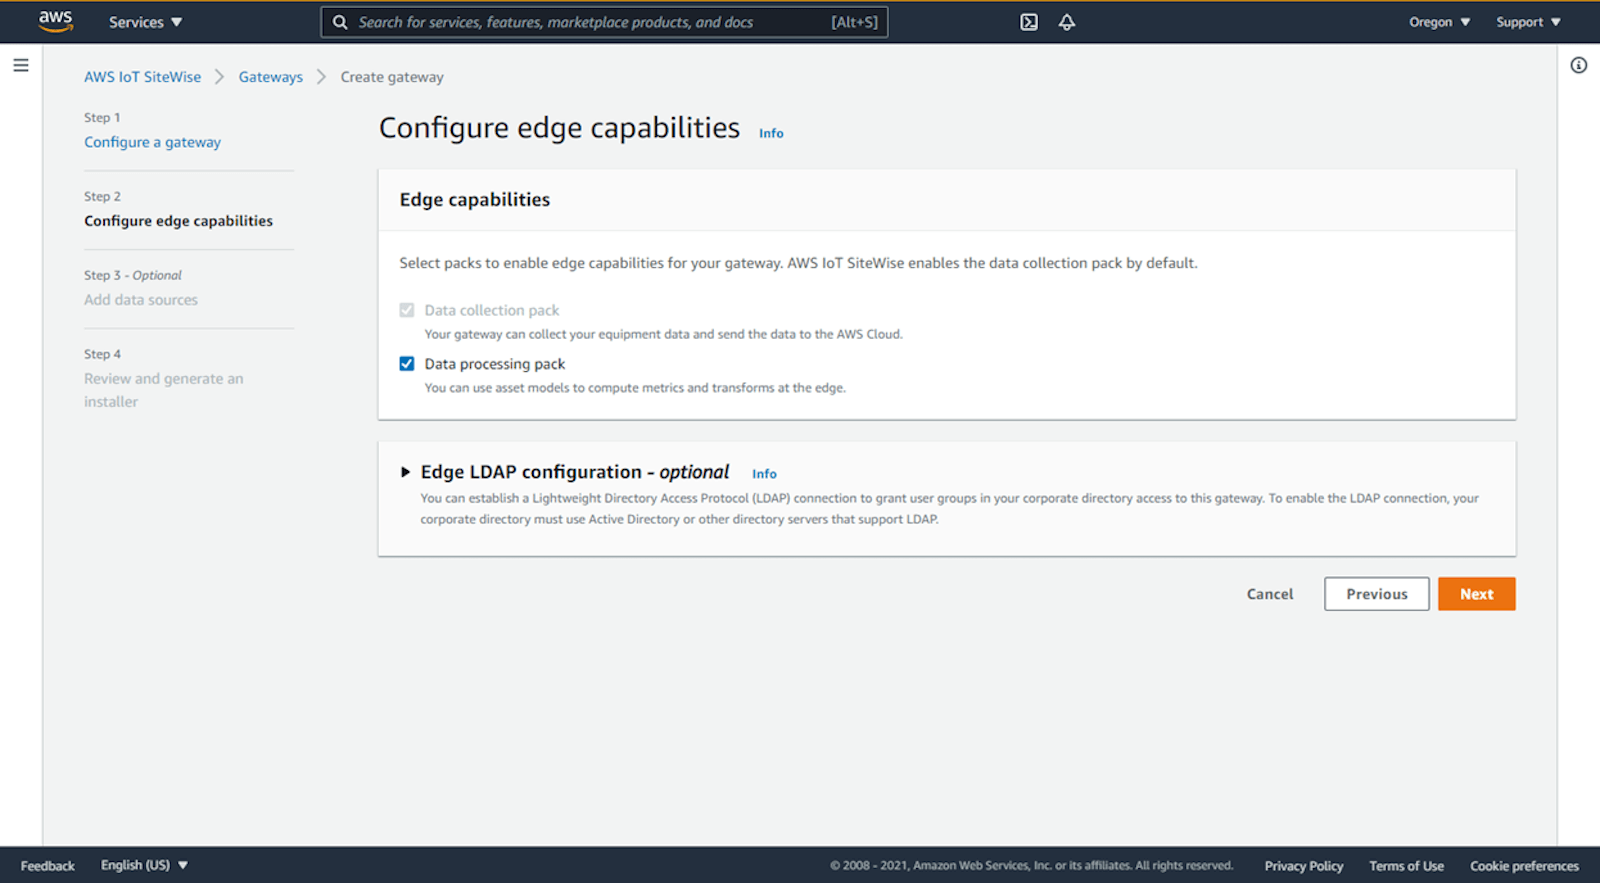
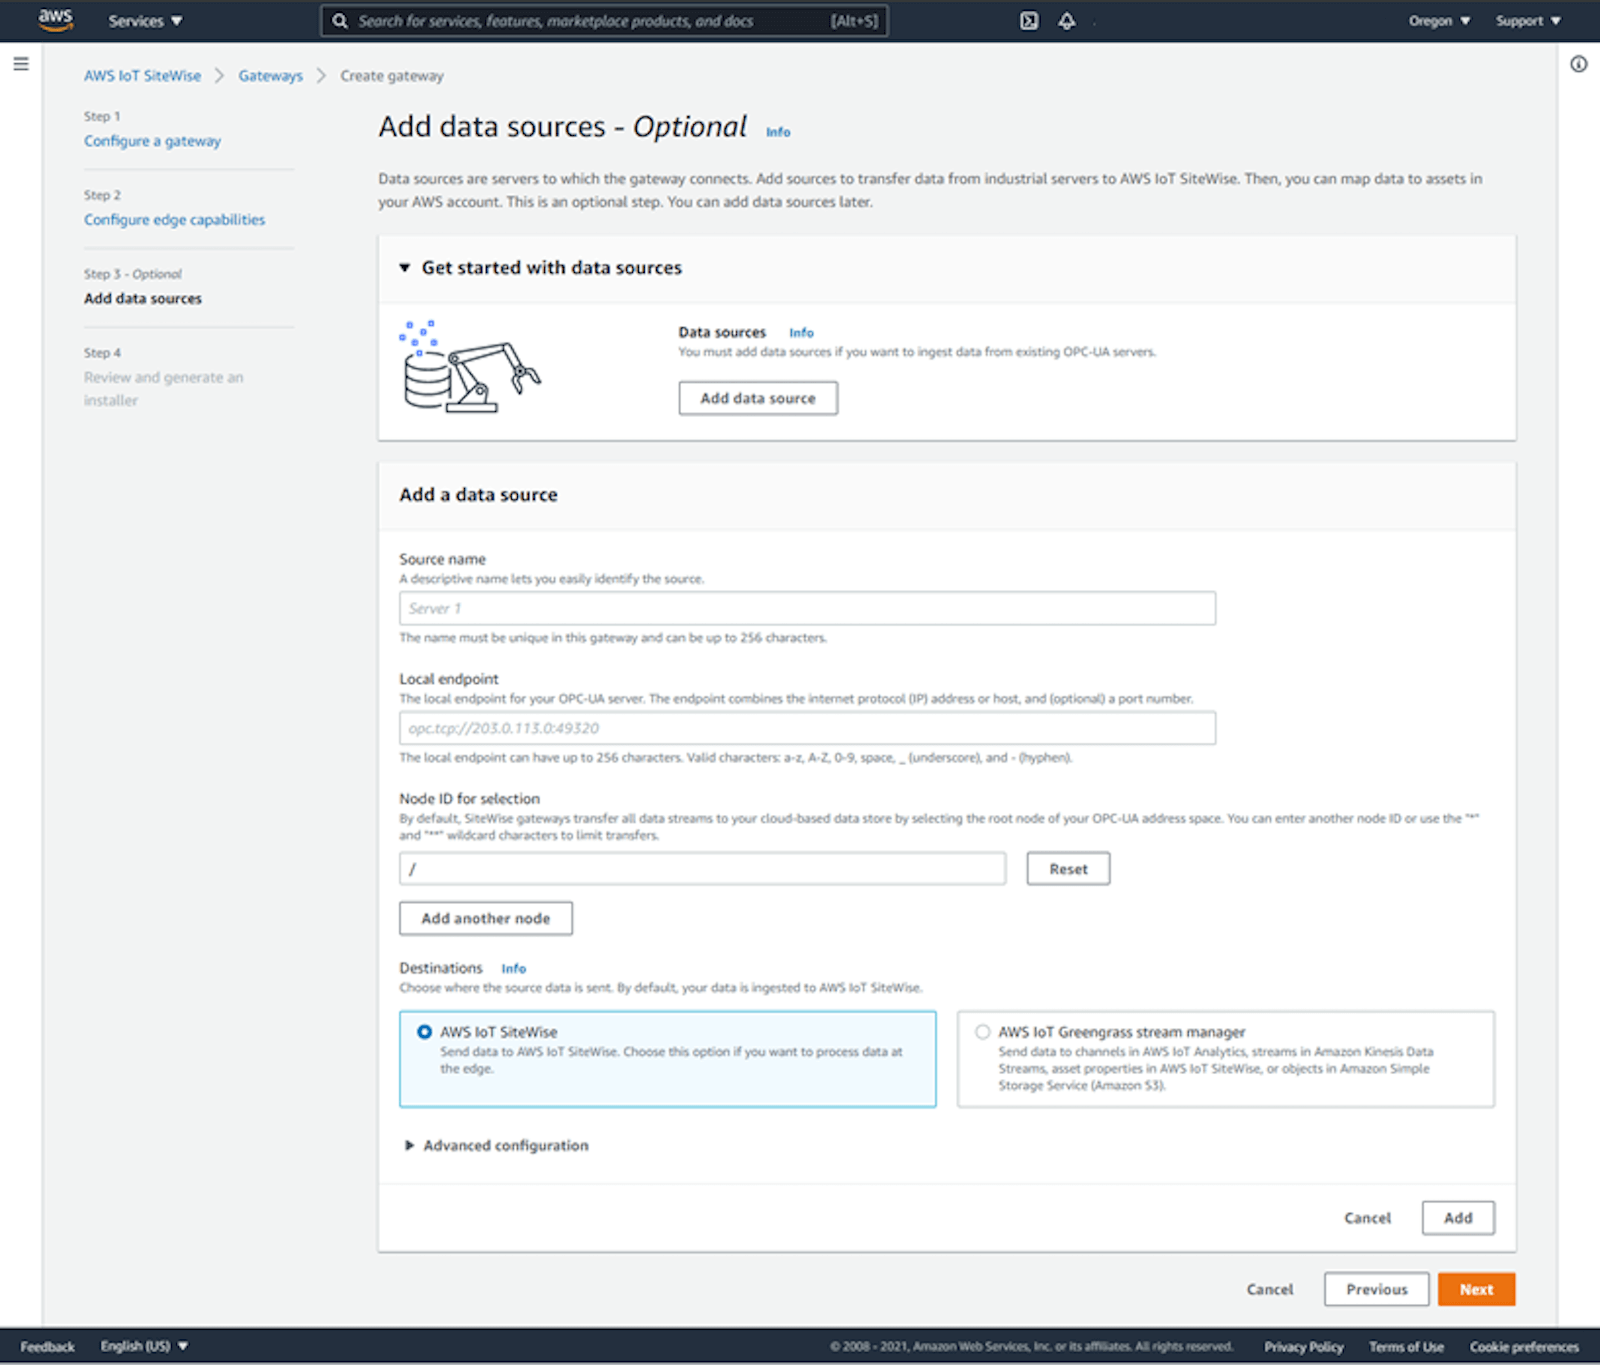
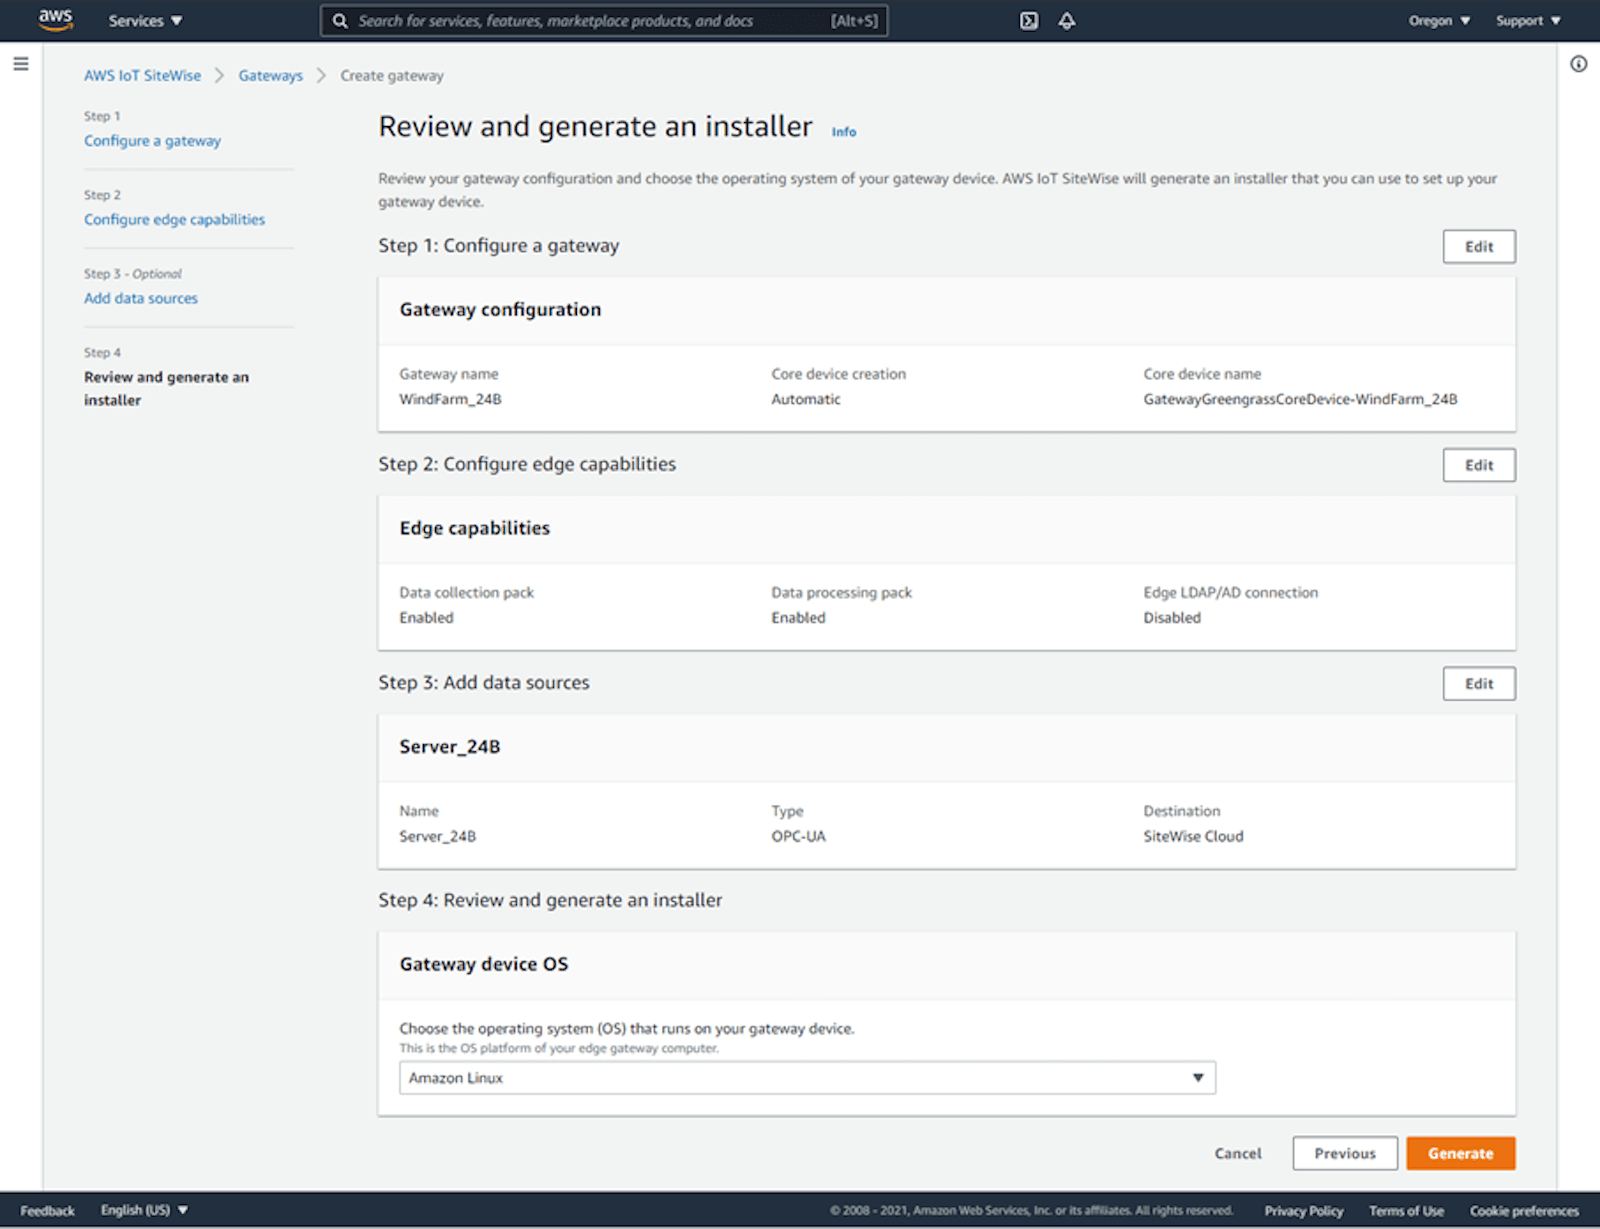
- Configure and set up the gateway. You can configure the gateway in the AWS IoT SiteWise console and install it on your industrial computers. You can connect the gateway to your local servers (such as an OPA-UA server) to collect data.
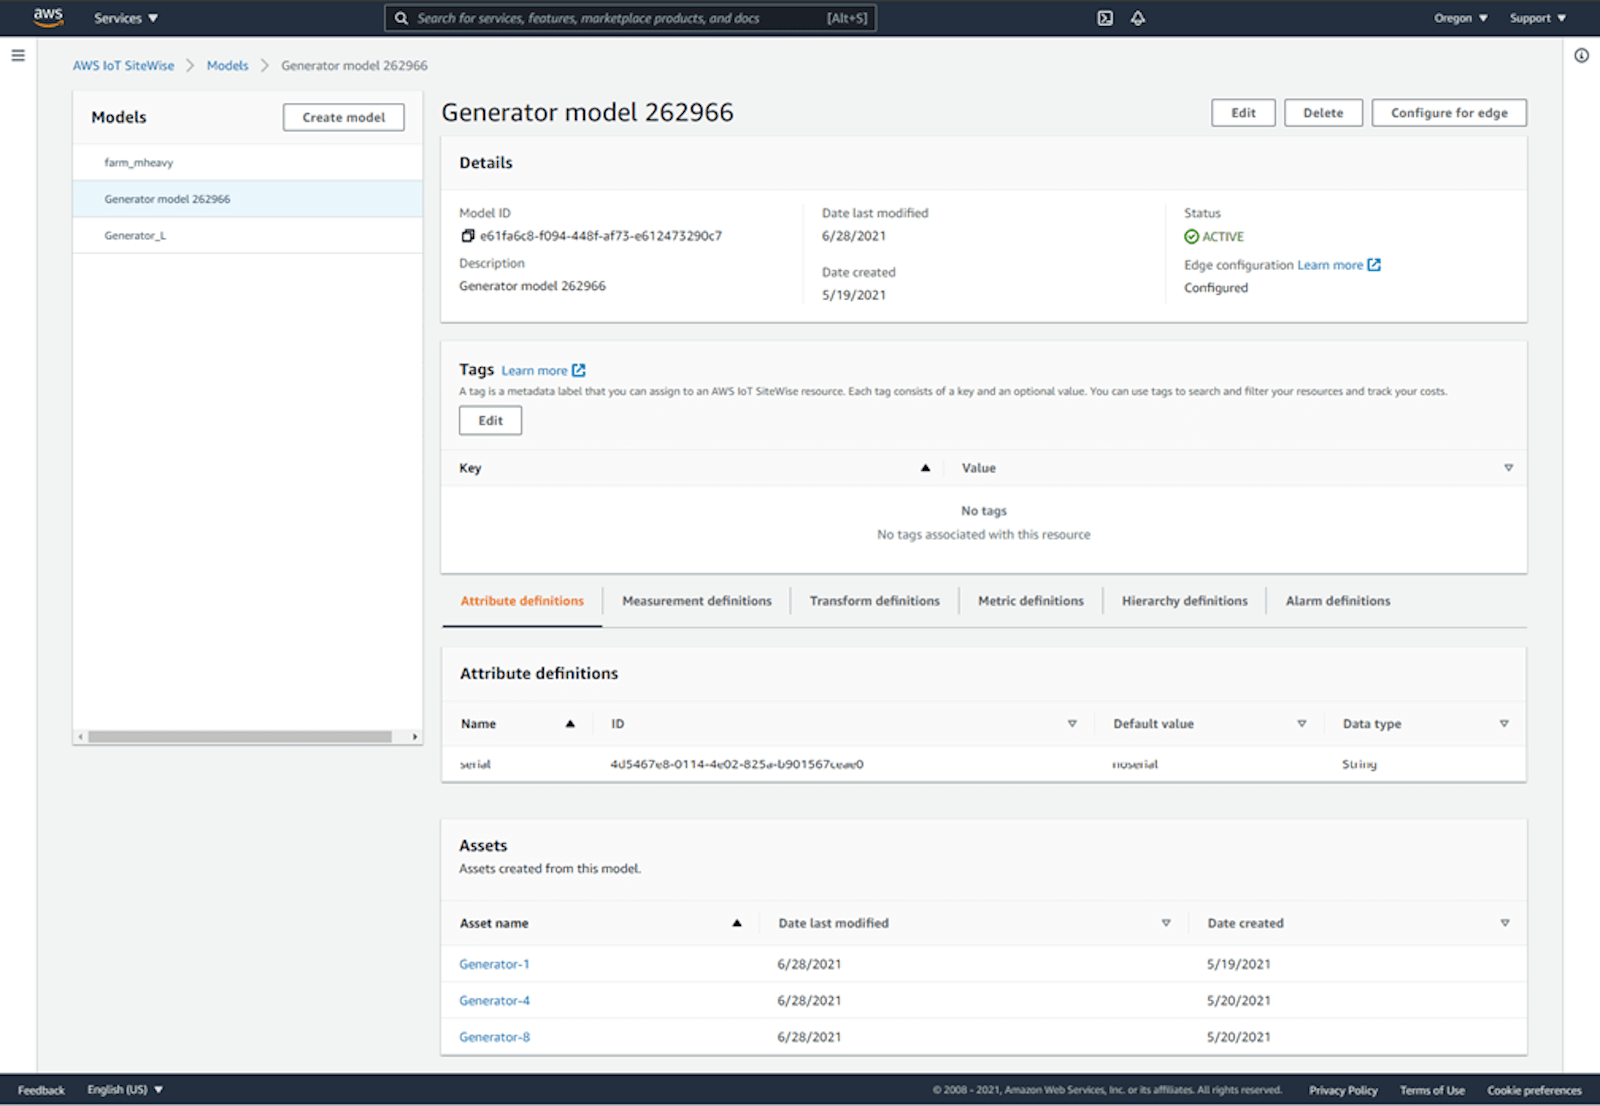
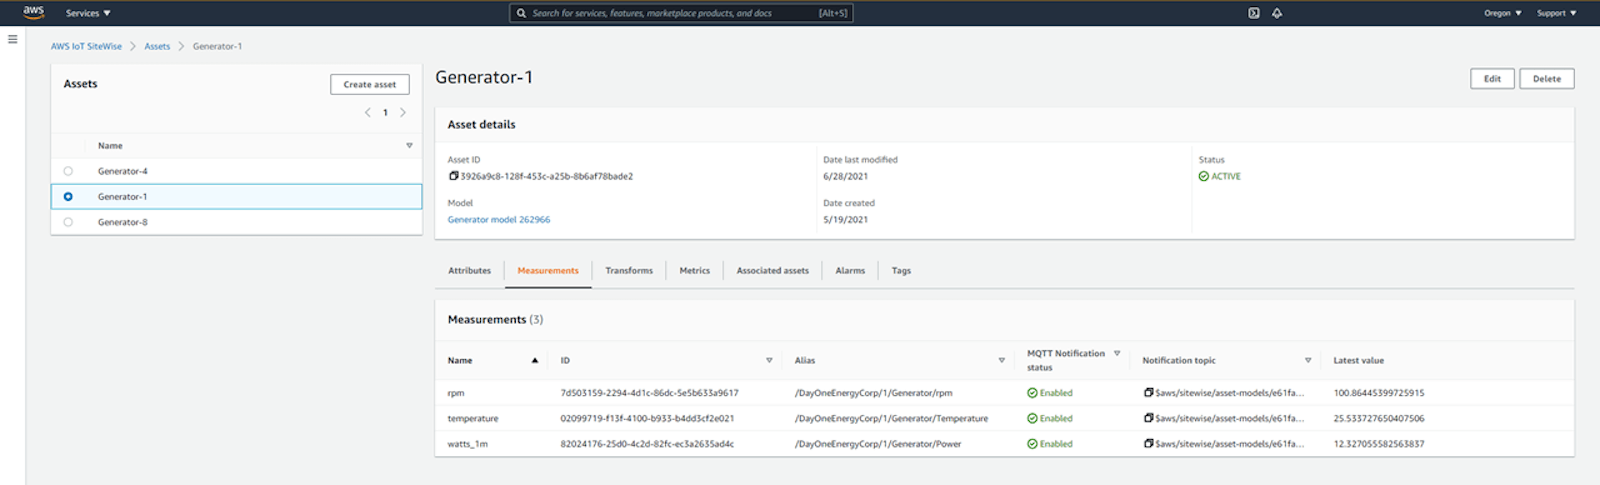
- Create asset models and assets. The next step is to build a virtual representation of your equipment in AWS IoT SiteWise using asset models and assets. You can build the models in the AWS IoT SiteWise console and associate attributes, measurements, transforms, and metrics. Once the models are set up, you can add assets to them. All properties of asset models are applied to assets. You can then map your assets with the data collected at the gateway and start processing it.
Asset model configuration:
Asset configuration:
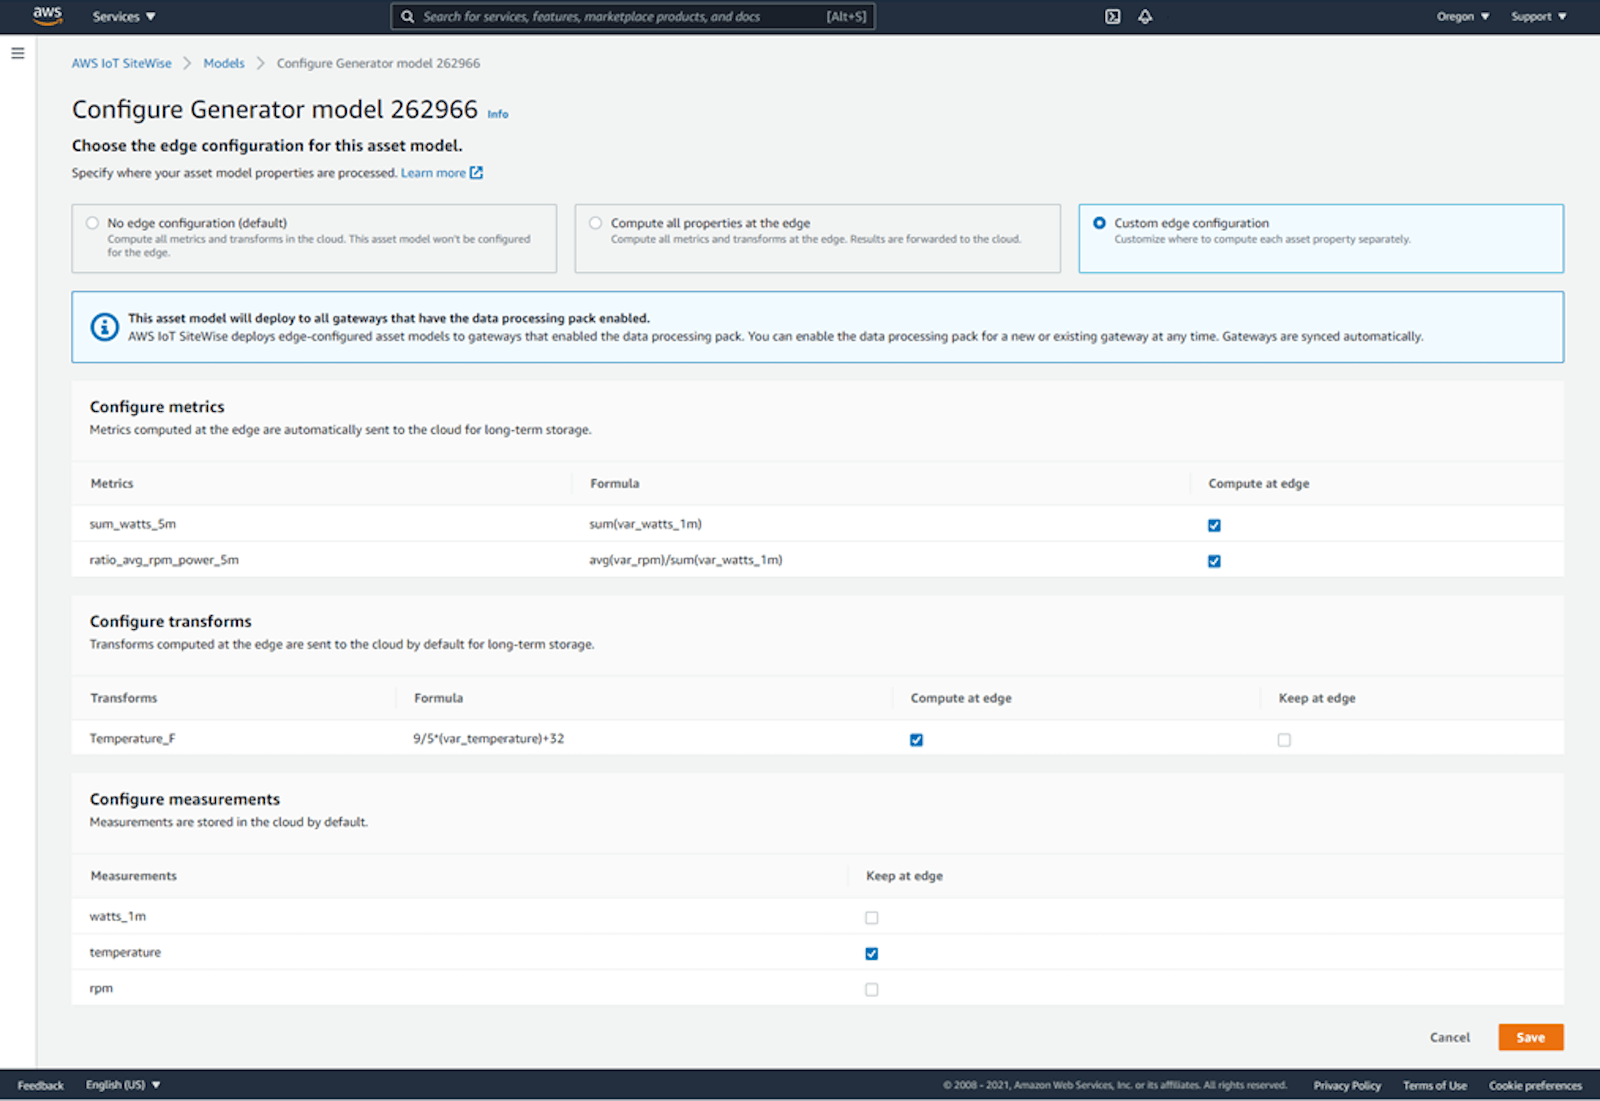
Configure for Edge. Once the asset models and assets are set up, there are three ways to configure the models for processing data at the edge.
- Compute all properties and keep all data in the cloud.
- Compute all properties and keep all data in the edge.
- Mix and match. Select which properties to send to the cloud and which to keep at the edge.
Configuration asset model for edge:
- Create monitor portals. Once the data is collected and processed in the cloud and at the edge, you can visualize it in Grafana using the AWS IoT SiteWise plugin. You can connect to the SiteWise Edge software installed on your industrial computer by adding a new data source in Grafana using the AWS IoT SiteWise plugin. You can add your local gateway credentials, select “Edge” as the region, and add SSL certificate for your local gateway. Once Grafana is connected to your local gateway, you can set up dashboards to visualize your AWS IoT SiteWise data and equipment properties.
Data visualization in Grafana:
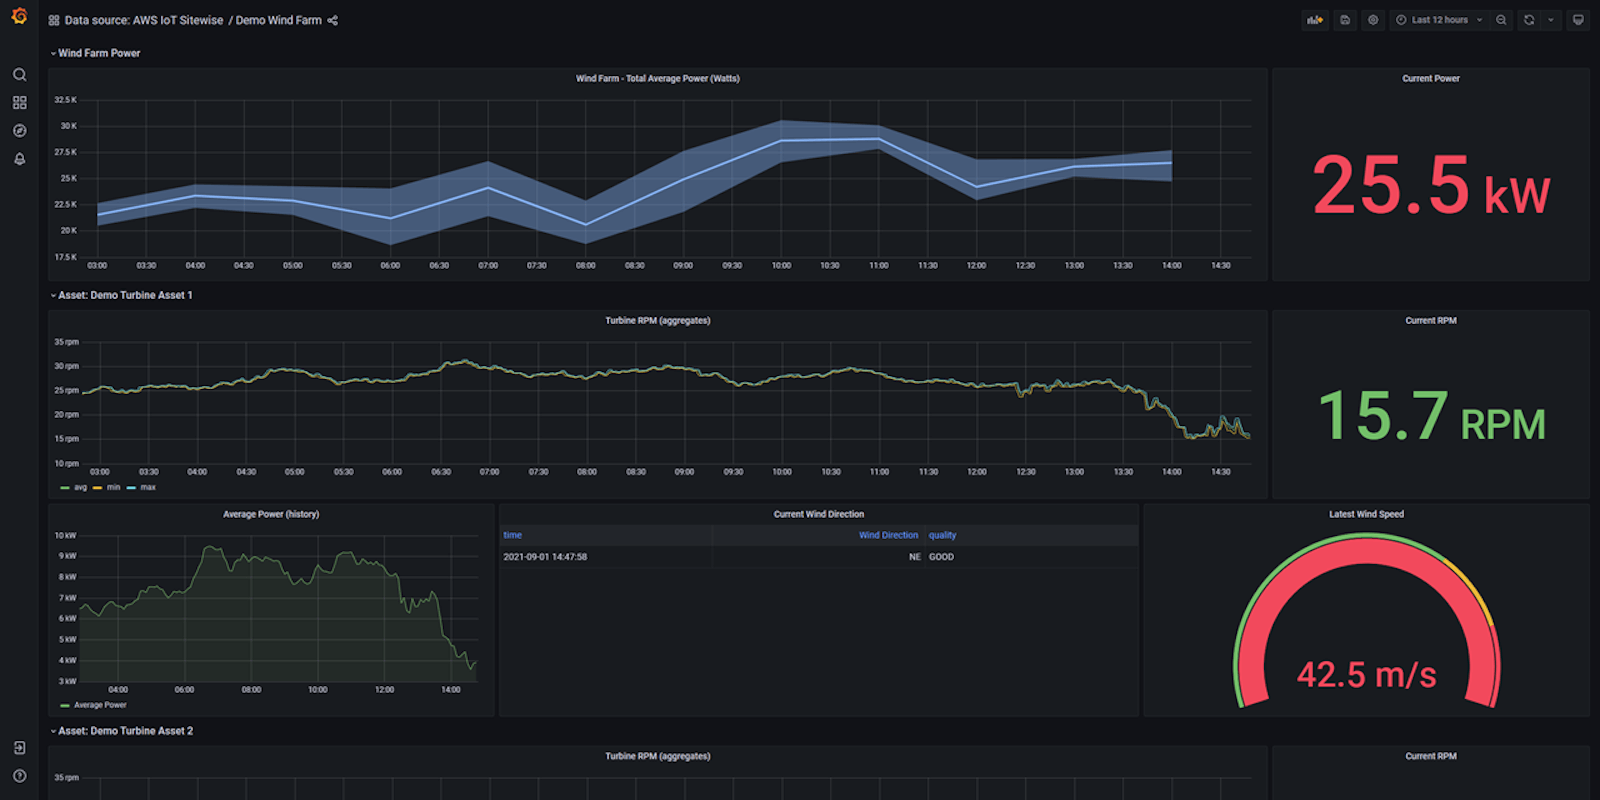
And you are all done. You can view a live demo dashboard of monitoring a wind farm using AWS IoT SiteWise in Grafana here.
For industrial customers, the digital journey doesn’t end at collecting, processing, and monitoring industrial data. Using APIs and connectors, customers can route their data to any of the AWS services. The SiteWise Edge software acts as a gateway for all other AWS cloud services. For example, customers can configure the software to route data to a data lake in Amazon S3 to store their industrial data for longer periods of time. They can also use Amazon QuickSight to run reports and set up dashboards to view historical data and trends. Customers can route data to Amazon SageMaker to run machine learning models to detect trends, optimize processes, and reduce downtime. And they can use AWS IoT SiteWise APIs to integrate with other 3rd party tools such as maintenance or ERP systems.
To learn more or get started, please visit the AWS IoT SiteWise website.