Introducing the Lightstep Metrics plugin for Grafana
Chris Sackes is a Software Engineer at Lightstep. A New Yorker by birth, he loves public transportation, architecture photography, and urban exploration. He’s spent the last five years engineering delightful user experiences for a variety of applications.
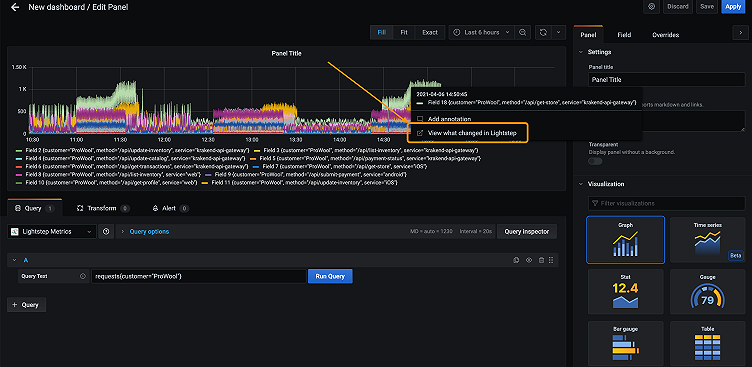
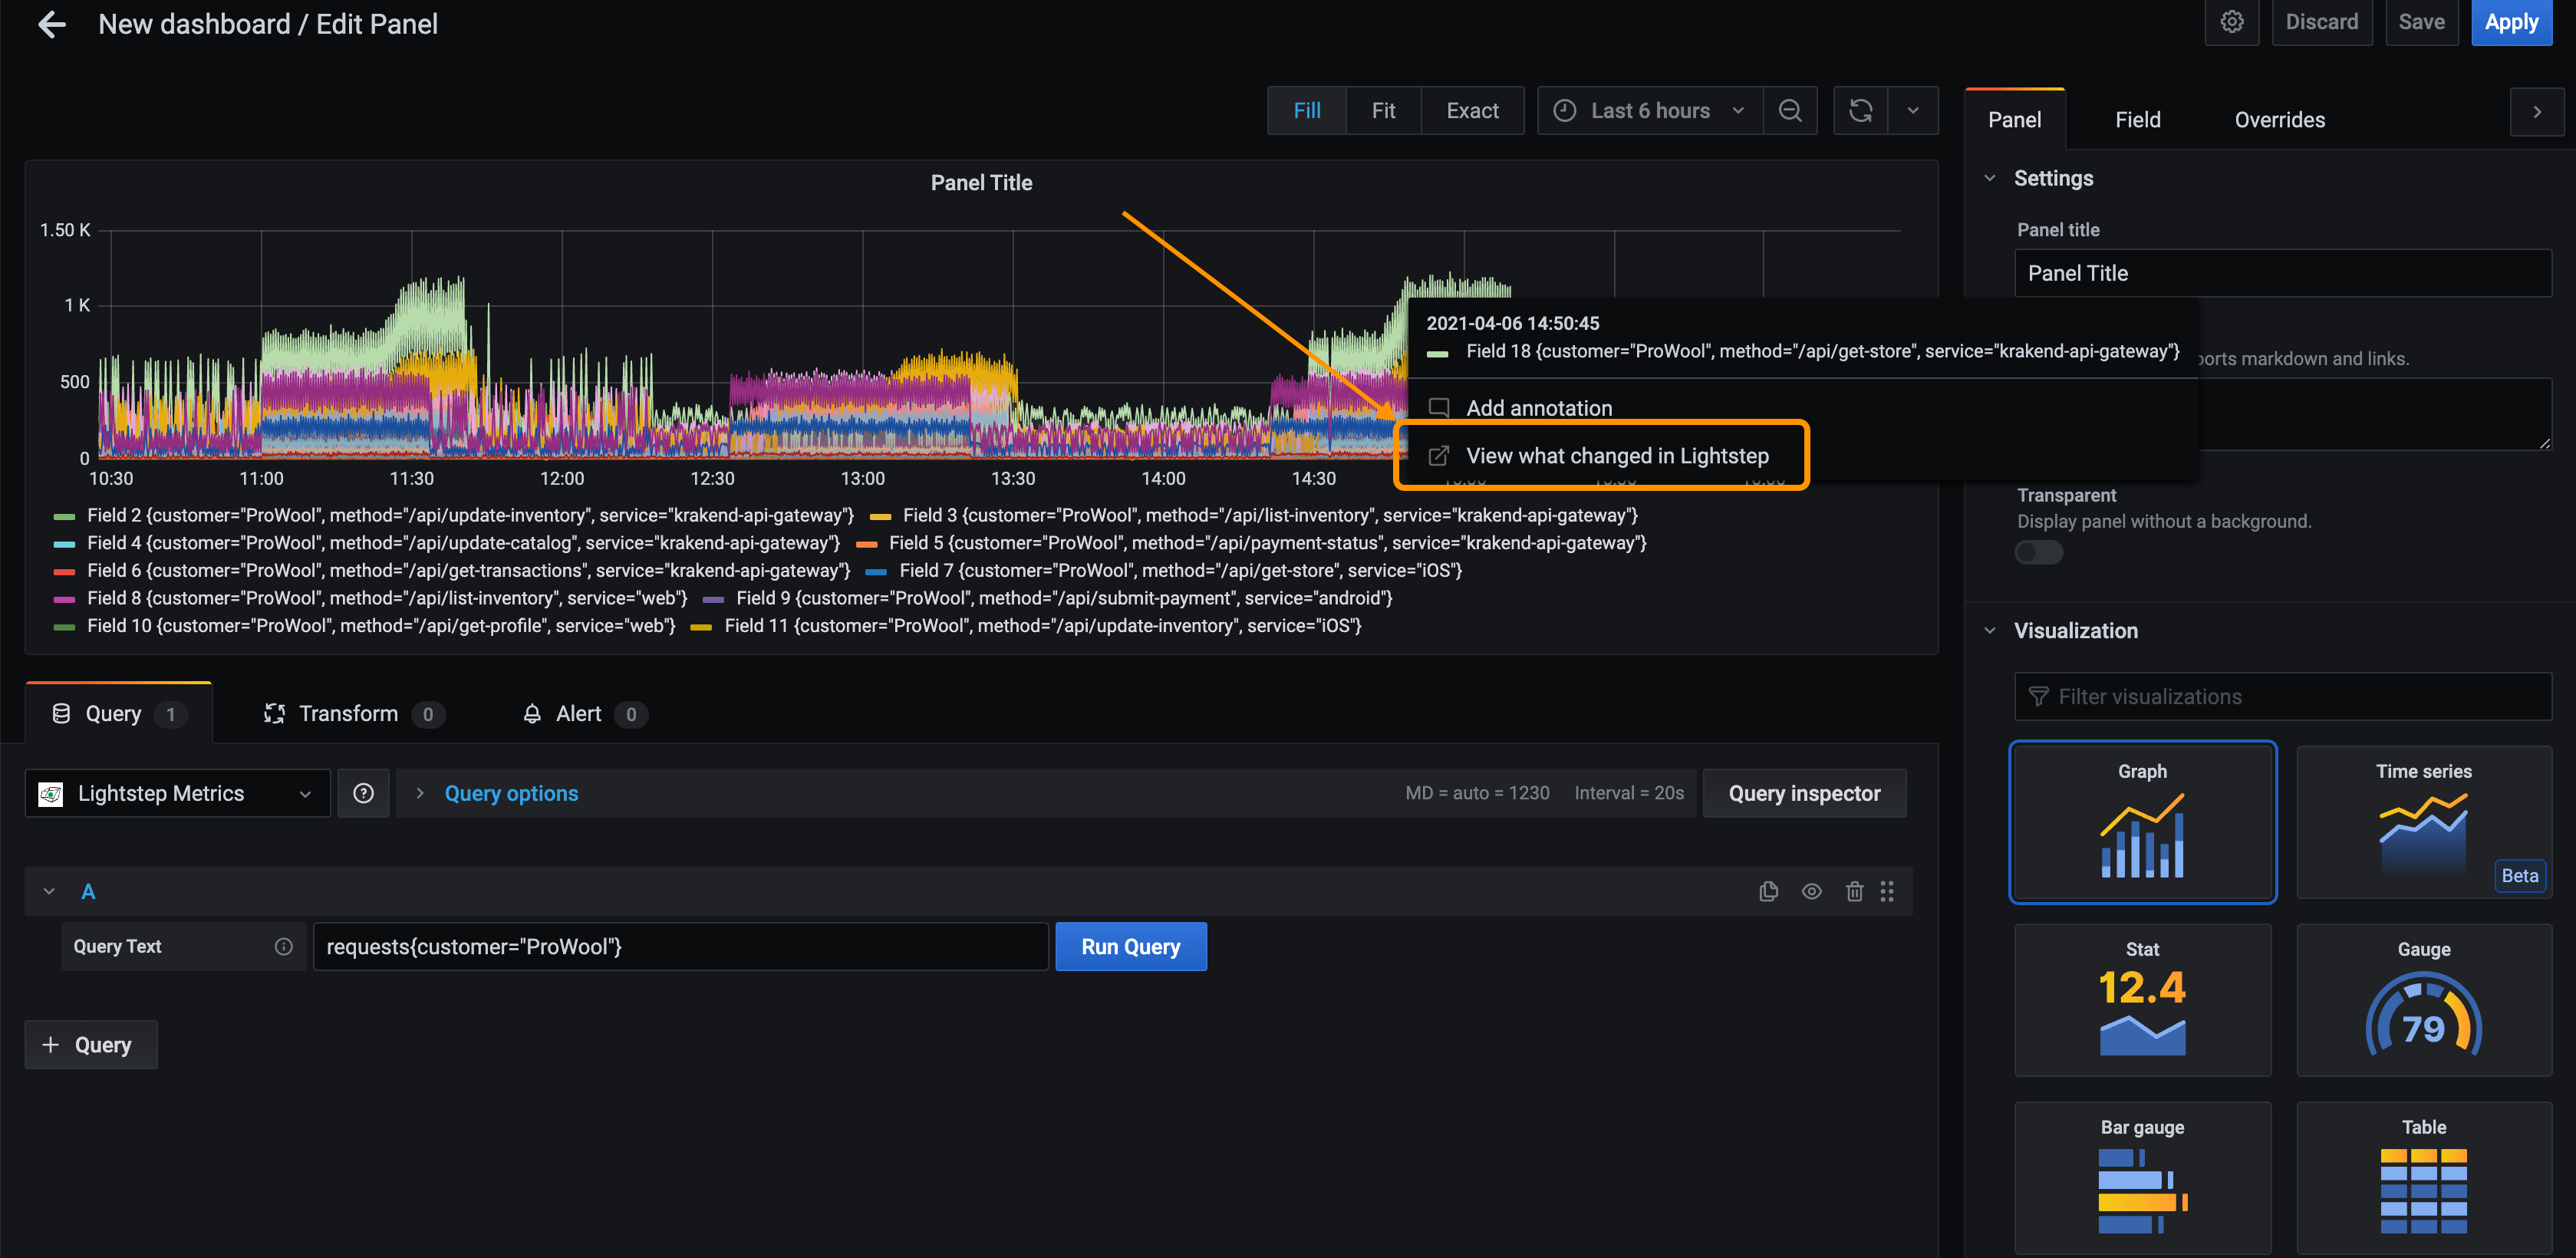
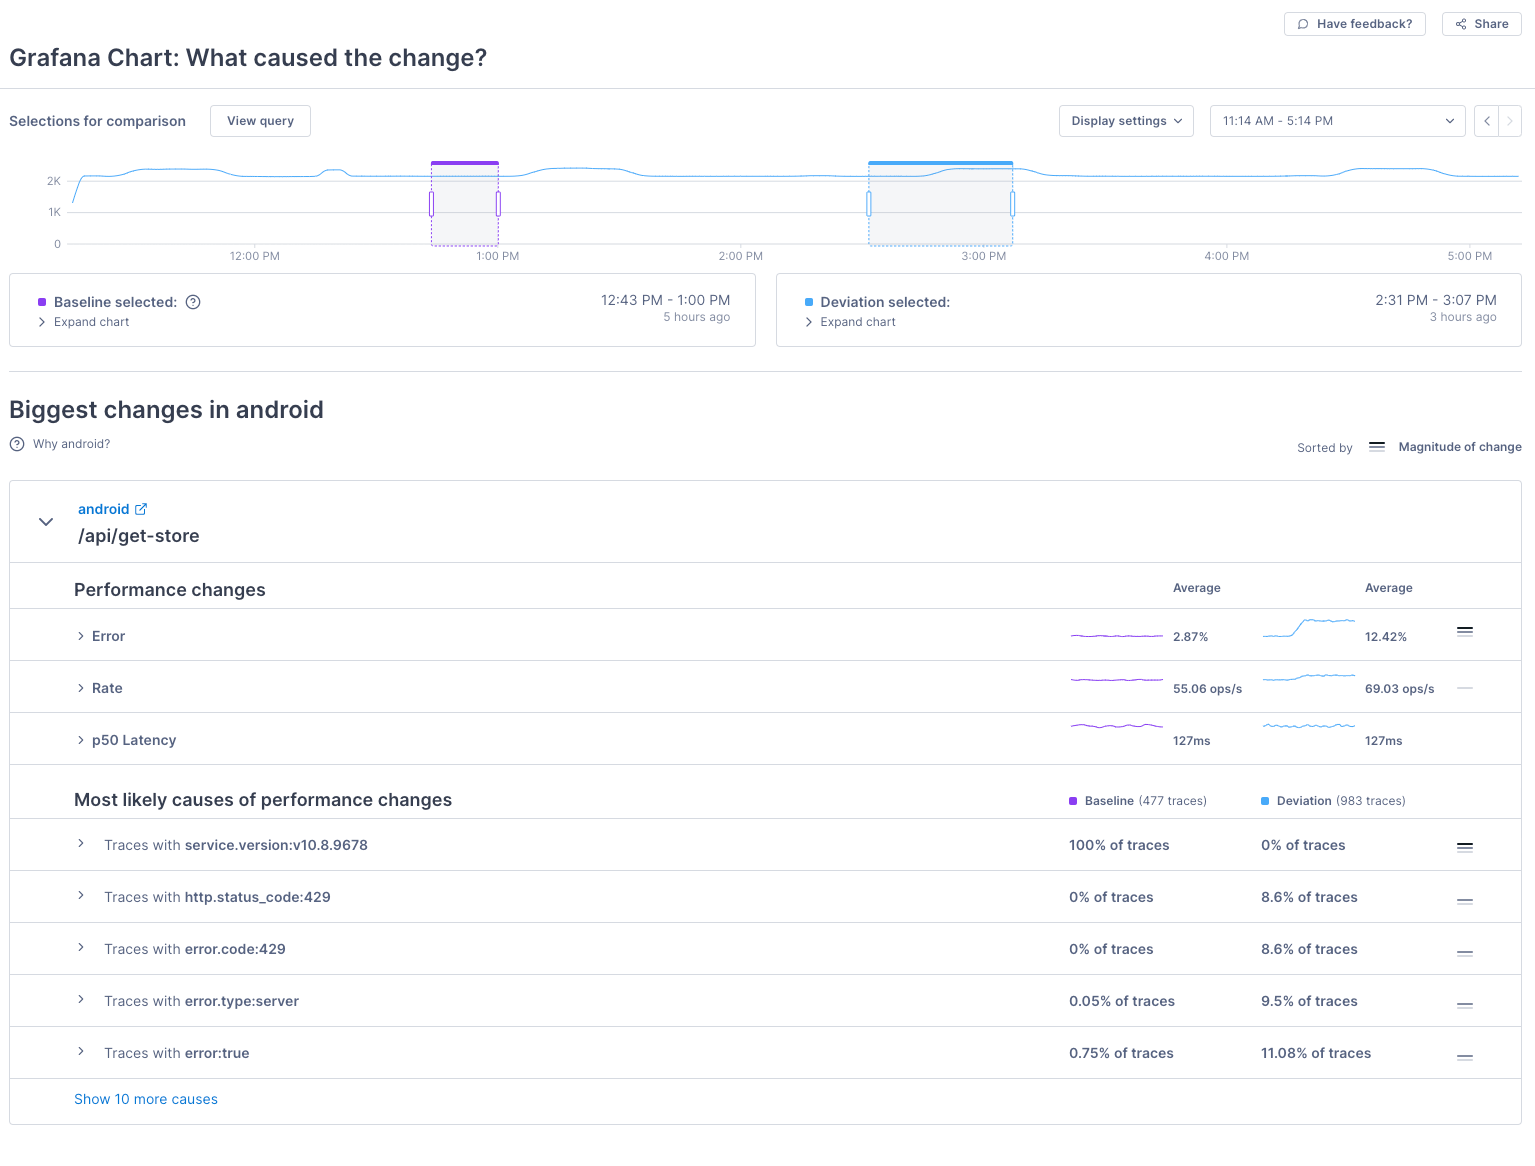
Lightstep’s powerful metrics reporting and analysis are now available for Grafana users. Using the new Lightstep Metrics plugin for Grafana, you can view metrics data reported to Lightstep directly in your Grafana instance. When you notice a change in your system, you’ll be able to investigate what caused it by clicking in a chart to navigate to Lightstep’s Change Intelligence. Today we’ll look at how we created this new tool.
Creating the plugin
In order to show metrics data reported to Lightstep in Grafana, we created a data source plugin. Grafana data source plugins enable working with external data sources by fetching and then transforming data into a Grafana-compatible format. Grafana provides easy-to-use resources for creating these plugins, including a tutorial and a CLI toolkit. You can view the source code for the finished plugin on GitHub at lightstep/lightstep-metrics-datasource.
Using grafana-toolkit, we started by creating the plugin source files from a template with the plugin:create command, which generated all of the files needed to get started:
ConfigEditor.tsxReact component for the plugin configuration UIQueryEditor.tsxReact component for writing chart queriesdatasource.tsThe data fetching and transformation functionstypes.tsPlugin’s shared TypeScript type definitionsplugin.jsonThe plugin general information and metadata definition
Using the Configuration Editor
In order to request metrics data from Lightstep’s public API, we need to allow users to configure the data source with their org, project, and API key information. The Grafana Configuration Editor provides a standard set of UI input elements using the form field components from the @grafana/ui package.
For security, the API key is managed as sensitive data, using Grafana’s secureJsonData mechanism. By saving the API key value as a secureJsonData value, Grafana automatically encrypts the value on the server before it is stored. After encryption, the API key value can no longer be accessed from the browser. Query requests from Grafana are passed through a data source proxy, which includes the API key value for authenticating requests against the Lightstep public API.
The Grafana plugin provides helpful types for defining the configuration editor values:
/**
* These are options configured for each DataSource instance
*/
export interface LightstepDataSourceOptions extends DataSourceJsonData {
  orgName: string;
  projectName: string;
}

/**
* Value that is used in the backend, but never sent over HTTP to the frontend
*/
export interface LightstepSecureJsonData {
  apiKey?: string;
}
Querying the Lightstep API
Now that we can configure the plugin, we’re ready to start making API requests to Lightstep’s public API to fetch metrics data. In datasource.ts, the query function defines the data fetching and transformation logic. Inside this function, we convert the data returned from Lightstep to a Grafana-compatible format.
The final step in actually fetching data is defining the data source proxy route executed by the server:
{
  "path": "query",
  "url": "https://api.lightstep.com/public/v0.2/{{ .JsonData.orgName }}/projects/{{ .JsonData.projectName }}/telemetry/query_timeseries",
  "headers": [
    {
      "name": "Authorization",
      "content": "Bearer {{ .SecureJsonData.apiKey }}"
    },
    {
      "name": "Content-Type",
      "content": "application/json"
    }
  ]
}
Converting to WideDataFrames for improved performance
The metrics data returned by Lightstep provides a dataset sorted by timestamps for every series (query) requested.
data:
  attributes: {
    series: [
      { points: [[6, 123], [9, 124], [12, 125], …] },
      { points: [[17, 123], [24, 124], [19, 125], …] },
      ...
    ]
  }
}
To use this metrics data in Grafana, we transform it into DataFrames, specifically WideDataFrames. Using WideDataFrames significantly sped up the Grafana chart rendering performance. WideDataFrames share a time property for representing time series data. So instead of creating individual DataFrames for each series, each with its own time field, we store the data for the series together, with a single time field.
[
  { type: FieldType.time, values: [123, 124, 125] },
  { type: FieldType.number, values: [6, 9, 12] },
  { type: FieldType.number, values: [17, 24, 19] },
  ...
]
Secret sauce: Linking to Change Intelligence
The final, and perhaps most exciting, update is adding the ability to link to Lightstep’s Change Intelligence feature in the Grafana charts. To accomplish this, we automatically generate Data Links for each series in our data source by adding a links configuration:
[
  {
    type: FieldType.number,
    values: [6, 9, 12],
    links: [
      {
        url: `https://app.lightstep.com/${projectName}/chart-relay?${query}`,
        targetBlank: true,
        title: 'View what changed in Lightstep',
      }
    ]
  },
  ...
]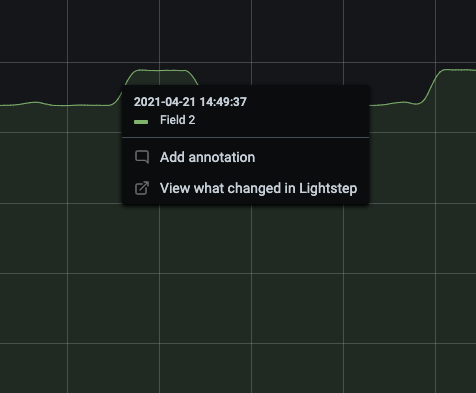
With this set up, clicking on a point on the graph gives you a datalink with a custom URL to Lightstep Change Intelligence.
Next steps
To get started with the Lightstep Metrics plugin for Grafana, check out the plugin page and docs. To learn more about our Change Intelligence, read our blog or watch our demo.

