
Streaming real-time sensor data to Grafana using MQTT and Grafana Live
Within the world of robotics and automation one of the most recurring needs is that of capturing and visualizing real-time data from hardware components such as sensors and actuators, which provide insights into how a system is behaving overall and helps diagnose any potential issues that might arise overtime.
Historically, it has required quite a bit of custom development effort with complex tooling to be able to stream such data onto dashboards within typical analytics and visualization tools, including Grafana. But with the release of Grafana 8.0, it has become much easier to be able to stream and visualize real-time data using the new streaming API that was introduced as part of the Grafana Live feature.
(Note: By “real-time” we mean “soft real-time,” since due to network latencies, garbage collection cycles, protocol limitations, etc., the delays with message delivery might be upwards of several hundred milliseconds.)
Here we will look at one such application of Grafana’s brand-new streaming capabilities in the context of a sensor system communicating over the MQTT messaging protocol, leveraging the Grafana Live streaming API within a backend datasource plugin.
The setup
MQTT is a light-weight publish-subscribe network protocol that is typically used for messaging between devices over TCP/IP. Originally developed by IBM, the MQTT protocol has gained widespread use for machine-to-machine communication in bandwidth-constrained environments where compact data transport is a strict requirement.
Grafana Live is an integrated real-time messaging engine built into Grafana that was introduced as part of the v8.0 release. It is based on a publish-subscribe framework which communicates over the WebSocket protocol and allows any type of event data to be pushed to the frontend client(s) as soon as it occurs.
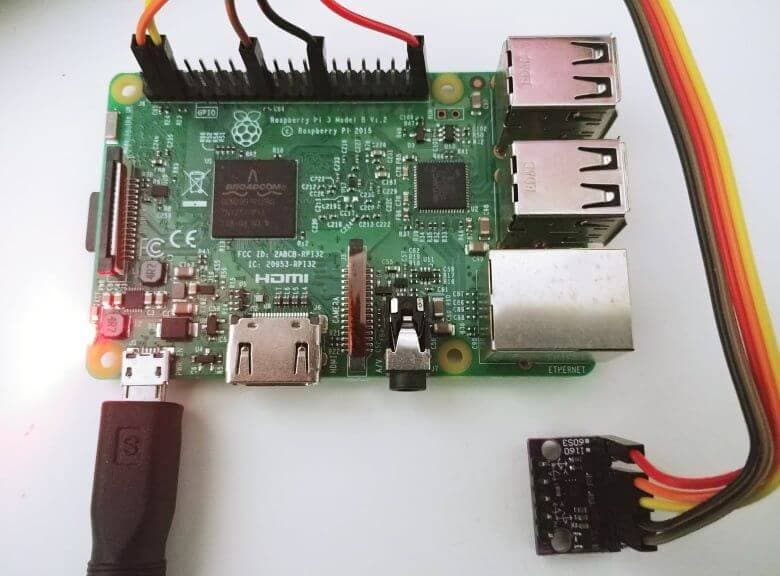
In order to demonstrate an applicable real-life scenario we used a simple IMU-based attitude sensing board and connected it to a Raspberry Pi to stream both the accelerometer and gyroscope data over MQTT.
The sensing board is based off of a very widely used, versatile, and off-the-shelf IMU, BMI160 from Bosch Sensortec. It is a compact, low-power, low-noise 6DOF IMU that is typically found in smartphones and wearable devices. The sensor board was connected to a Raspberry Pi over its I²C interface, and we used a Python script to extract and periodically publish the sensor data to a Mosquitto MQTT broker, both running locally on the Pi.
In order to fetch the streaming sensor data into a Grafana instance on a separate machine, we installed and used the Grafana MQTT Datasource plugin on that machine. (For details on the installation procedure for the MQTT Datasource plugin refer to the README in the GitHub repository.) The plugin uses an integrated MQTT client to subscribe to MQTT topics and the Grafana Live streaming API to publish them to the event stream in the Grafana Live engine. The datasource was configured to connect to the Mosquitto MQTT broker running locally on the Pi.

For our dashboard, we used the time-series panel, which was previewed in the v7.4 release, to visualize the accelerometer and gyroscope data for all the axes separately. And we used the newly released timeline panel to detect movements on either of the three axes. These visualizations can be very useful in systems where anomalies and imbalances manifest themselves with excessive movements or rotations around a certain axis. Furthermore, these kinds of dashboards can be very critical in maintaining oversight over dynamic systems which have sophisticated attitude control mechanisms in place to maintain stability and functionality.


The demo
Here is a live demonstration of what the final result looks like. Note how the time-series trends respond to the changing orientation and rotations around all three axes of the sensing board, and how useful the state timeline is in terms of independently detecting movement on any axis.
Conclusion
This simple application shows how powerful the new streaming API is in Grafana, especially when coupled with all the different visualizations, as they all work natively with this feature. It opens up the doors to various communication protocols and hardware platforms for data streaming through Grafana’s flexible plugin-based architecture.
If you are interested in implementing streaming capabilities for your own applications, be sure to check out our guide for developing your own streaming backend datasource plugin.

