Grafana Community Plugin Showcase: August 2021
The power of community makes Grafana one of the most composable platforms for monitoring and observability across a wide variety of use cases. The Grafana Plugin Directory features not just plugins created by our team here at Grafana Labs, but by Grafana community members all over the world. It’s the best place to browse for new data source integrations, panels, and applications you can install on your dashboard to extend Grafana’s functionality. If you have a Grafana dashboard hosted on Grafana Cloud, you can install new plugins right from the directory listings in just a couple of clicks!
Over the past several months, we’ve been working with community plugin authors on improving our process for reviewing new plugins. Earlier this year, Grafana Labs Developer Advocate Marcus Olsson published a fantastic blog post that outlined 6 tips for improving your Grafana plugin before you publish. As a result, we’ve had quite a lot of submissions for plugins to add to the directory! Here are a few newer additions to the Grafana plugin ecosystem you should check out:
Apache Cassandra
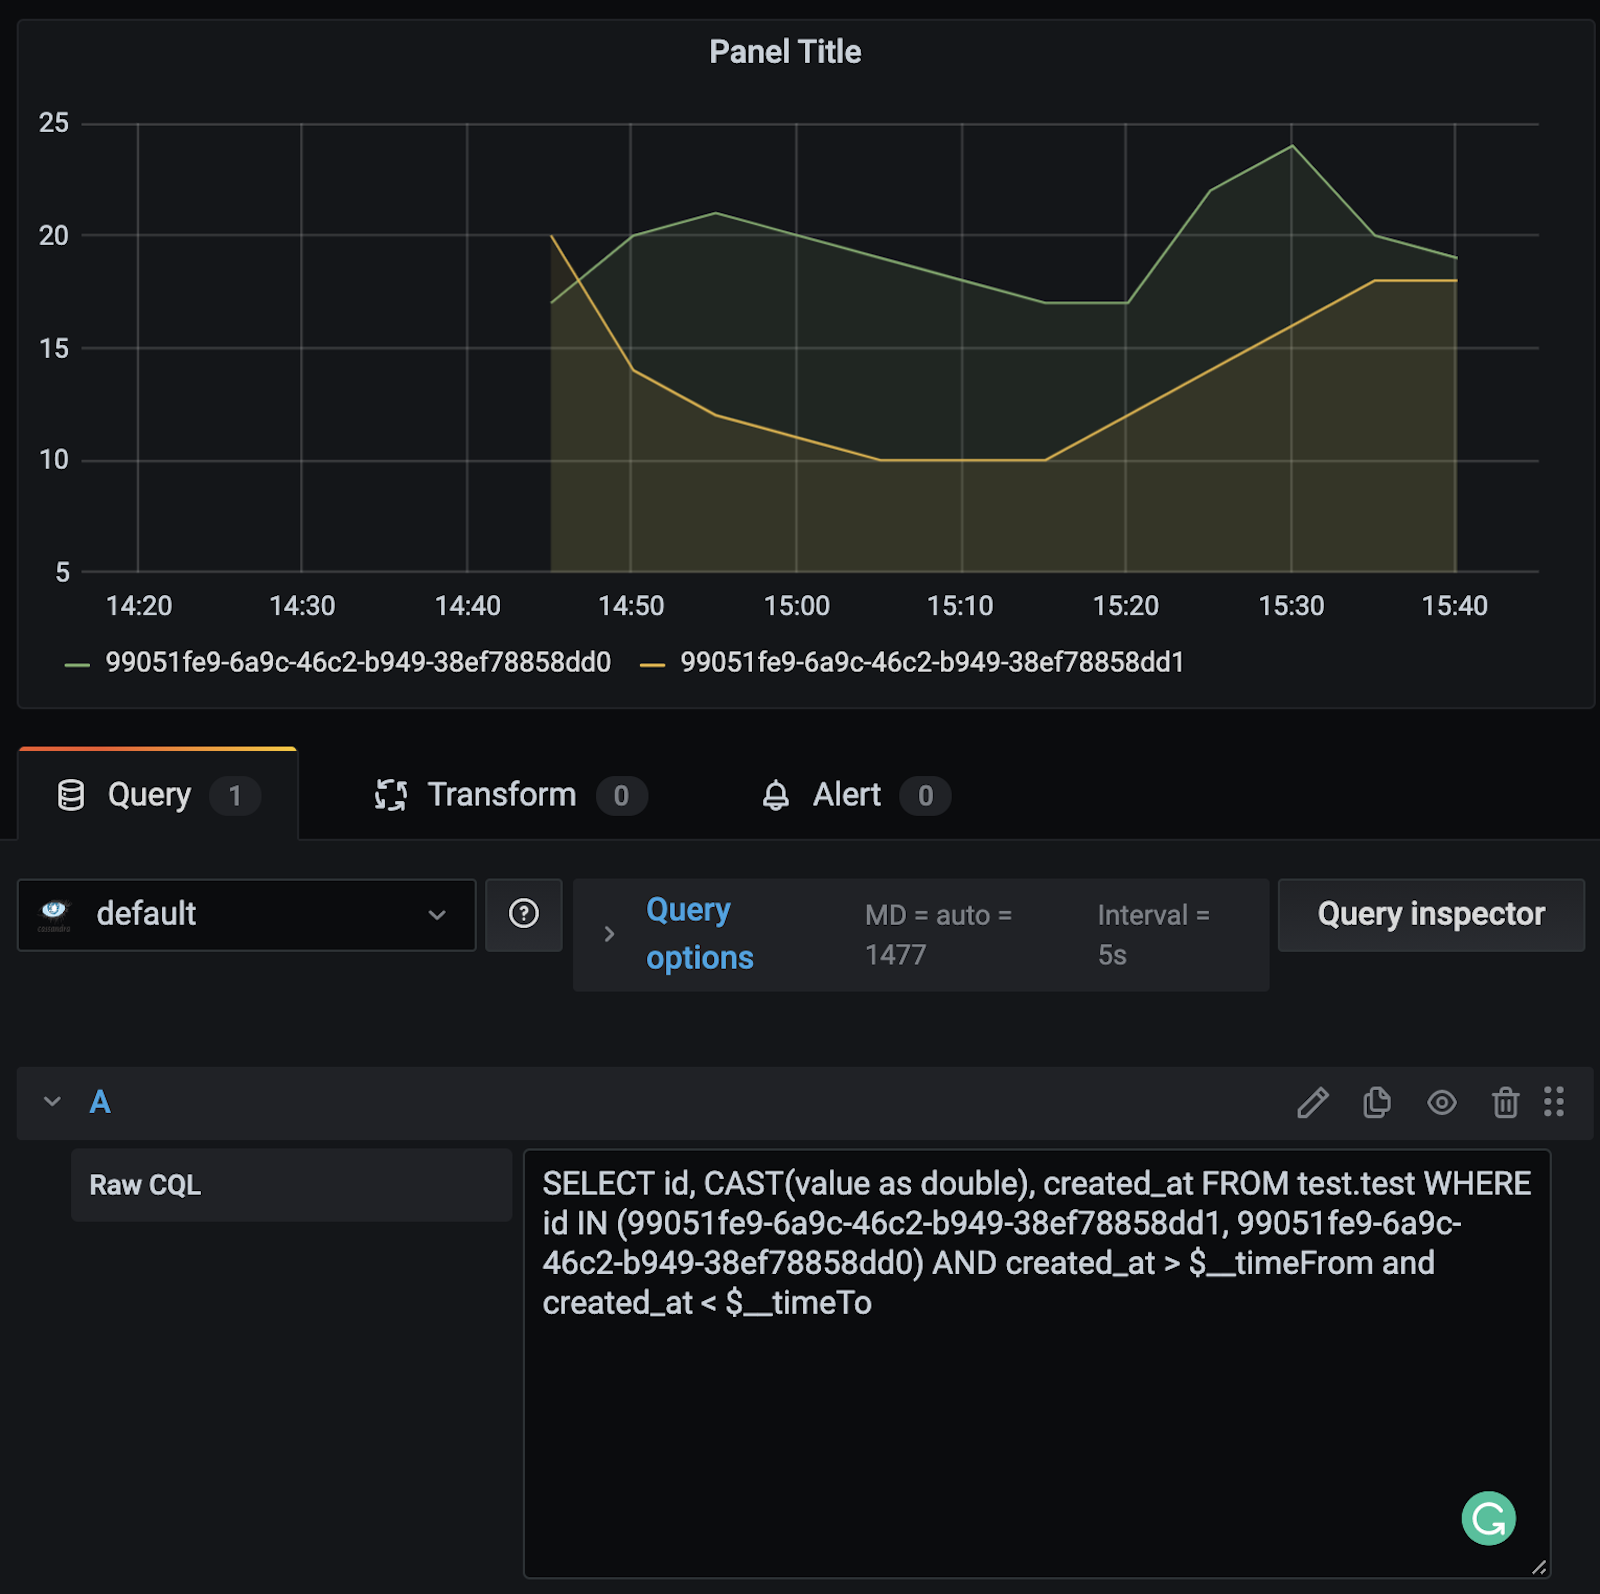
Every now and then over the years, we’d get a few requests for Grafana to add an Apache Cassandra data source. But as with any large-scale open source project, we just didn’t have enough interest — compared to other feature requests — to prioritize getting it into the roadmap and commit to ongoing maintenance. Fortunately for the Cassandra users in the Grafana community, Developer Advocate Aleksandr Volochnev from DataStax answered the call and contributed this plugin, which is compatible with Grafana versions later than Grafana 5 and Cassandra 3.x.
Simple gRPC Datasource Plugin
gRPC is a modern, open source, high-performance Remote Procedure Call (RPC) framework that can run in any environment. It’s a popular choice for connecting services in and across data centers with pluggable support for load balancing, tracing, health checking and authentication. It’s also commonly used in the last mile of distributed computing to connect devices, mobile applications, and browsers to backend services.
This simple gRPC data source plugin for Grafana was built by Ron van der Wijngaard, a Senior Software Engineer at innius. According to Ron’s README, the plugin “comes with a dedicated API specification that requires implementation in the data provider’s back-end. Implementing this API helps to decouple the front-end visualisation solution from the back-end data-layer implementation, leaving developers with the necessary freedom to update and improve the back-end without breaking the end-user experience.”
Druid
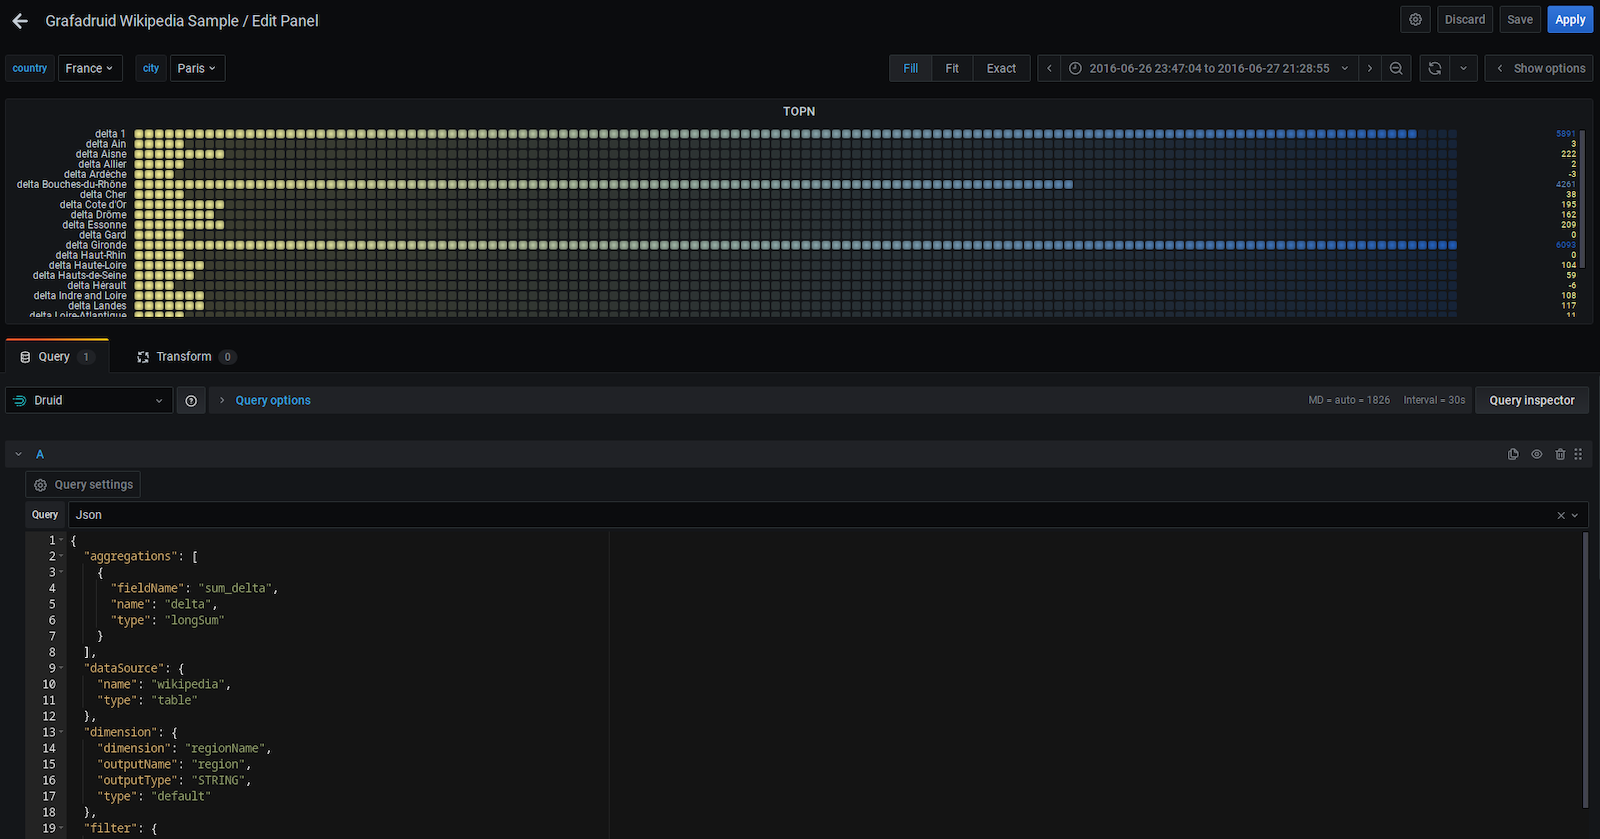
Apache Druid is a real-time analytics database designed for fast slice-and-dice analytics (“OLAP” queries) on large data sets. This data source for Druid, developed by Jean Baptiste Guerraz, Co-founder and CTO of Skilld, currently features:
Druid queries: SQL, timeseries, topn, groupby, timeboundary, segmentmetadata, datasourcemetadata, scan, search, JSON
- Variables: Grafana global variables replacement, query variables, formatter druid:json (provide support for multi-value variables within rune queries).
- Alerts
- Explore
- Logs
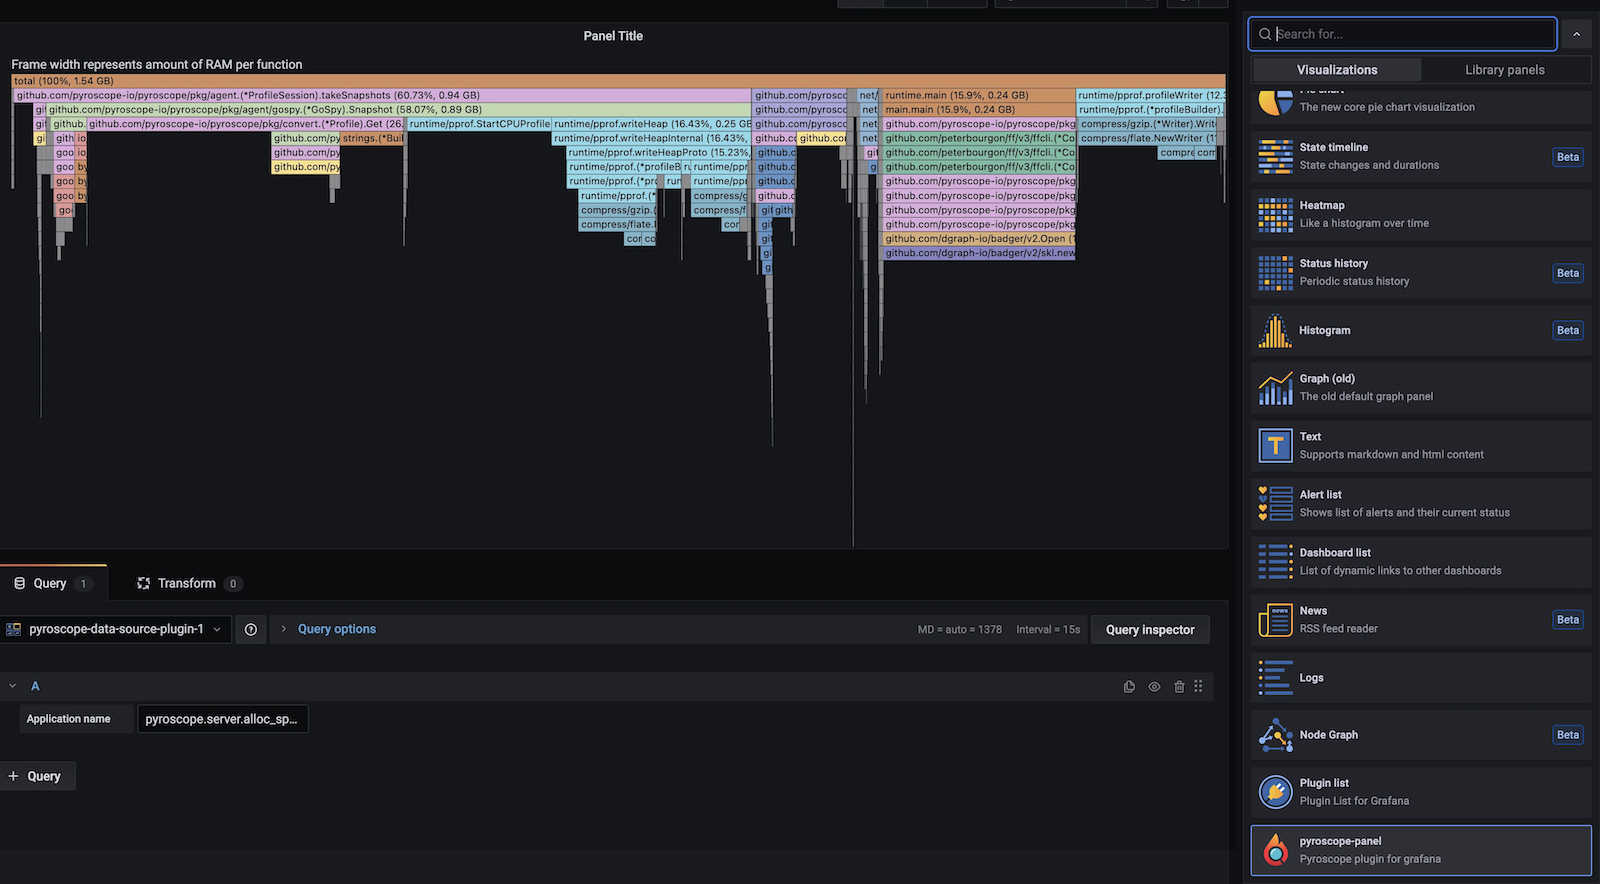
Pyroscope data source plugin & Panel Plugin
The team at Pyroscope went the extra mile by building not only a data source plugin for their own open source continuous profiling platform, but also submitting a wonderful panel plugin with custom visualizations. This makes it easier to build debugging dashboards inside Grafana by correlating continuous profiling data from Pyroscope alongside other data sources for your metrics, logs, and traces. They offer a public Grafana demo dashboard where you can see both plugins in action.
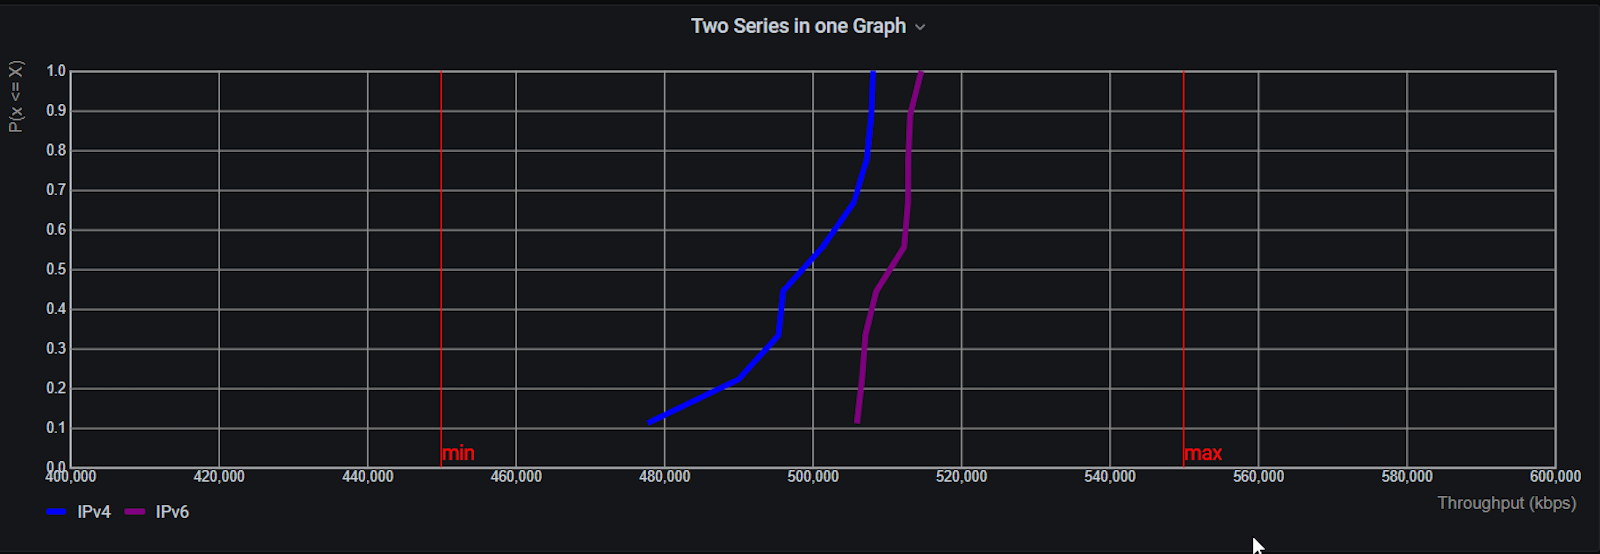
Cumulative Distribution Function (CDF) Panel
This panel plugin developed by T-Mobile 5G Integrations Engineer Sebastian Gunreben makes it possible to add more “predictive” metrics into your dashboards and track how well your “real” metrics meet these predictions. Use this panel to visualize the frequency/probability P of a certain value “x” to be less than “X”. By adding the CDF panel, you can start to see the amount of outliers not fitting into the expectation of the value distribution.
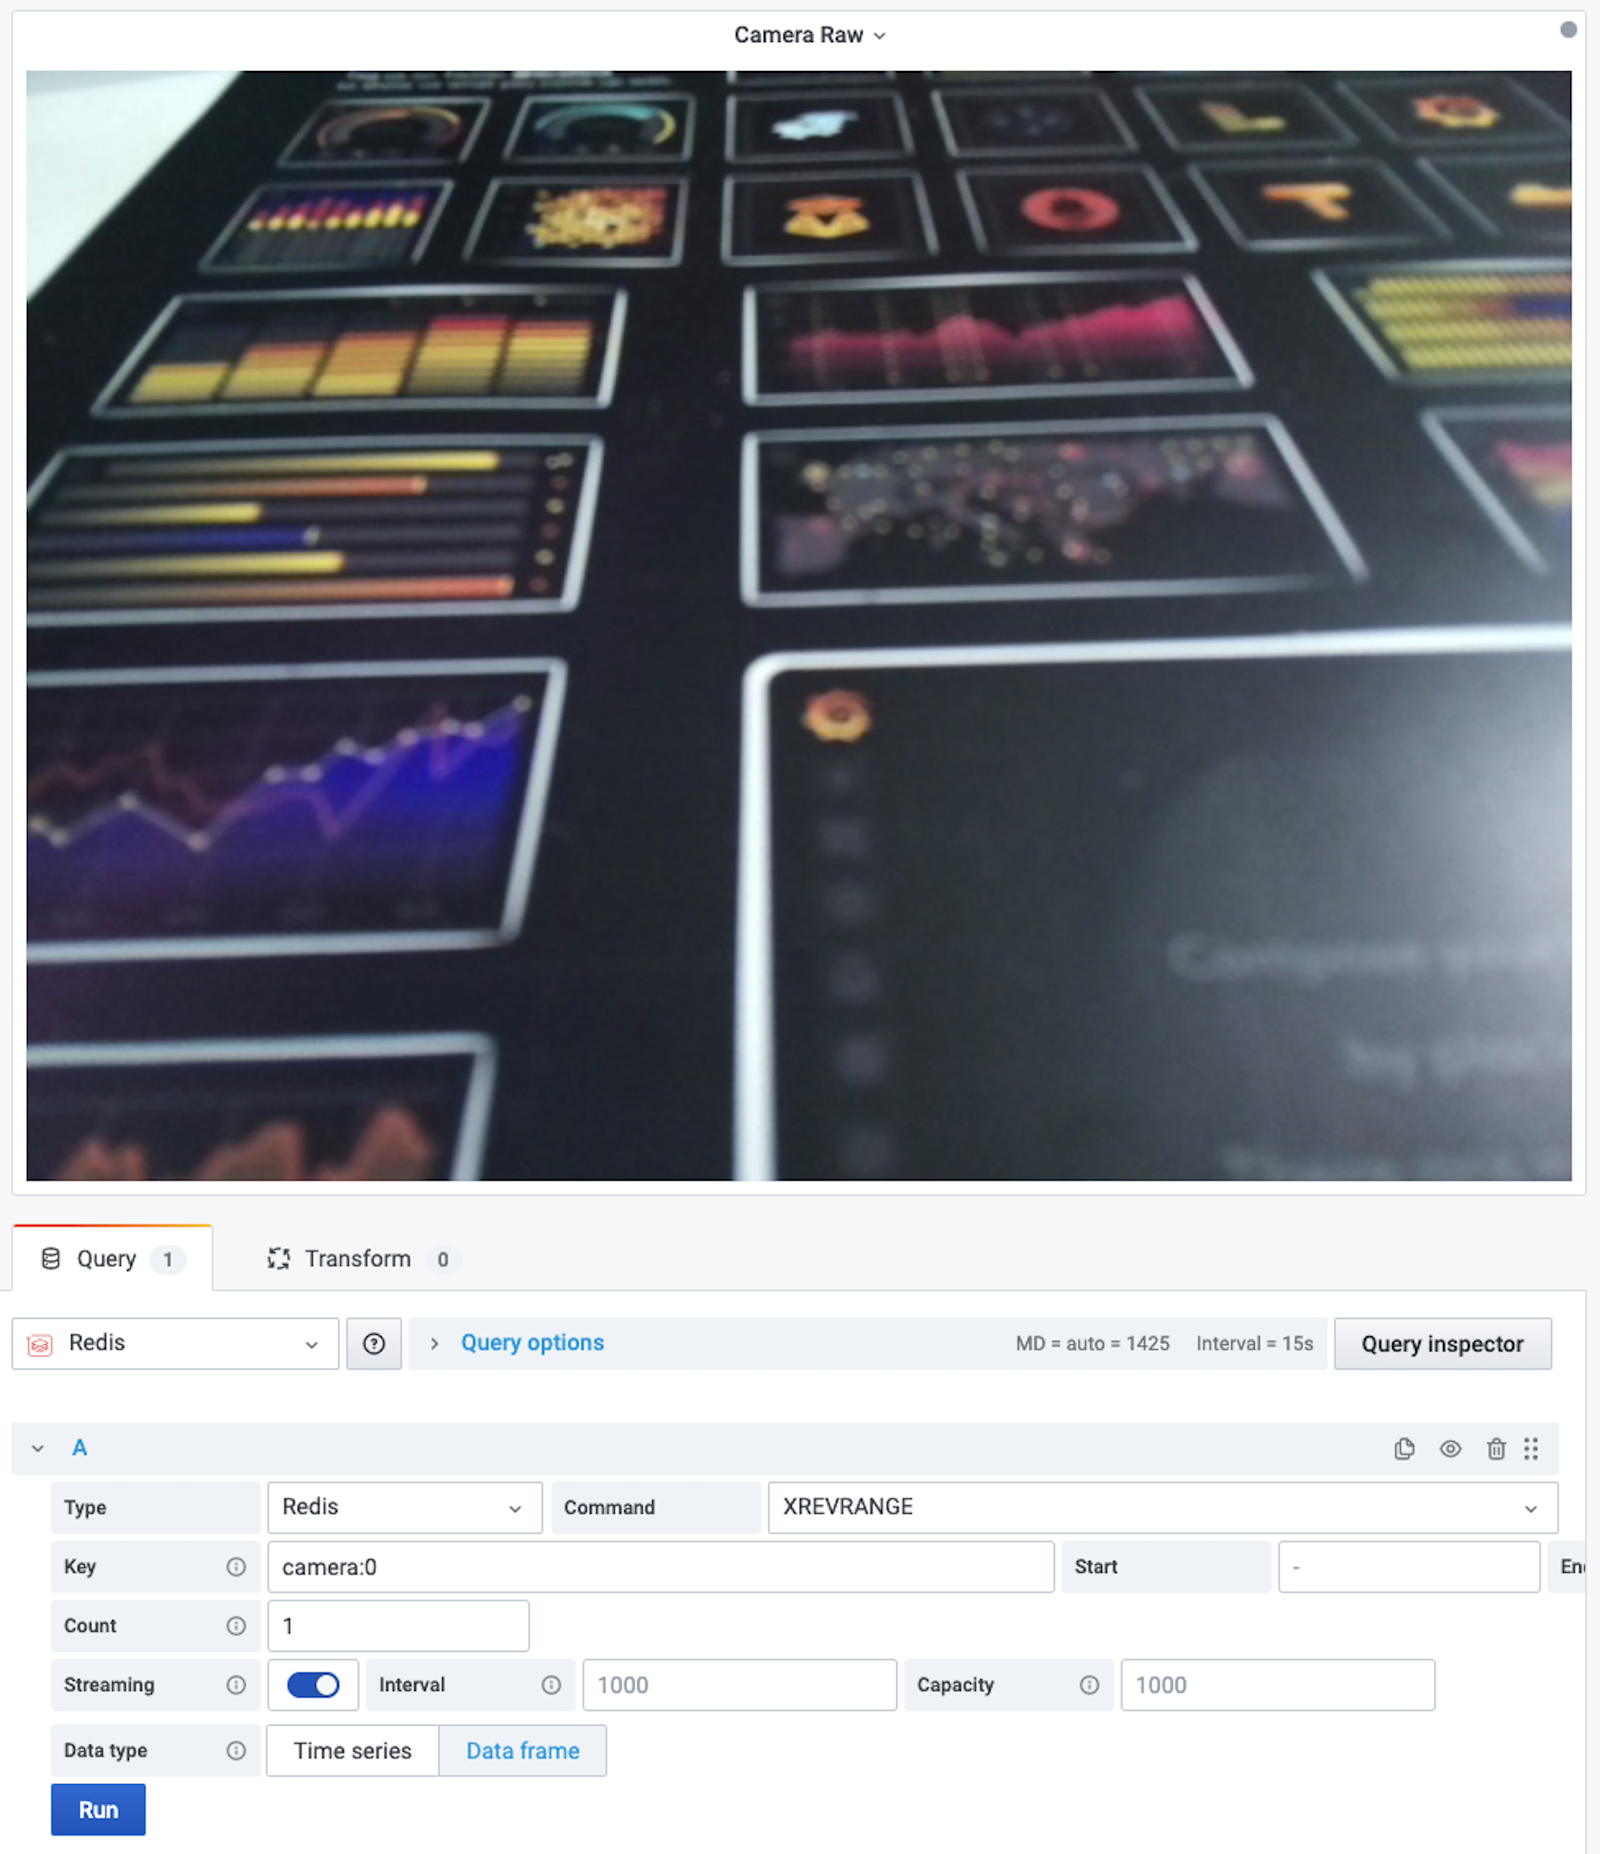
Base64 Image/PDF panel plugin for Grafana
Volkov Labs, an agency specializing in custom plugin development for Grafana and founded by long-time Grafana contributor Mikhail Volkov, has contributed a new Base64 Image/PDF panel plugin. For those who don’t have access to change Grafana’s configuration settings to allow embedded PDFs via Text file’s HTML support, this plugin makes it possible to embed Base64 encoded versions. It also works for Base64 encoded files in PNG, JPG, and GIBasF as well. If you’re looking for some inspiration, check out this fun “BatCam” tutorial project featuring the Base64 Image/PDF Grafana panel plugin alongside several others.
Ready to build your own plugin?
If you’re just getting started developing your own custom plugins for Grafana, be sure to review our Grafana Plugin Development documentation. The docs are full of great resources on how to start building Grafana data source, panel, and application plugins. For visualization plugins, don’t miss our on-demand webinar Building Your Own Panel Plugin. And if you’ve already built a Grafana plugin of your own and want to show it off to the wider community, consider applying to be a Grafana Meetup Speaker (you could give an 8-15 minute demo presentation) or drop us a note at stories@grafana.com. We can’t wait to see what you’ve been building!