
Grafana 8.1 released: New Geomap and Annotations panels, updated plugin management, and more
We are excited to announce the release of Grafana 8.1. This release builds upon our promise of a composable, open observability platform with new visualizations and dynamic panel configuration options while extending the functionality we launched in Grafana 8.0.
You can get started with Grafana in minutes with Grafana Cloud. We have free and paid Grafana Cloud plans to suit every use case — sign up for free now.
And now, on to the highlights for 8.1.
Introducing the Geomap panel
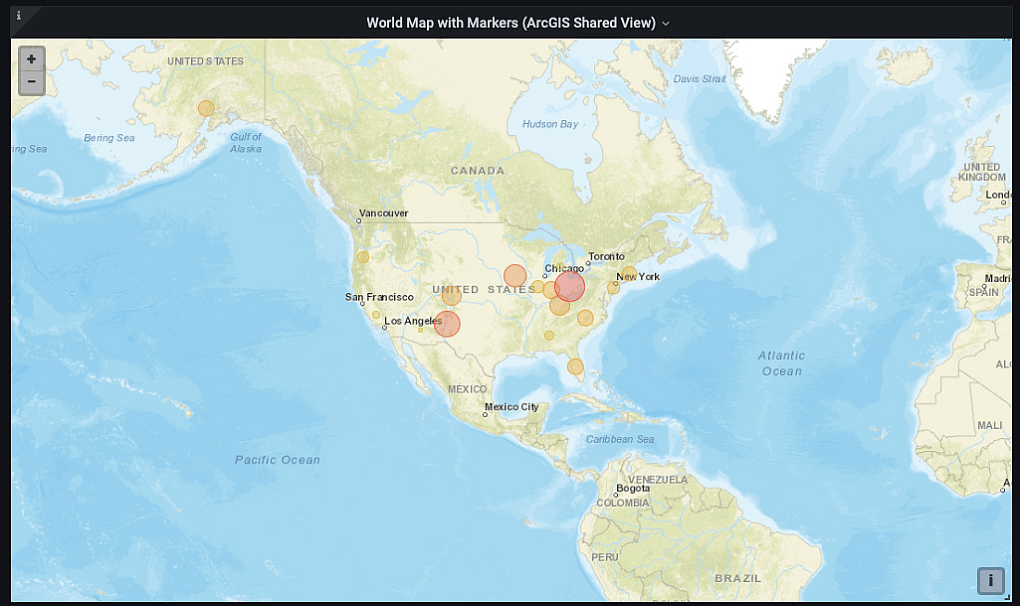
The first of the two new panels we’re introducing in 8.1 is the Geomap panel. The Geomap panel is the long-awaited replacement for the WorldMap panel.
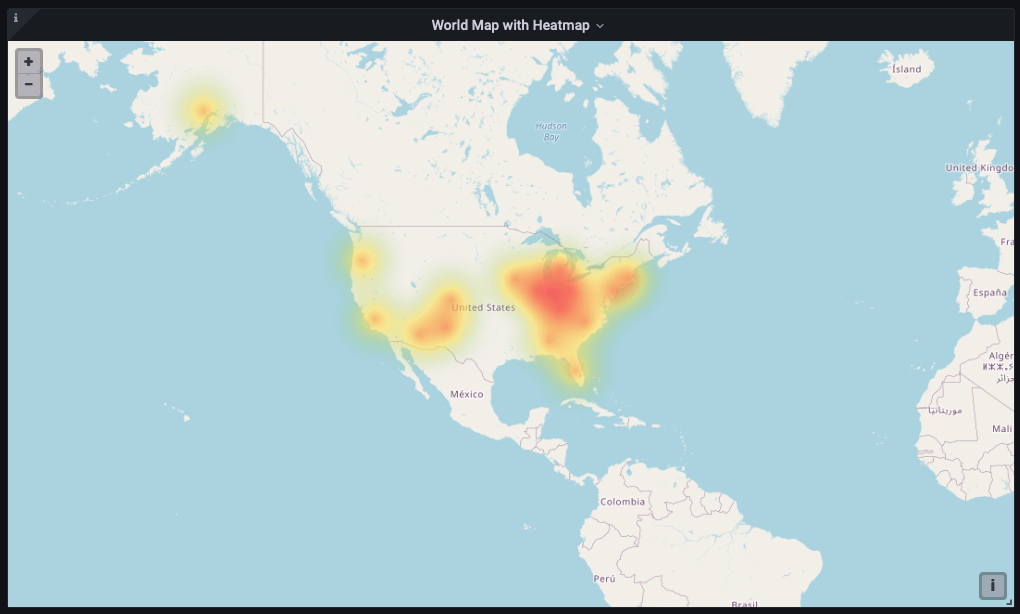
The Geomap panel brings with it some exciting new additions, including the ability to define custom base tile layers. The panel also ships with multiple map layer options, such as Open Street Maps and a number of ArcGIS options, as well as the existing Carto tile set. If you like the current Carto map, you can also switch between light and dark themes.
Other new features include the ability to define the data layer, show the current map scale, and share the same view across multiple Geomap panels on the same dashboard. You can explore the options available in the Geomap panel documentation.
The new Annotations panel
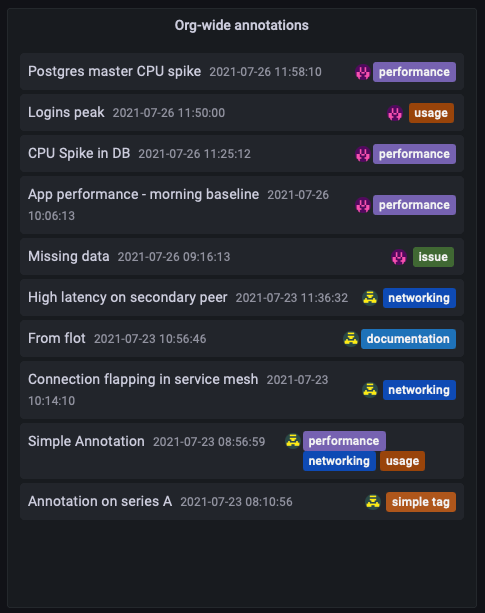
Also included in Grafana 8.1 is the Annotations panel. We heard from users that finding and exploring annotations can be a challenge. The annotations panel offers a configurable view into the annotations being used on a dashboard or across an organization.
This new panel allows you to list annotations, as well as query annotations by tag. You can even live filter by tag in the panel itself. Discover the configuration options in the Annotations panel documentation.
New features for existing panels
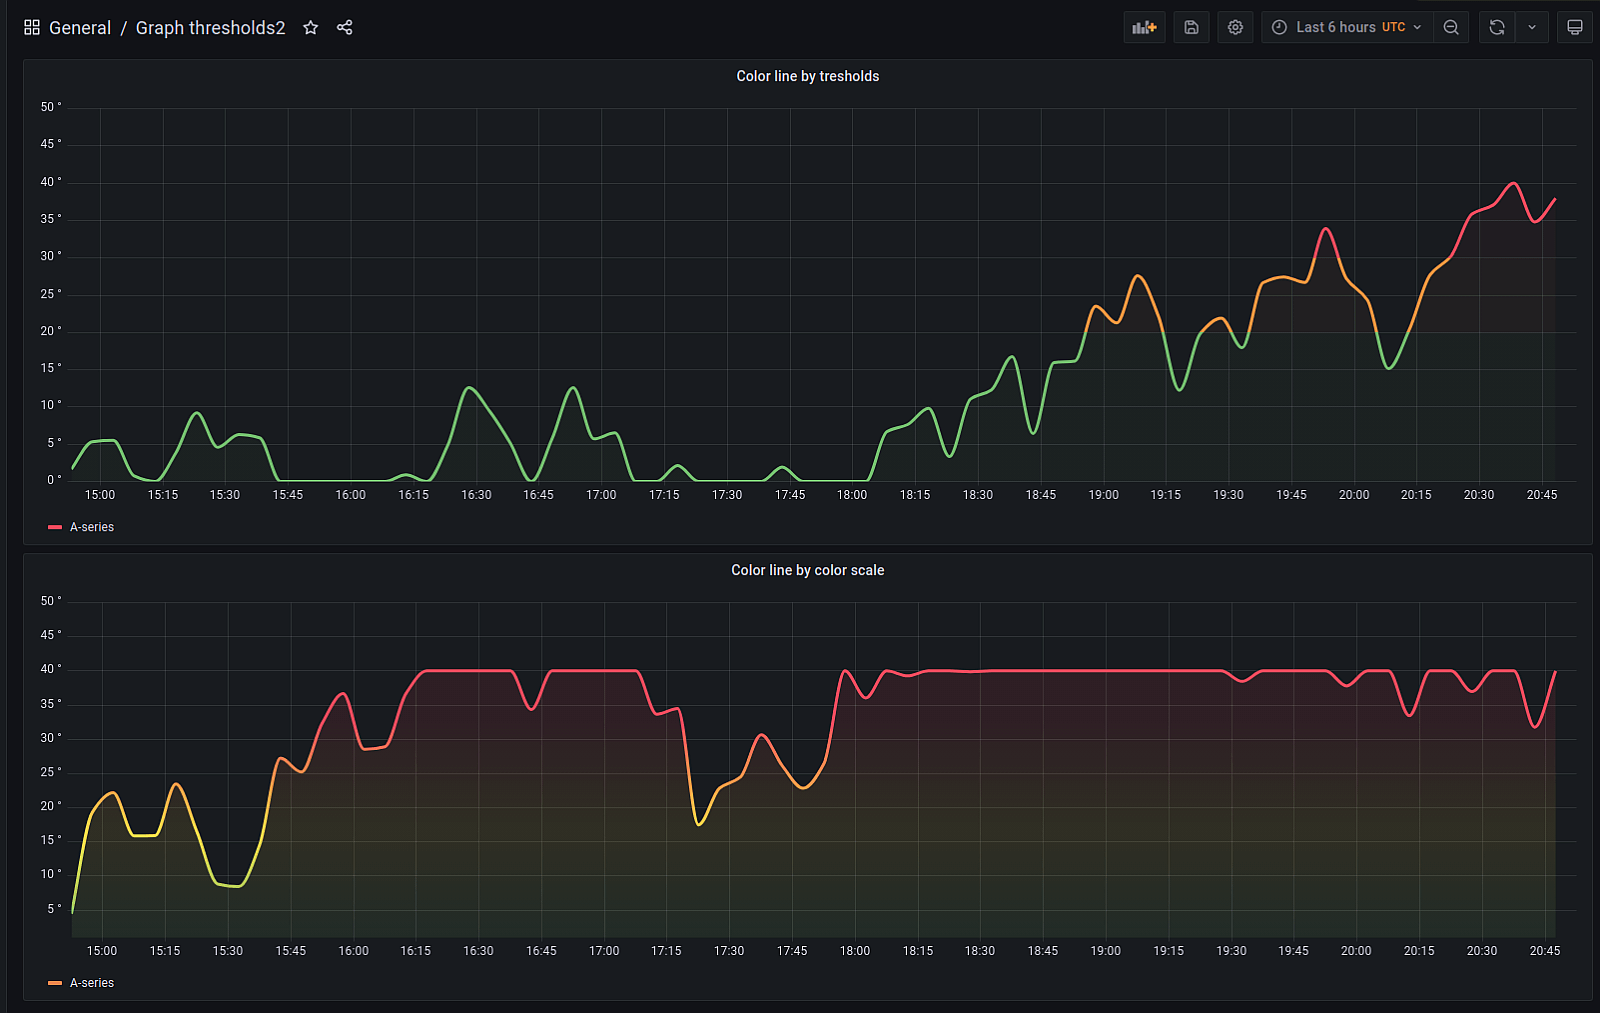
Speaking of annotations, they have also arrived for the Time Series panel. The Time Series panel now includes the ability to color lines by threshold values.
We’ve also got some significant updates to transformations, including the ability to dynamically set panel configuration from query results, the ability to convert rows to fields, and a new information area for each transformation to provide some quick, context-sensitive guidance on how to use the transformation.
Logs and traces
Grafana 8.1 includes changes far beyond visualizations as well. For logs and traces, we’ve included a new Prettify JSON option when you’re exploring logs. We’ve also changed some default behavior when creating a 1-hour span Loki query to only query the exact time the trace span started, for the duration of the span. There are additional changes, which you can read about in the trace to logs section of the Grafana documentation.
Plugins and data sources
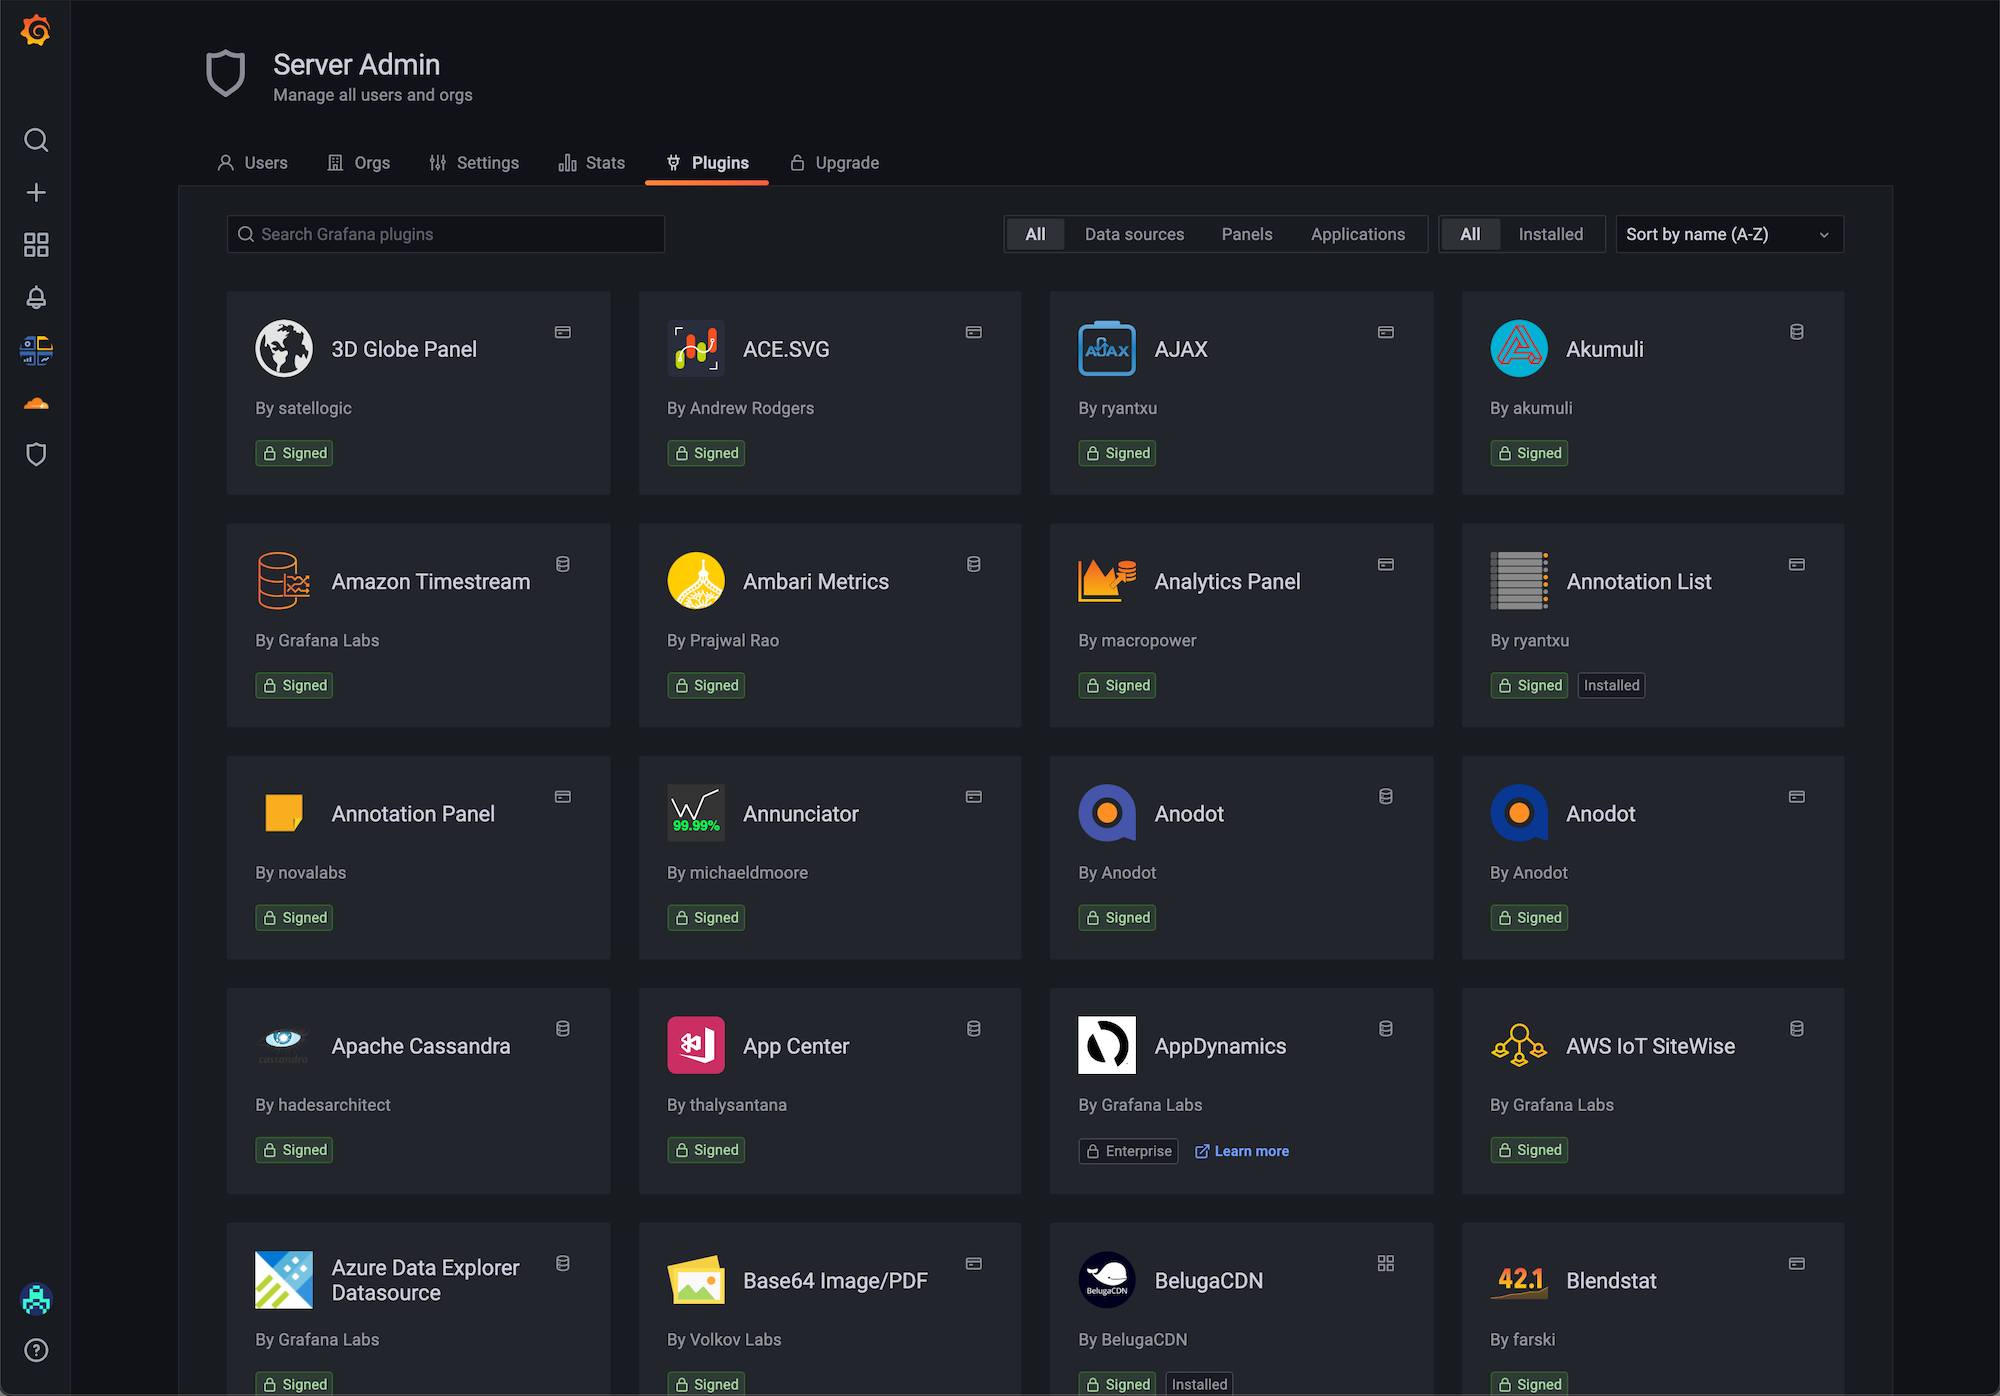
Plugins and plugin management are increasingly core to the Grafana experience. Grafana 8.1 brings with it a new UX for plugin management, which builds on the ability to load plugins without restarting Grafana (released in 8.0). You can now also see which plugins are installed while browsing for new plugins. The new UX for plugin management is in beta behind a feature flag. Read about how to enable it here.
Data sources have also seen some improvements, including time zone support in the MySQL data source and some Elasticsearch data source features we’ve been working on in partnership with Elastic, including support for searching frozen indices, rate aggregation, “top_metrics” aggregation and more. Read more about these features in this recent blog post.
Enterprise features
These features are included in the Enterprise edition. You can learn more about Grafana Enterprise on the product page, and contact us for a demo.
New permissions for fine-grained access control
Fine-grained access control was released as a beta feature in 8.0, giving Enterprise users the ability to customize permissions to access Users, Orgs, LDAP settings, and Reports in Grafana.
With 8.1, you can now grant or revoke permissions for Viewers, Editors, or Admins to use Explore mode, configure LDAP or SAML settings, or view the admin/stats or admin/settings pages. You can also modify some permissions for the built-in Viewer, Editor, and Admin roles, if you’d like users to have different access permissions than a given role allows by default.
For an overview of fine-grained access control (which is still in beta) and a complete list of available permissions, see the Fine-grained access control documentation.
New and improved reporting scheduler
Flexibility was our goal for the reporting scheduler. In 8.1, you can now choose to send a report at custom intervals, such as every 4 hours or every 2 weeks. You can also send a report for a limited time period by providing a start and end date, or only on weekdays or, say, on the last day of each month. This change accompanies some other recent improvements to Reporting, like the ability to choose template variables for reports and an improved UX for authoring reports. Learn more in the Grafana Enterprise Reporting documentation.
White labeling for the Grafana loading logo
White labeling in Grafana Enterprise allows you to change the look and feel of Grafana to match your product’s or company’s brand, and in 8.1, you can now customize the logo that displays while Grafana is loading in a user’s browser. Prepare your best fancy gif! Find out how to configure it, along with other Grafana UI elements like the corner logo and application footer, in the Grafana Enterprise docs.
Get more information
For a quick overview of more new features, have a look at our What’s New in 8.1 page. For a complete list of new features, changes, and bug fixes, check out the documentation and release notes. Join us on our community forums to discuss any of the new features, workflows, or how to incorporate these changes into your dashboards, queries, and visualizations.
Upgrade Grafana
Download or try Grafana 8.1 in the cloud today.
Refer to Upgrading for more information about upgrading your Grafana installation.
Thanks
A big thanks to all the Grafana users who contributed by submitting PRs, bug reports, and feedback!


