What's new in Grafana Enterprise Logs 1.1: Label-based access control
Back in February, we introduced Grafana Enterprise Logs (GEL) into the Grafana Enterprise Stack. GEL is a new way for large organizations to ingest and query their full log volume, without the cost or operational complexity associated with other solutions. (View a demo here.)
We just released GEL 1.1, and one of its key features is label-based access control (LBAC). It’s part of a greater effort by Grafana Labs to provide fine-grained access control across all our products, so operators have access to many different options for enforcing permissioning.
Imagine you have two different teams using GEL, and you want to separate who has access to what. With LBAC, it’s possible to limit which logs specific individuals can query through specific label requirements. This is helpful when you have log files that you don’t want everyone in your company to be able to access — for example, if they contain personally identifiable information (PII).
Familiar configuration
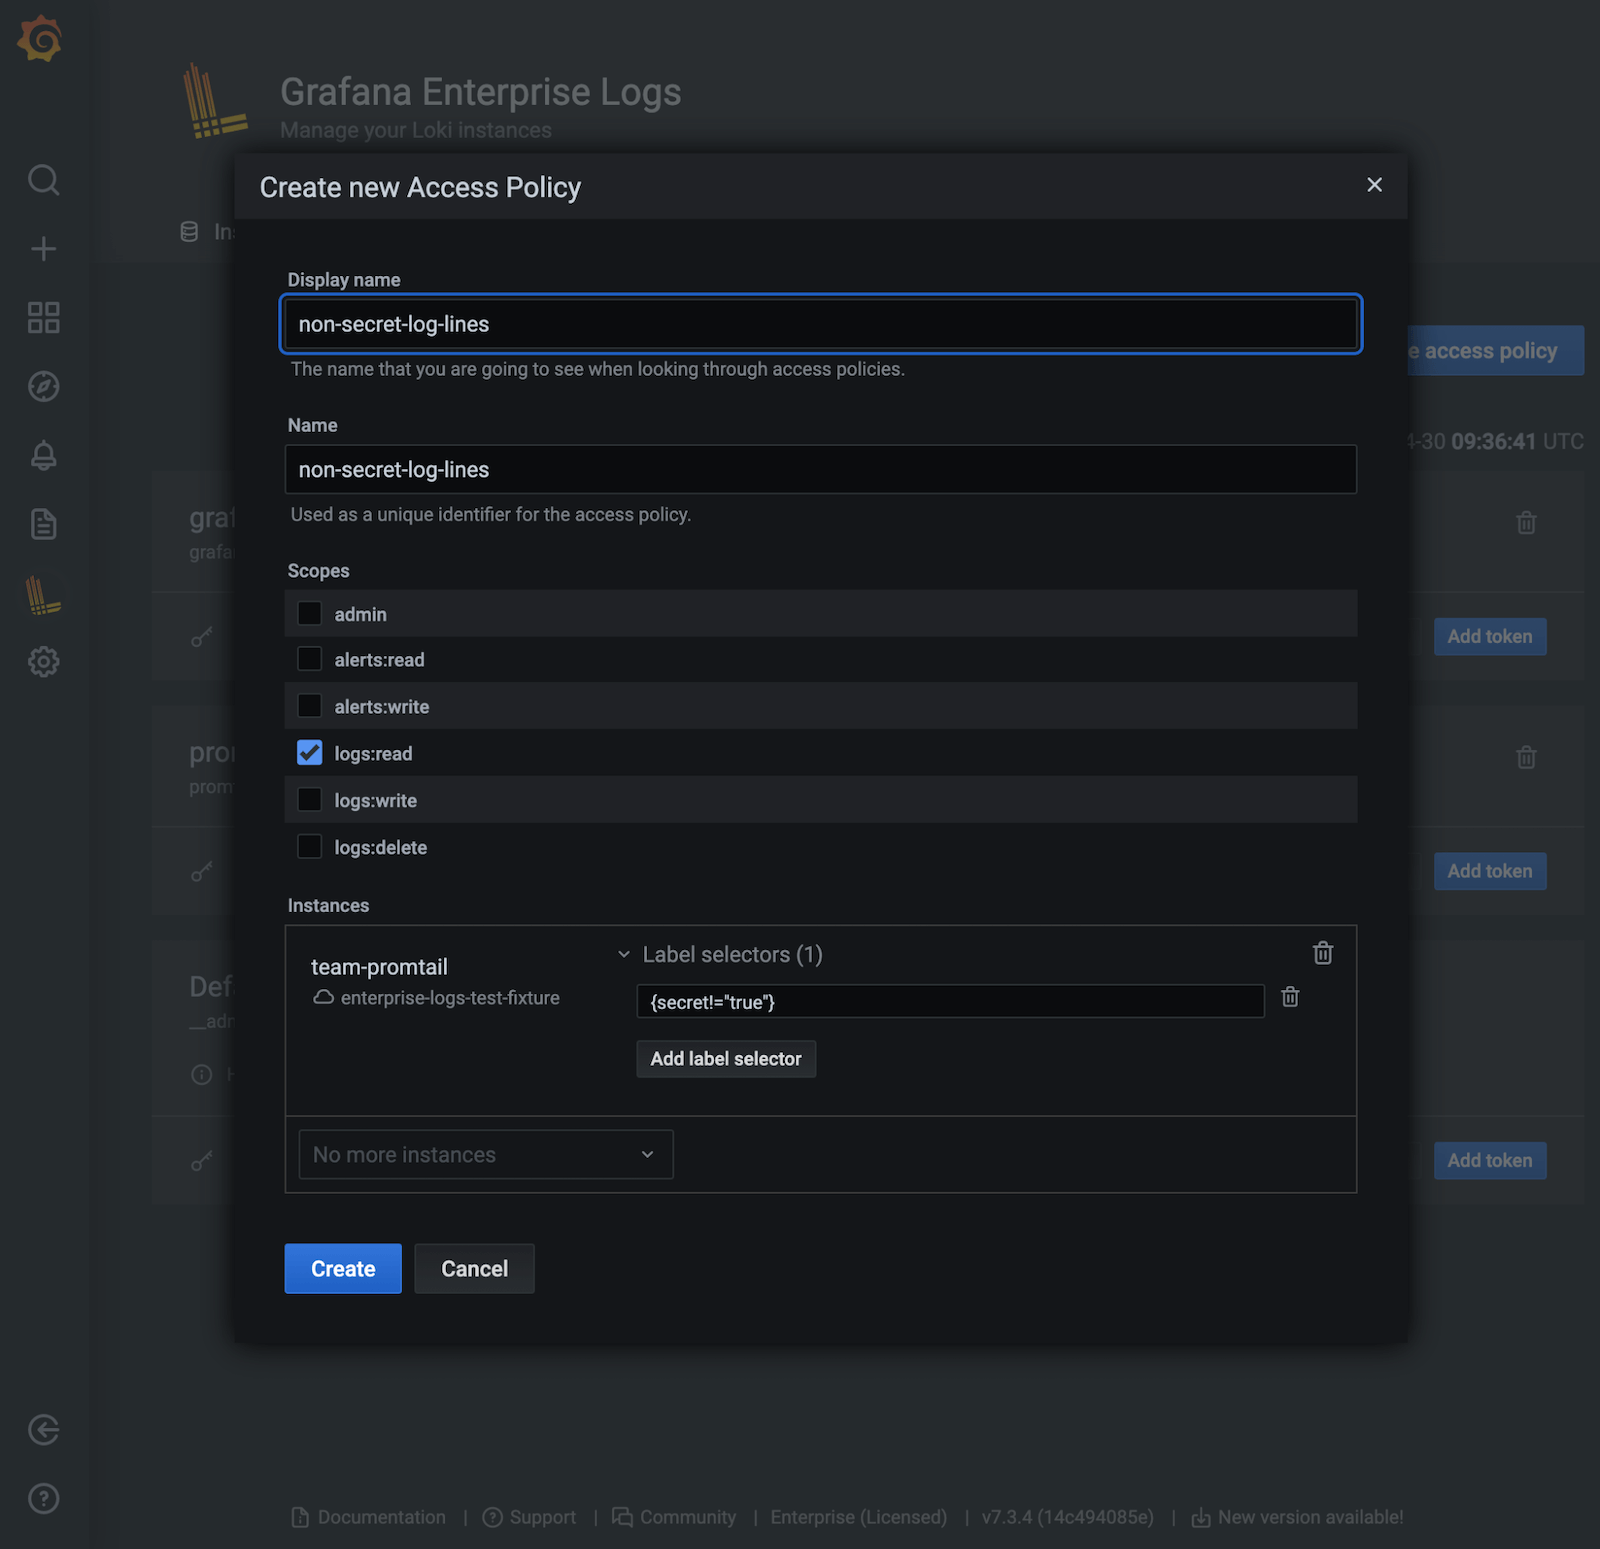
LBAC is a feature we already have in Grafana Enterprise Metrics (GEM), and the configuration in GEL is similar. Setting up a label-based access policy is just an extension of setting up an access policy to grant a user read access to a particular tenant in a GEL cluster.
The GEL plugin makes setup easy, but there’s also an API for customers who prefer that instead.
For instructions on how to use LBAC, check out the documentation page.
How it works under the hood
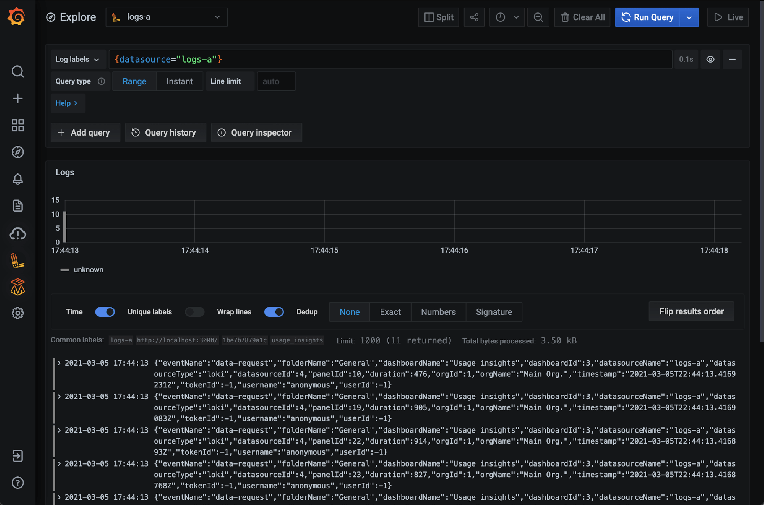
When a user logs in with a token, the label policies on the access policy for that token are retrieved. They specify if log lines with a particular label set should be included or not. The label policies then get passed along to all the components of the system — whether it’s running in microservice mode and single binary, or single binary with query frontend — until they reach the storage engine.
At query time, GEL filters out chunks of log lines that don’t match the pattern, so that the user can only see the log lines they’re authorized to view.
One great benefit of LBAC is that by adding the filtering, you’re going to be processing less data than before. Users don’t have to go over every chunk. Instead, you only go over the ones that you have access to, and then you do whatever extra filtering you need inside of the Loki query.
Processing less data also means faster query results and less hardware required to execute the query.
Overcoming challenges
LBAC may be a simple concept to understand — it only returns values where a label matches a certain amount — but this feature took about five months to develop. We invested that time so we could do rigorous testing to make sure GEL users can be fully confident that when they want a query to return logs where a label equals a certain value, that it’s really going to happen.
One of the biggest challenges we ran into was ensuring that the label matchers were properly passed to every component in GEL. If the filters get dropped at any point in the query path, there’s a risk you may return log lines you wanted to hide.
One thing to keep in mind with LBAC is that the way you can specify which labels are selected is very flexible, which can also make it slightly difficult to understand. For example, you can write complex logical expressions and regular expressions to capture the specific set of logs you want to include and exclude. That’s something that can’t even be done in the log stream selector of a Loki query.
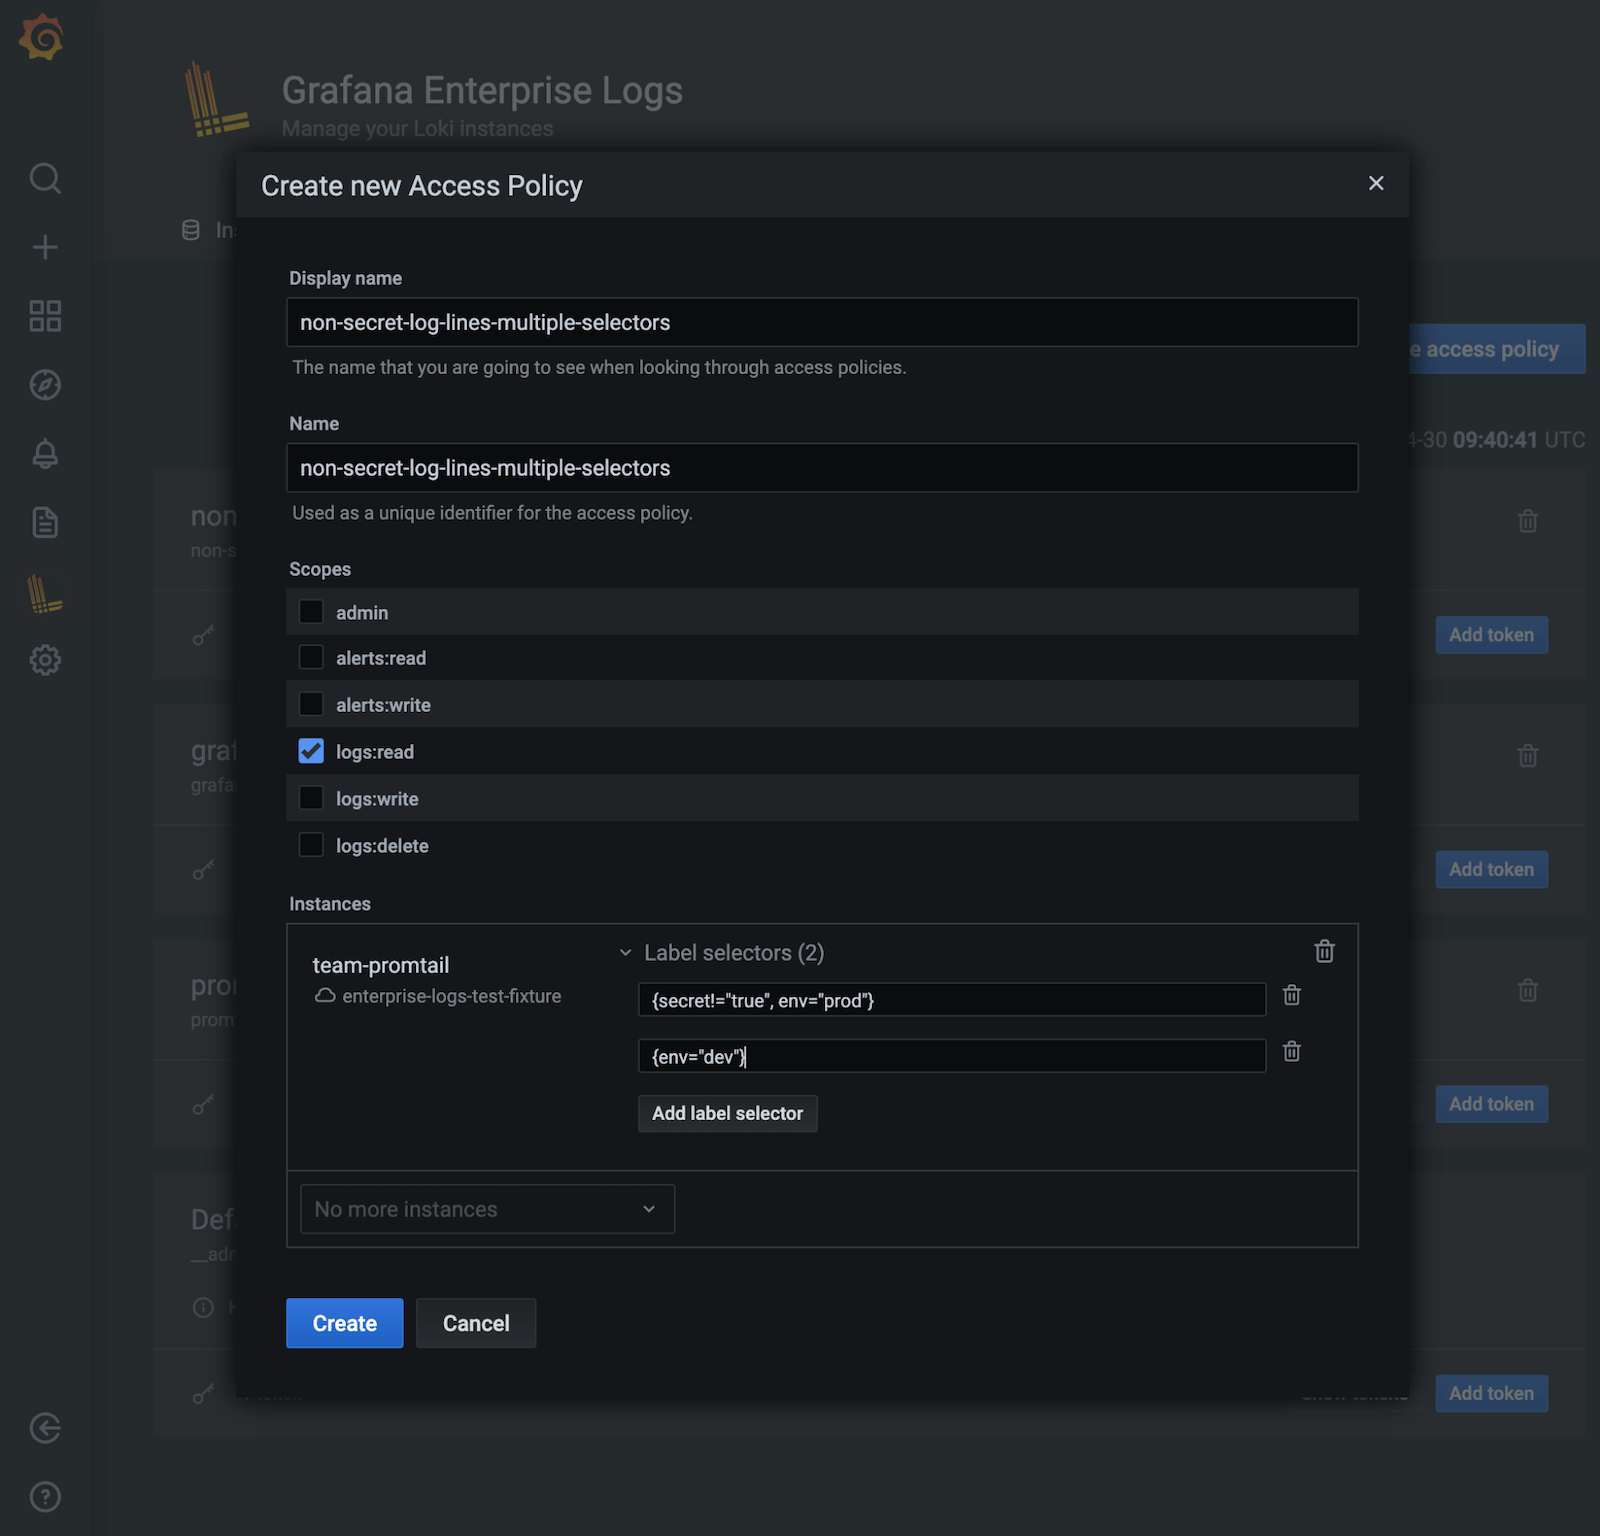
To exclude logs that have a specific label, you can create a label policy that excludes all log lines with the label secret=true by adding a selector with secret!="true" when you create an access policy.
You could also use multiple selectors to create a policy that allows someone to access the production and development environments and exclude logs with the label secret=true in the production environment.
Final thoughts
Grafana Labs is already using this type of sophisticated filtering in our billing cluster. As you can imagine, billing info is sensitive, so we use multiple log selectors to make sure we get the right sets of data when we’re showing Customer 1 their billing info but not letting them see info belonging to Customer 2.
That’s all for now — stay tuned for news on the next GEL update. In the meantime, you can read more about Grafana Enterprise Logs in the docs, and contact us if you’d like to try it out!