

How BasisAI uses Grafana and Prometheus to monitor model drift in machine learning workloads
Qiao Han is a Software Engineer at BasisAI and co-author of Boxkite. He is interested in everything related to observability and has contributed to popular open source projects like libcurl and aiohttp. This post is written together with his coworker Linh Nguyen, who is a Tech Lead at BasisAI.
Motivation
Machine learning has been advancing at a breathtaking pace. Every day there are new techniques published pushing state-of-the-art performance. However, applying the breakthrough in research to production is a hard problem: Data changes and new events happen, altering the correlation between input features and inference results.
This is what’s called “model drift.”
While monitoring and alerting on model drift is a new hot topic in data science, monitoring software performance is well established with best practices and mature tooling. At BasisAI, we wanted to leverage this ecosystem, rooted in Prometheus and Grafana, to tackle ML model monitoring. To that end, we launched Boxkite, a simple, open source Python library that captures distribution of training data and production data, enabling detection of shifts in data distribution between the two environments.
Architecture
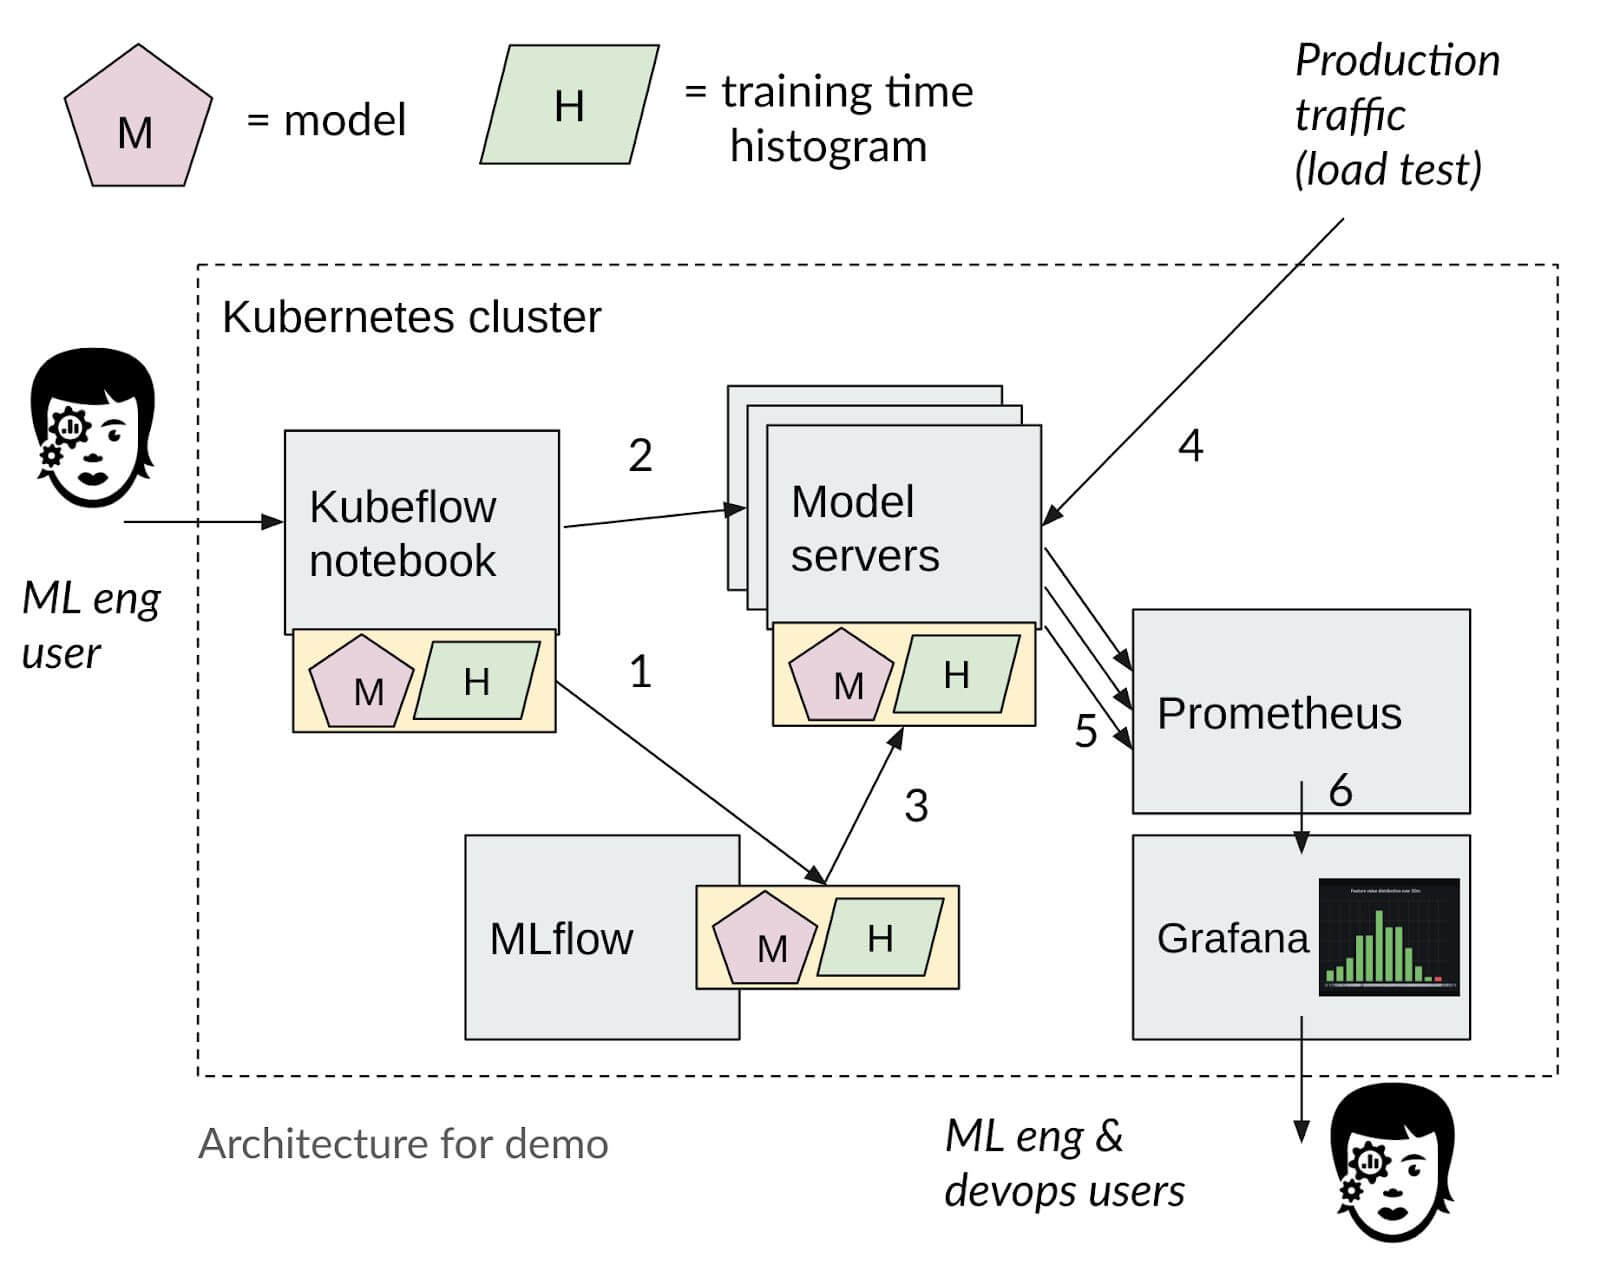
Figure 1: Boxkite is a simple instrumentation library that helps you generate Prometheus histogram files to be shipped with your model. Your serving code may further export these metrics for Prometheus to scrape.
Under the hood, Boxkite leverages Prometheus — a well-known, battle-tested tool for metrics collection — by creating histograms automatically from your training and production features. The computed histograms are exposed as a metrics endpoint for Prometheus to periodically scrape.
Owing to its simplicity, the library can be easily integrated with open source orchestration tools like Kubeflow and MLflow. You can launch full code examples easily using Test Drive.
Dashboard
After setting up Prometheus as a data source for Grafana, you can easily visualize the collected histogram data to detect and alert on model drift. The dashboard below shows the sampled distribution, plotted over the last 30 minutes, compared with the training distribution. To compare distributions over a longer period, simply change the time window to last 12h (for example), and the template variable will be automatically propagated to the query string.
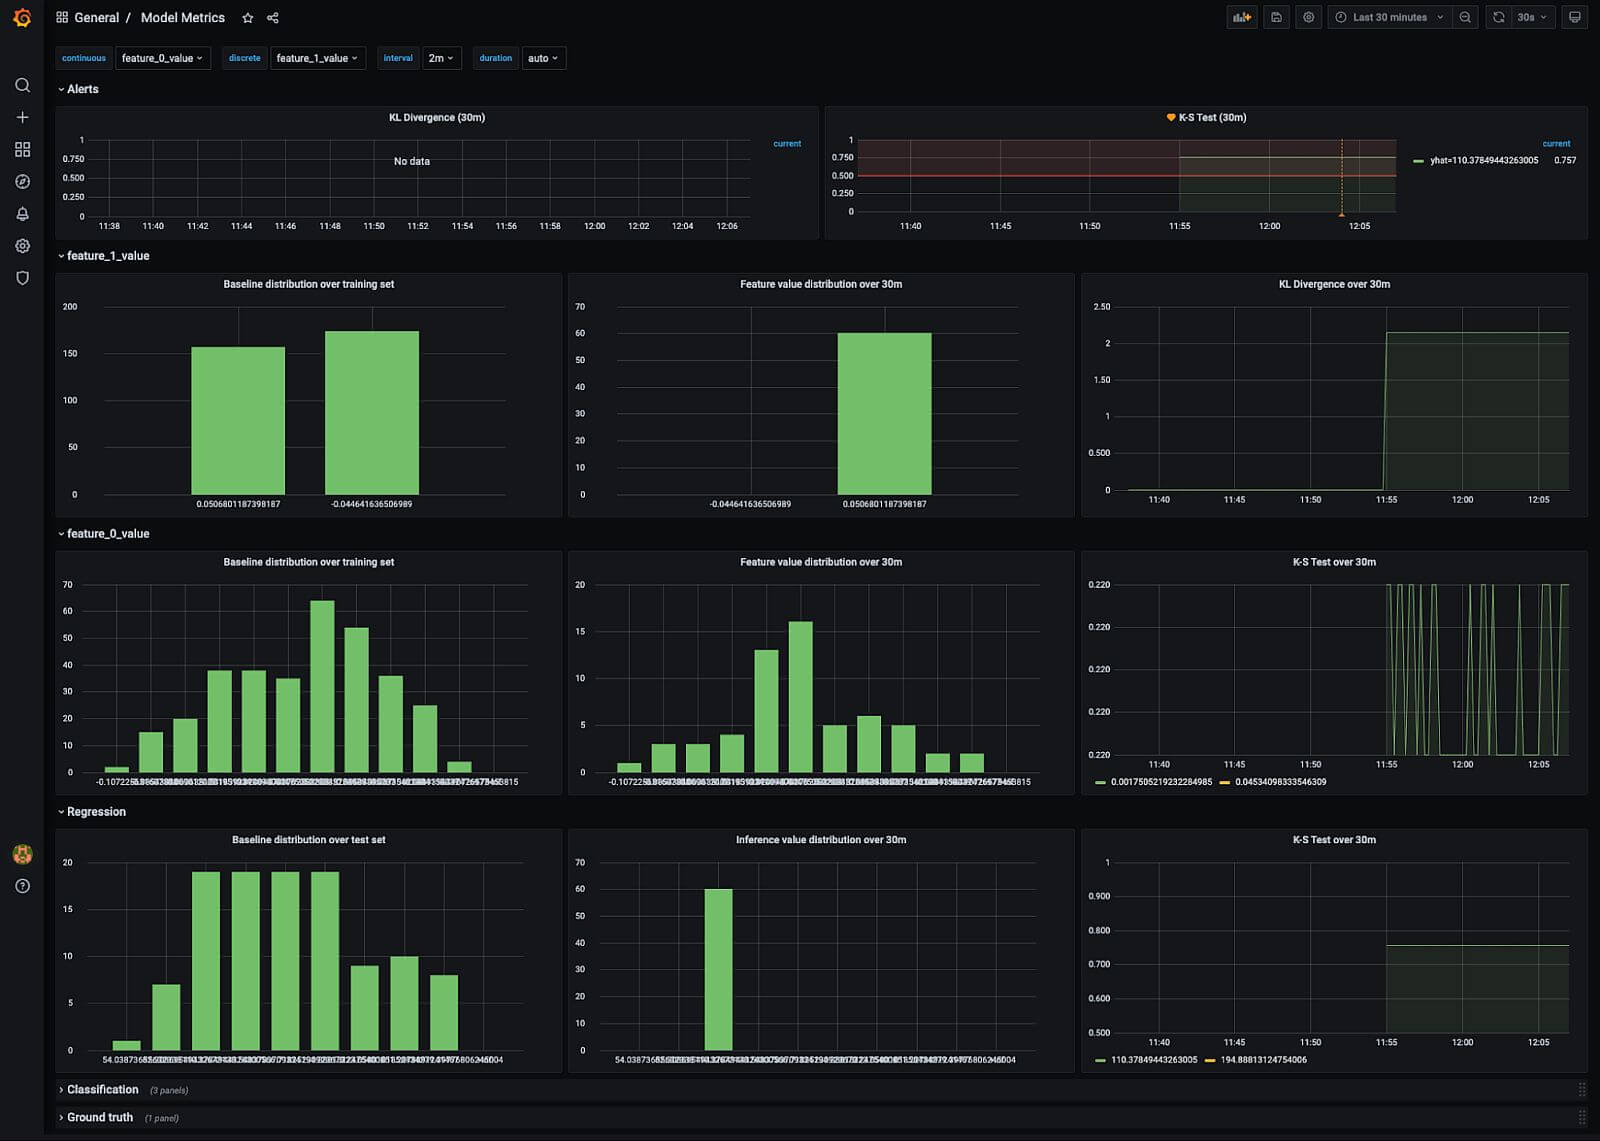
Figure 2: Dashboard showing the input and output distribution of a regression model. Feature 1 contains categorical data while Feature 0 contains continuous data. Both training and production histograms were generated using Boxkite.
Grafana’s histogram visualization helps us clearly identify a drift in distribution for Feature 1 between training and production. Feature 0, on the other hand, shows no visible difference.
We use two metrics to quantify model drift: KL divergence for categorical data and K-S test for continuous data. Both metrics can be implemented in PromQL with alert thresholds configured accordingly. Details of the query construction are further explained in our demo video.
Sometimes tracking the model inference results can yield valuable insights to your business. These histograms are visualized in a similar way for both regression and classification models.
Conclusion
BasisAI uses Boxkite internally to monitor feature and inference distribution drift in production models. By taking full advantage of the Prometheus-Grafana ecosystem, Boxkite unifies ML monitoring and software monitoring in a single stack. If your team is already using Grafana, simply import our JSON dashboard to get started. Otherwise, you can try it out locally using this Docker compose file.