How we’re working with the Elastic team to make the Elasticsearch data source for Grafana even more powerful
Back in March, we announced that Grafana Labs was partnering with Elastic to build an official Elasticsearch plugin for Grafana. As our CEO Raj Dutt wrote at the time, our “big tent” philosophy “means that we want to support data sources that our users are passionate about. Elasticsearch is one of the most popular data platforms that can be visualized in Grafana.”
In fact, the collaboration between Grafana Labs and Elastic started even before that announcement. For Grafana 7.4.0, released at the beginning of the year, we completely rewrote the Elasticsearch query editor using React, with a lot of valuable feedback from folks working at Elastic. At the same time, Elastic engineers were starting to contribute to Grafana with some bug fixes and feature implementations. That’s when we started getting in touch on our public Slack and discussing a shared roadmap.
Working on a roadmap together
The first few weeks after the collaboration was made official, we discussed the future of the plugin, how to remove tech debt to allow us to move faster, and what to focus on to make this happen.
One of the most important steps was to slowly (but steadily) move away from the frontend implementation of the query builder. This will be completely invisible to users, but as of now, having those two different implementations is the main cause of bugs and slow development in the Elasticsearch data source. Both of our teams agreed that this is a much-needed step in order to make the data source more reliable before implementing new features.
New in Grafana 8.1
Up to now, Grafana was aiming to support only OSS-Elasticsearch features, but starting with Grafana 8.1.0 (in beta now), the target has shifted to include X-Pack features that are still free to use.
With this in mind, we added the following features in 8.1.0 in collaboration with the Elastic team.
Additional support for searching frozen indices
Slicing data in time-based indices is a popular choice among Elasticsearch users, and usually older indices (or indices containing older data) are accessed less often and don’t get any new data.
However, this older data is still useful for performing long-term analysis over data, where response times need not be instant. In this scenario, freezing those older indices allows Elasticsearch to reduce its resources footprint.
Allowing searches over frozen indices was a popular request and unblocks Elasticsearch users, so they can make better use of their data in their Grafana dashboards.
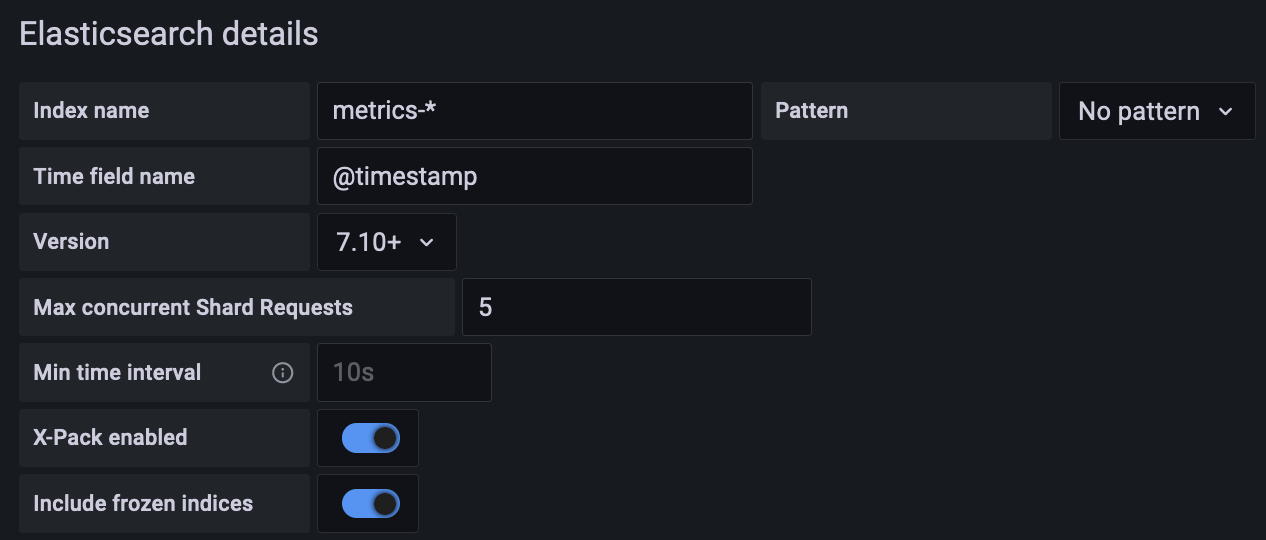
Because Elasticsearch doesn’t keep frozen-indices information in memory, performing a search on those indices might lead to higher load on a cluster than usual. Therefore, users need to manually enable this feature at the data source level:
Rate aggregation
The rate aggregation calculates the rate of documents or fields that appear in date_histogram buckets. This was a highly requested feature in Elasticsearch introduced in version 7.10.0, and will enable Grafana users to get more information out of their data.
It helps answer questions like: “How many logs per second is my app producing?” or “How many sales per day is my e-commerce app generating?”

Top_metrics aggregation
Similar to the top_hits aggregation, top_metrics aggregation allows users to select from their documents metrics by using a highest (or lowest) sorting value. Top_metrics is generally more efficient, so we focused on implementing it in this release. More about this aggregation can be found in the Elasticsearch documentation.
Other fixes and improvements
There were also many fixes and improvements in this and earlier releases, such as better support for template variables, which can now be referenced in every input field.
Future plans
Moving forward, we want to make the data source even easier to use, introducing syntax highlighting and autocomplete for lucene queries, SQL support and a number of new aggregations. We are also looking forward to supporting more advanced observability use cases such as visualizing traces stored in Elasticsearch like you can do with Kibana (Elastic APM).
We’re excited to keep collaborating with the Elastic team to make using Elasticsearch and Grafana together even better. A special thank you goes to Ester, Chris, and Dimitri for all their contributions and invaluable feedback!