

Get comprehensive monitoring for your Apache Kafka ecosystem instances quickly with Grafana Cloud
We are happy to announce that the Kafka integration is available for Grafana Cloud, our composable observability platform bringing together metrics, logs, and traces with Grafana.
Apache Kafka is an open source distributed event streaming platform that provides high-performance data pipelines, streaming analytics, data integration, and mission-critical applications. Kafka is the most used event streaming platform worldwide, and its ecosystem includes a wide variety of pieces for data governance, querying, batch processing, and connectors.
Our Grafana Cloud integration, which is heavily based on this blog post from Confluent, provides dashboards for your Kafka Broker clusters, Zookeeper clusters, Kafka Connect clusters, Schema Registry clusters, and ksqldb clusters, along with a specific dashboard for topics information and consumption lag.
Most of the dashboards rely on collecting data through a JMX exporter running alongside each instance of your Kafka components, as an agent. Only the lag consumption dashboard is fed by an external exporter, which is embedded in the Grafana Agent for ease of use. The details on how to configure the JMX Exporters and the Grafana Agent can be found here.
Below is a brief explanation of each dashboard.
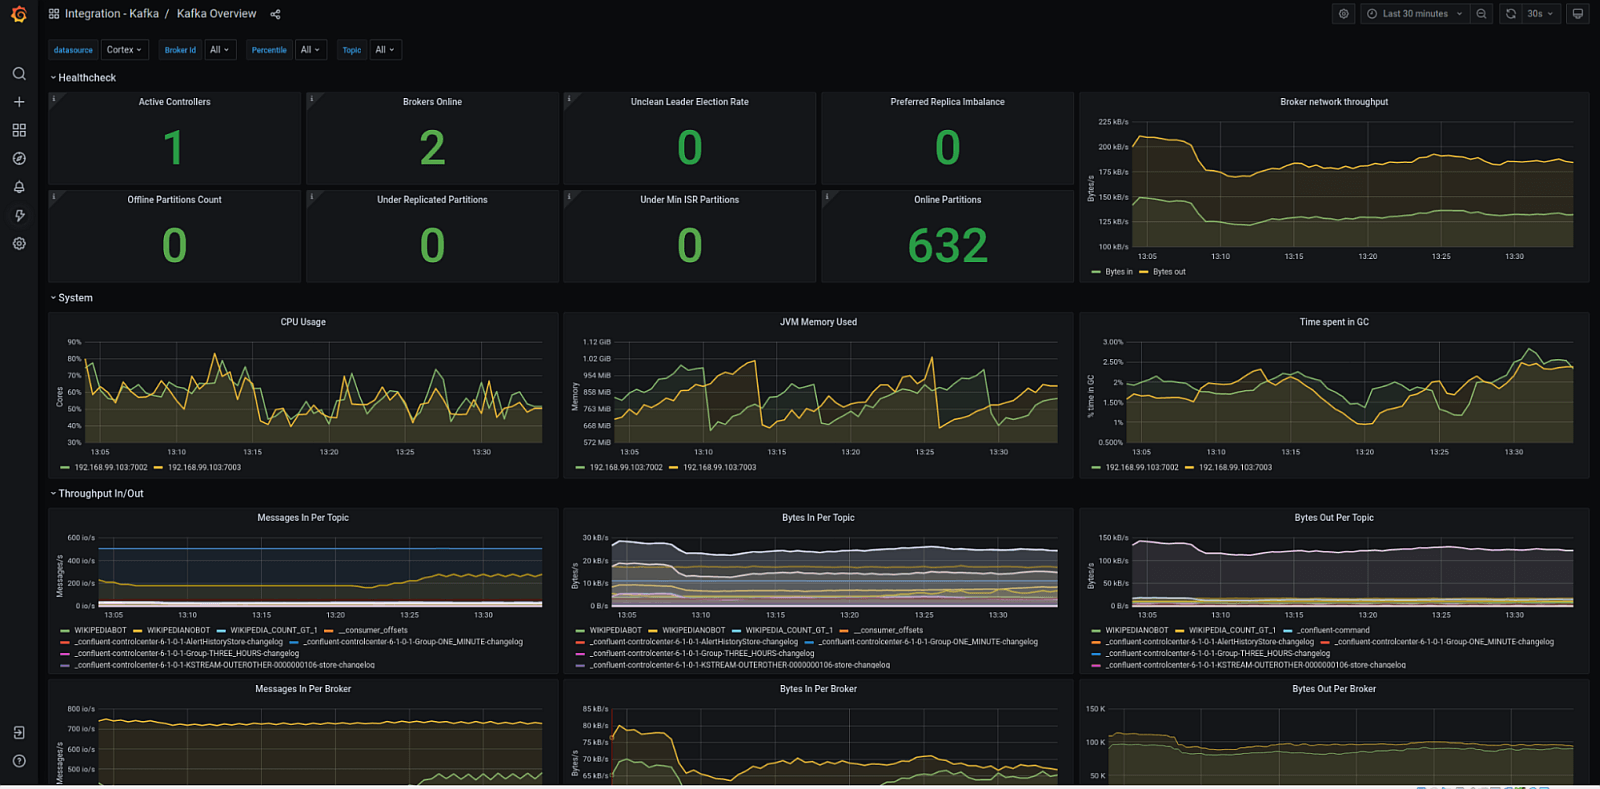
Kafka overview
This is a comprehensive dashboard showing the overall healthiness of your Kafka cluster, including how many brokers are alive in the cluster; metrics for your partitions; JVM, throughput, requests, and response queues size; Zookeeper connections; and producer and consumer metrics.
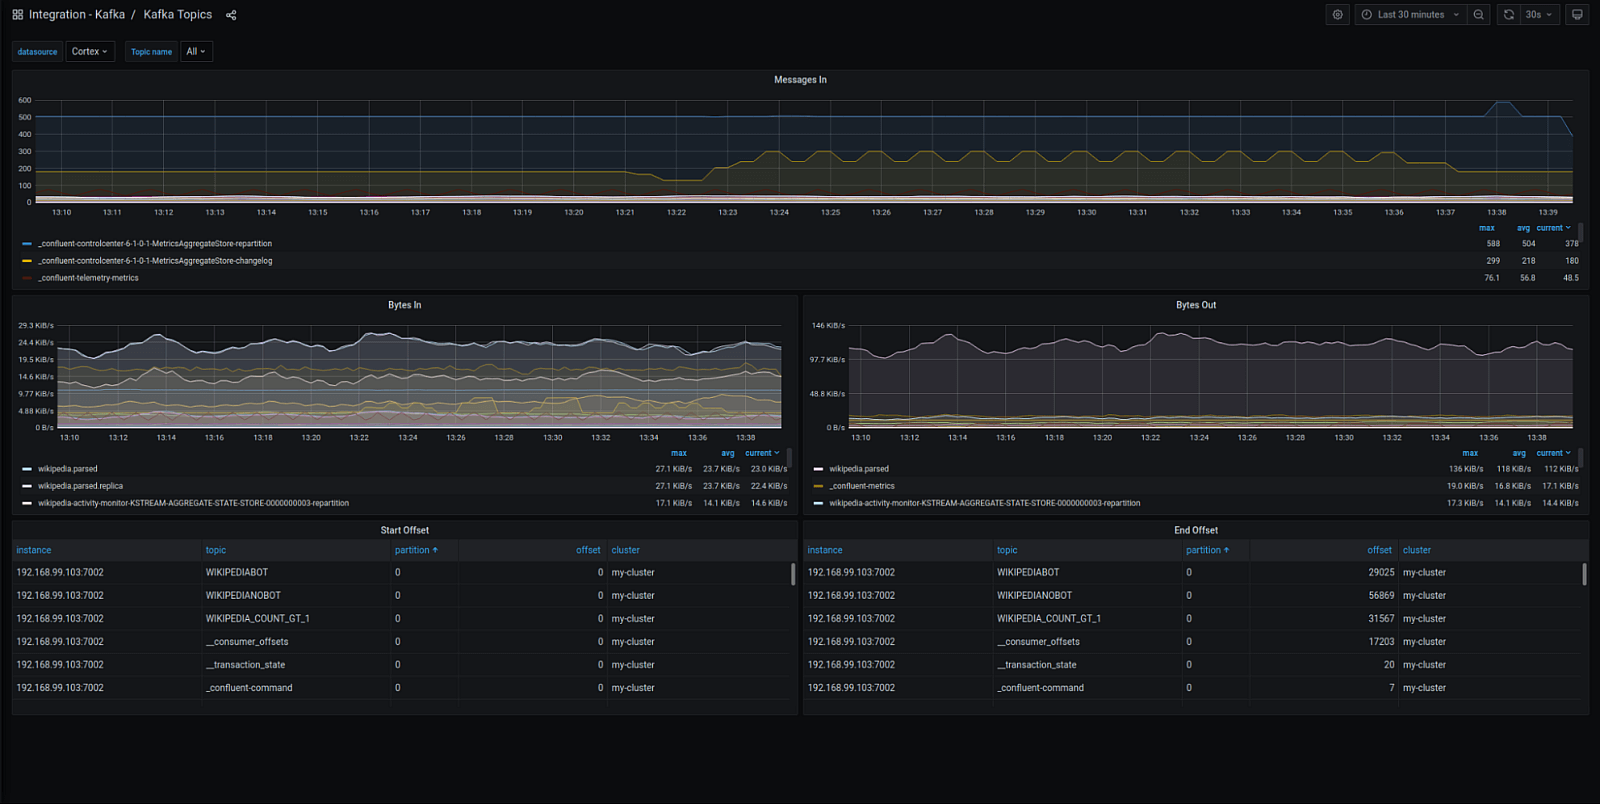
Topics overview
This dashboard provides a deep dive into each topic’s health and shows the throughput in bytes and number of messages as well as the offsets.
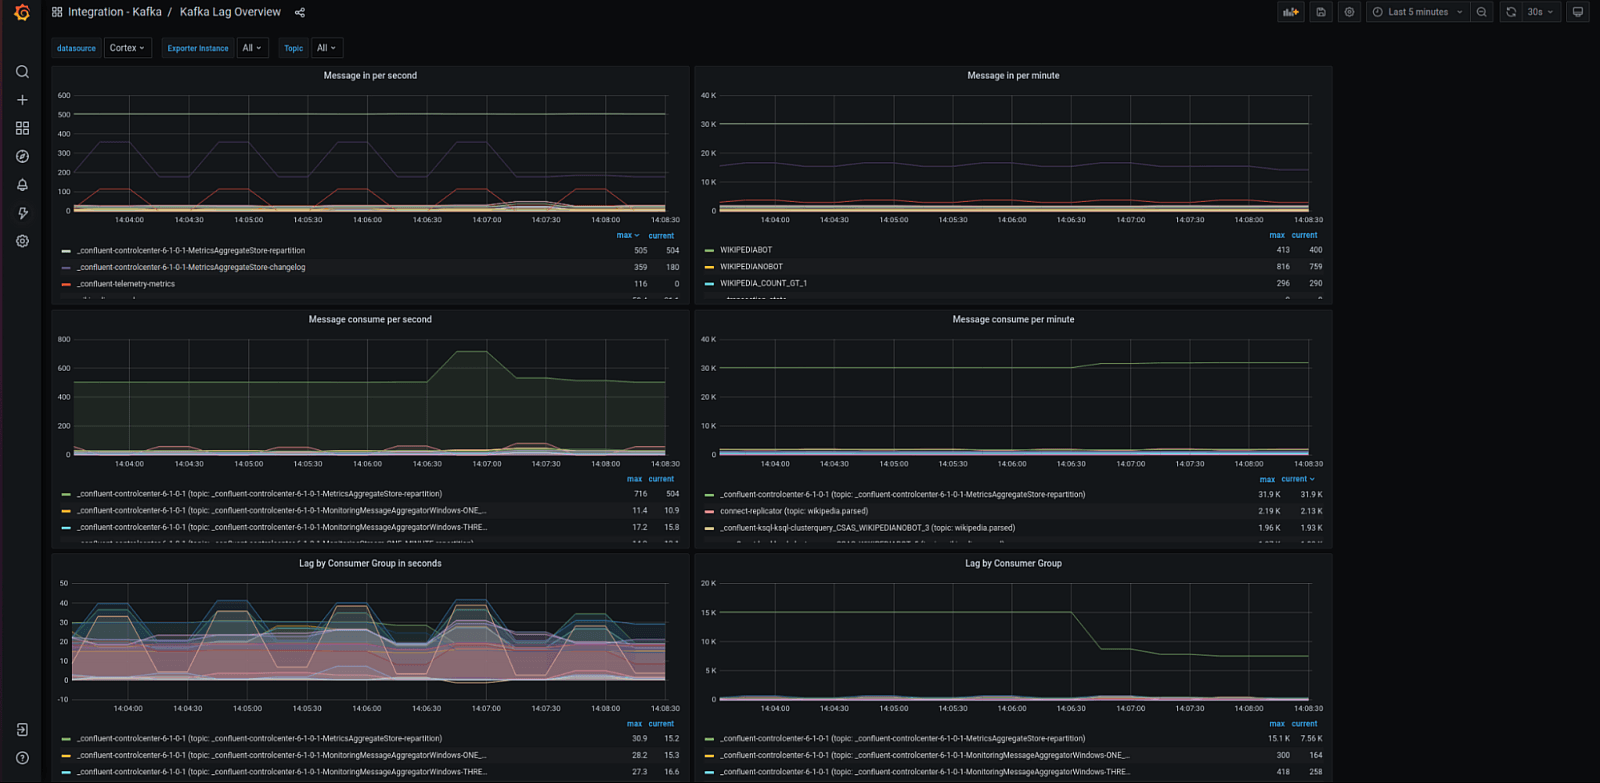
Kafka lag overview
This dashboard shows the consumption lag of each topic, including offset lag in quantity, estimated time in seconds, and message throughput per minute and second. It is fed by the external exporter, which is embedded in the Grafana Agent.
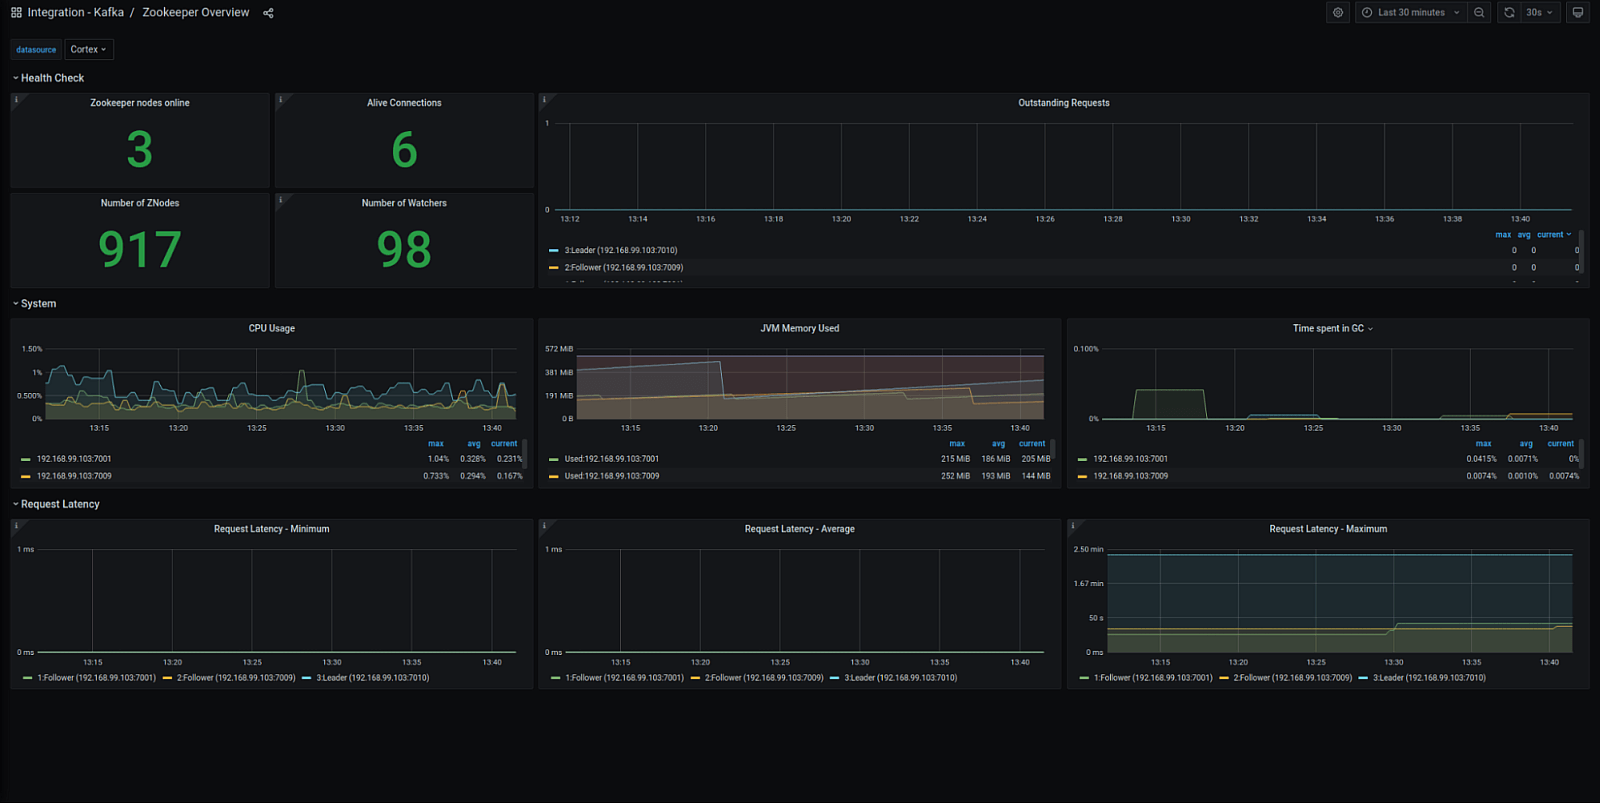
Zookeeper overview
This dashboard gives you a general overview of your Zookeeper cluster, focusing on JMV metrics, number of nodes online, active connections, and throughput.
Schema Registry overview
This dashboard is focused on your Schema Registry, showing the number of registered, created, and deleted schemas along with JMV and throughput metrics.

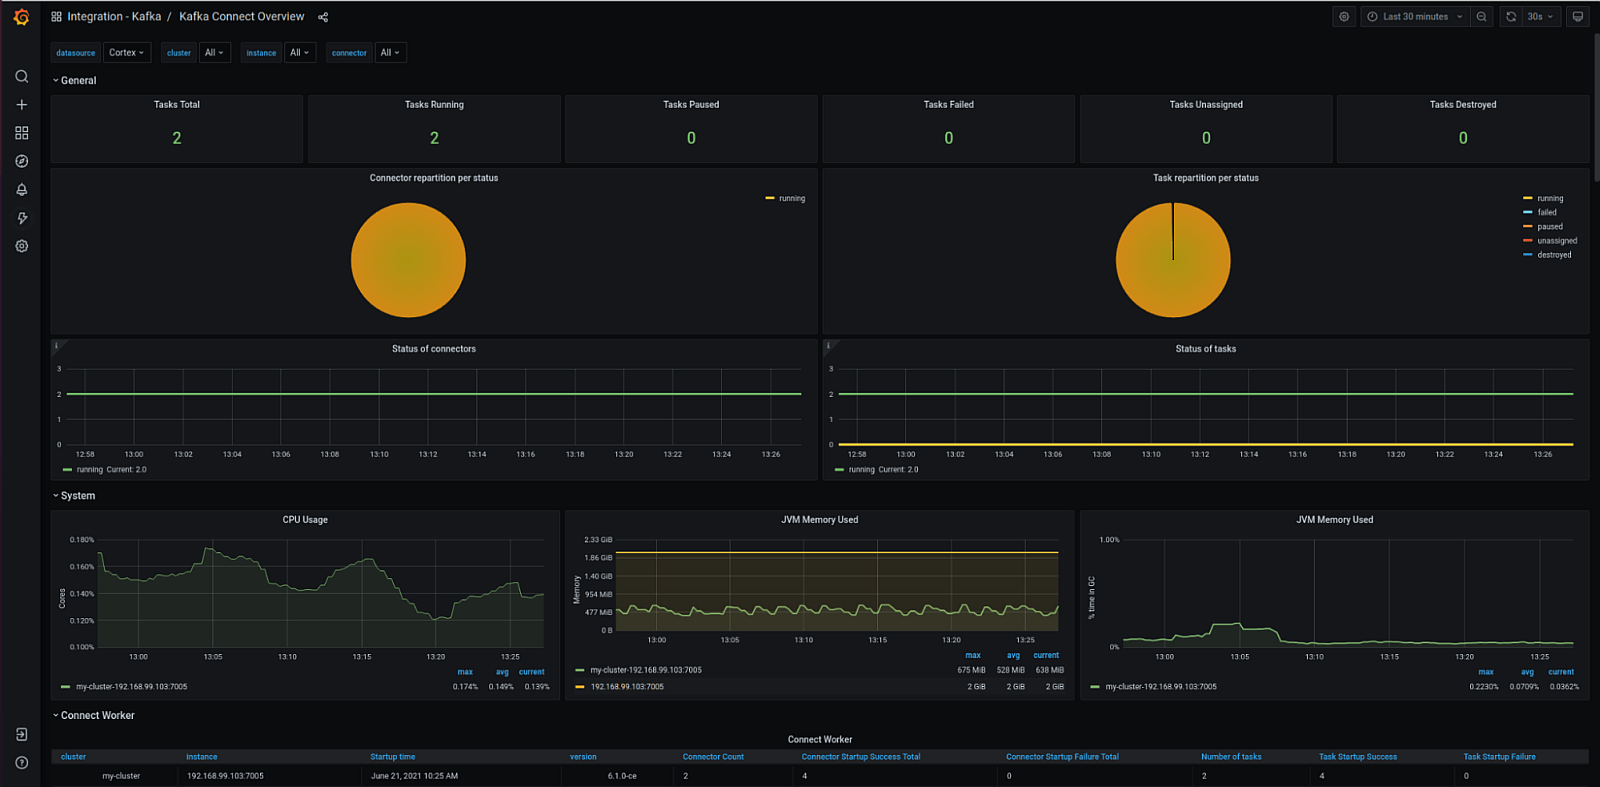
Kafka Connect overview
This dashboard focuses on the Kafka Connect tasks, showing how many tasks are running, paused, failed, unassigned, and destroyed. Going down, panels show more technical details about your tasks, such as network, IO, authentication, and connection statistics, along with batch size, offset, and task error metrics. The dashboard also shows the overall health of your Kafka Connect Cluster JVM.
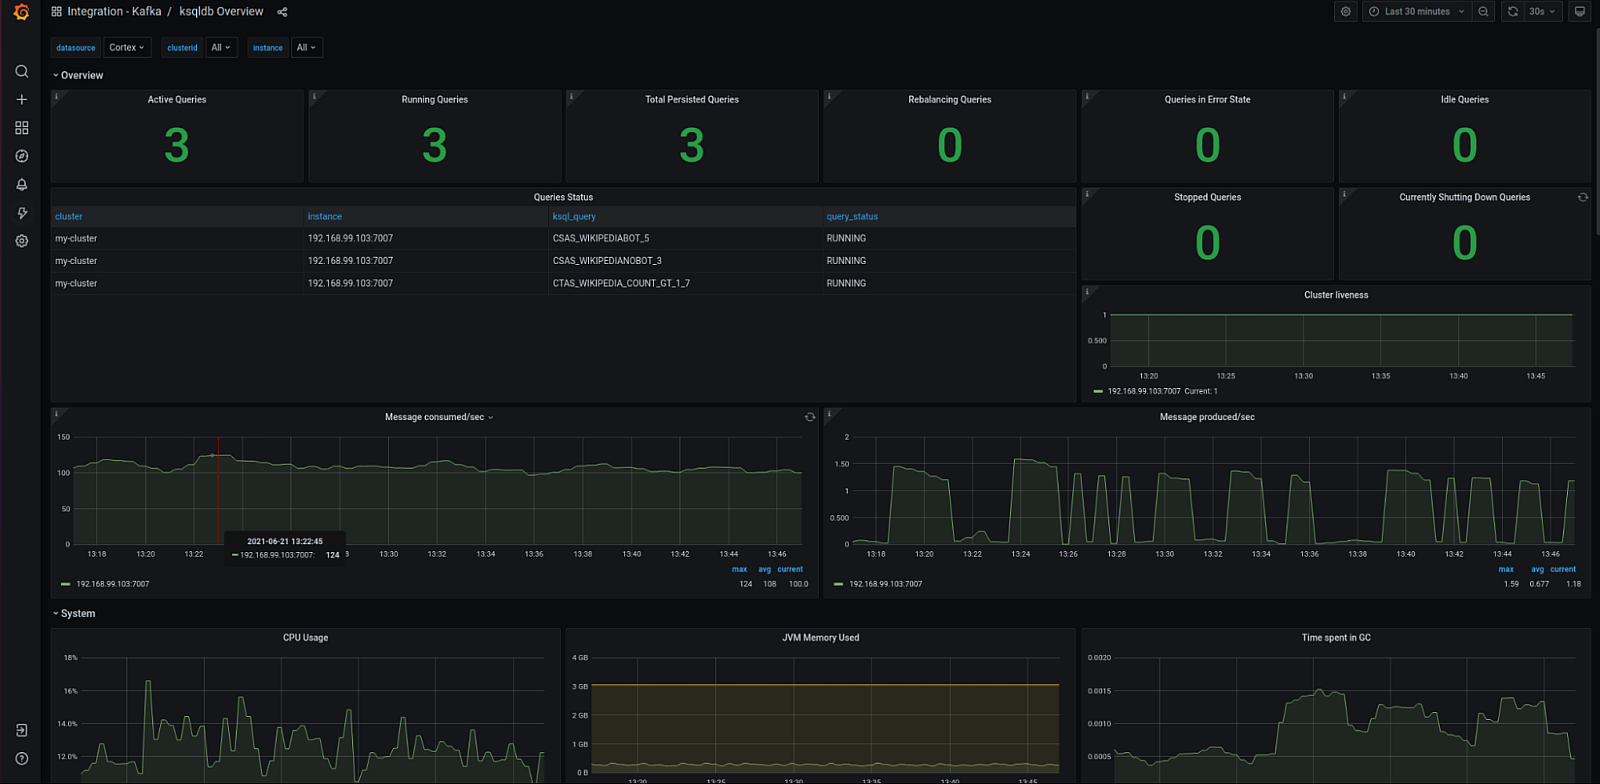
KSqlDB overview
This is a comprehensive dashboard covering a large range of your ksqldb cluster metrics: the number of active, running, stopped, and idle; the status of each query; the life of your cluster; message throughput; JMV metrics; and more.
Get started!
The integration with Kafka is available now for Grafana Cloud users.
If you’re not already using Grafana Cloud, we have new free and paid plans to suit every use case — sign up for free now. It’s the easiest way to get started observing metrics, logs, traces, and dashboards.
For more information on monitoring and alerting on Grafana Cloud and Kafka, check out our docs or join the #integrations channel in the Grafana Community Slack.
Let us know what you think
Stay tuned for future content on how to best utilize the Grafana Cloud integrations. And tell us what you’d like to see! You can chat with the Cloud Integrations team on our Community Slack.


