
Get even more insights from Jira + Grafana with the latest Grafana Cloud integration
We’ve seen the value that many in our community have gotten from using Jira for planning, tracking, and releasing software, so we’re excited to announce the new Jira integration for Grafana Cloud.
Organizations can already visualize insights into their software development with the Jira Enterprise plugin for Grafana, which makes it easy to better understand things like mean time to resolution, issue throughput, and sprint velocity. Now, with the new Jira integration, Grafana Cloud users will be able to track the health of their Jira Data Center or Server instance by monitoring the expiration of licenses, the number of user slots available, server latency, and more. Together, the plugin and integration can bring even more visibility into organizations’ Jira instances.
Jira requirements
Jira can be run in three different ways: Jira Cloud, Jira Data Center, and Jira Server. This integration is compatible with Jira Data Center instances, where users run Jira on AWS or Azure, and Jira Server instances, where users run Jira on their own on-premises server. It is currently not compatible with Jira Cloud instances.
Monitor Jira quickly
The Jira integration comes with preconfigured dashboards and alerts to get users up and running quickly.
Dashboard
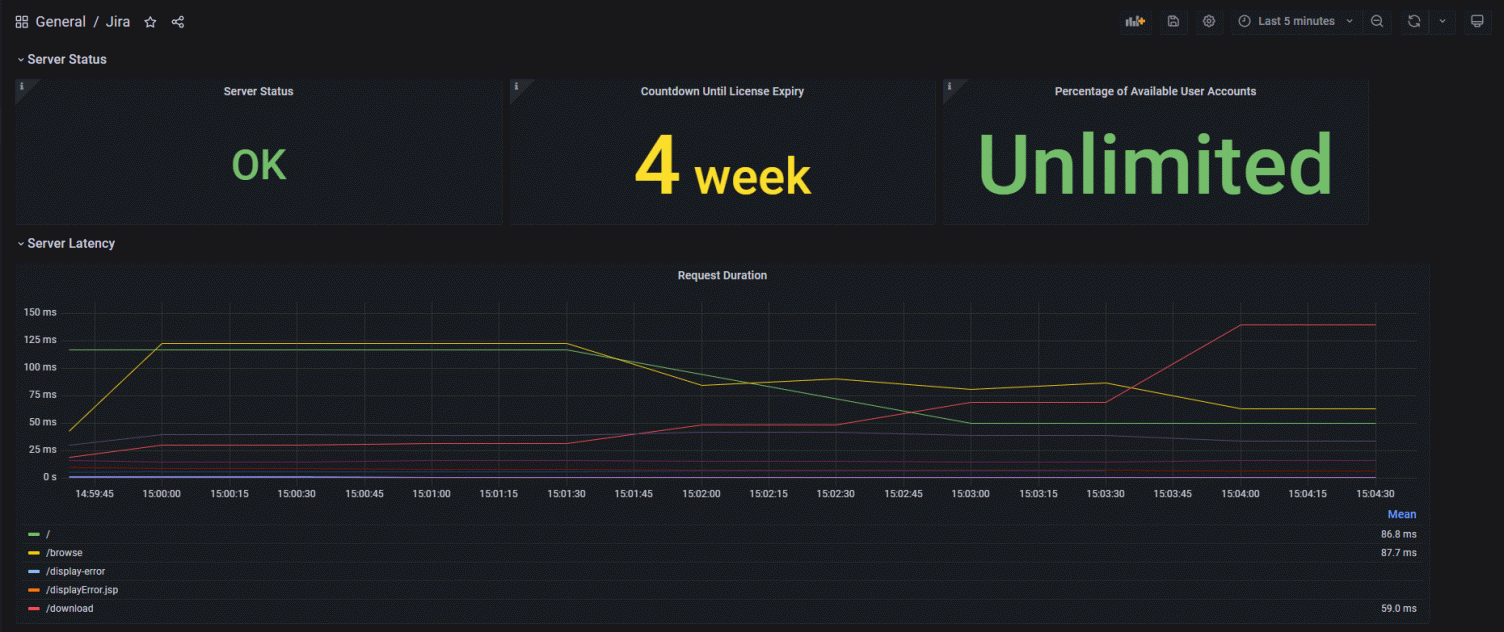
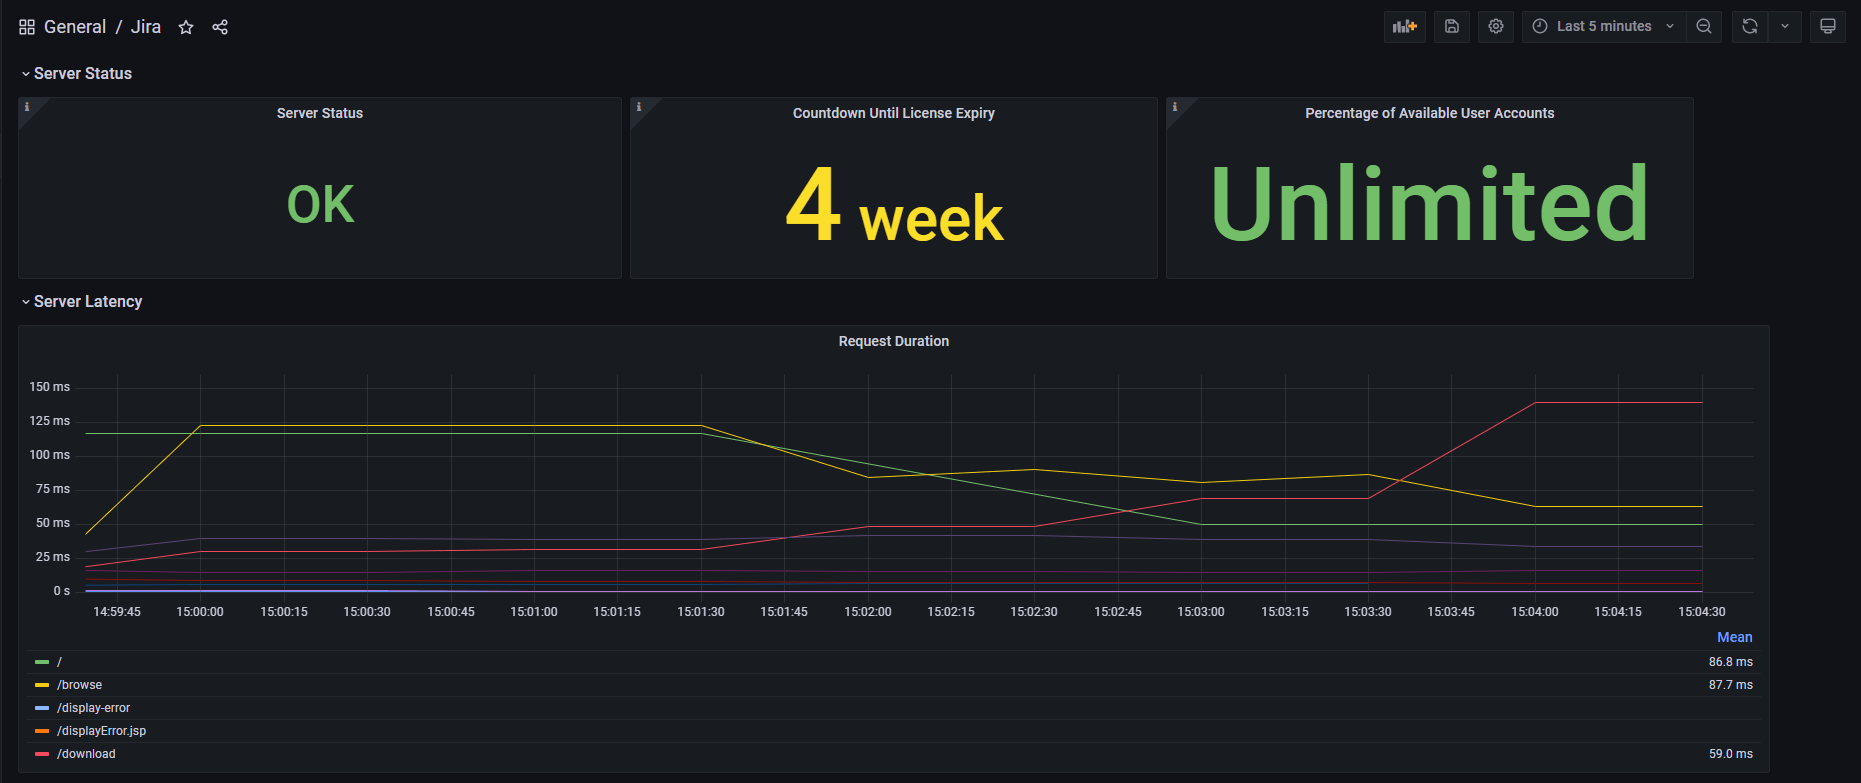
The Jira integration dashboard allows Grafana Cloud users to easily keep track of when their Jira licenses will expire and plan accordingly. It also enables users to view the number of user accounts available and plan a Jira license upgrade if the number of available users is less than the number of incoming team members.
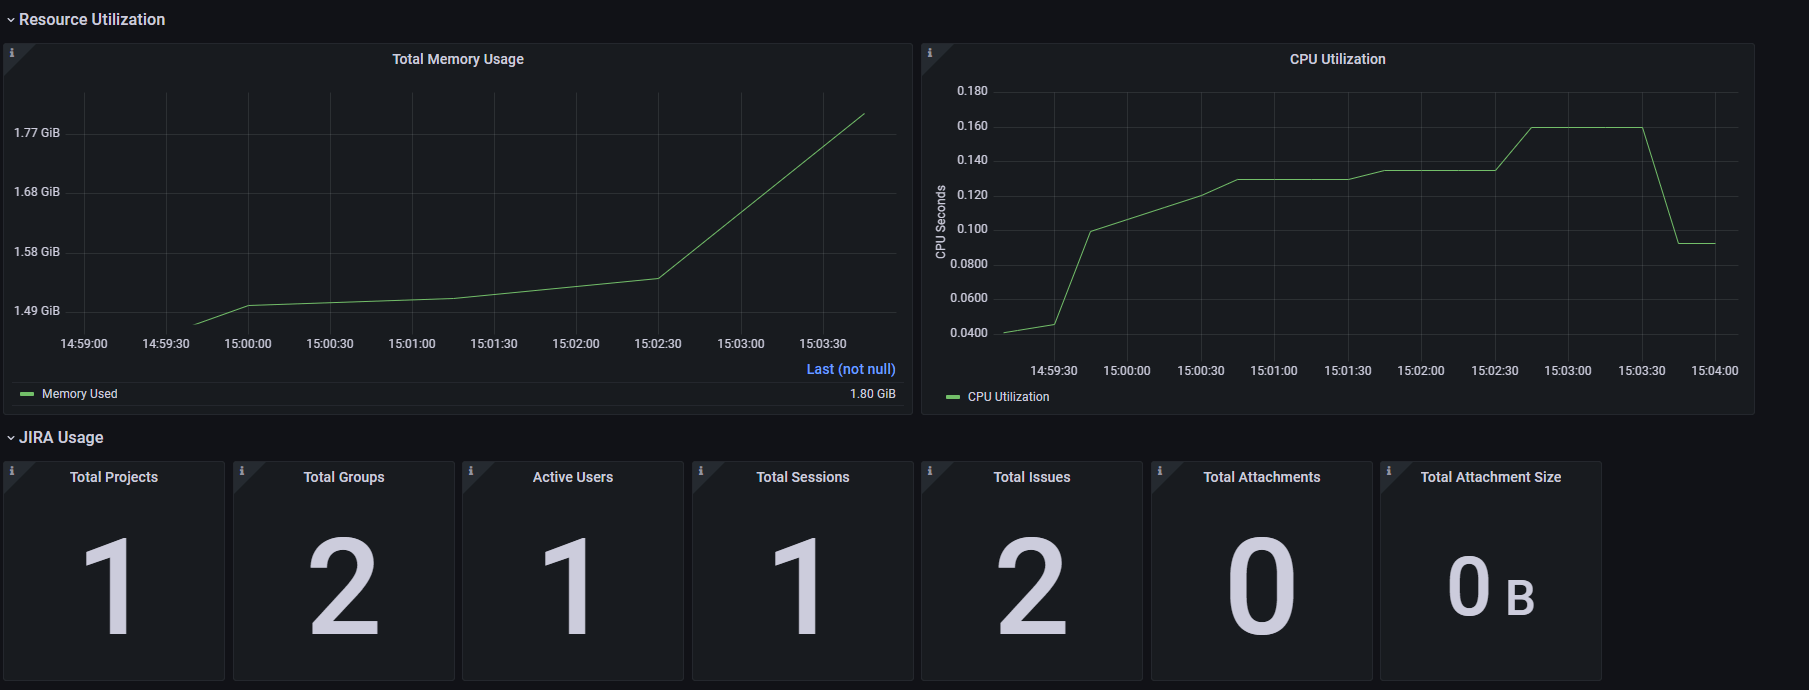
The dashboard also enables users to view the resource utilization along with the overall usage of their Jira instance.
Alerts
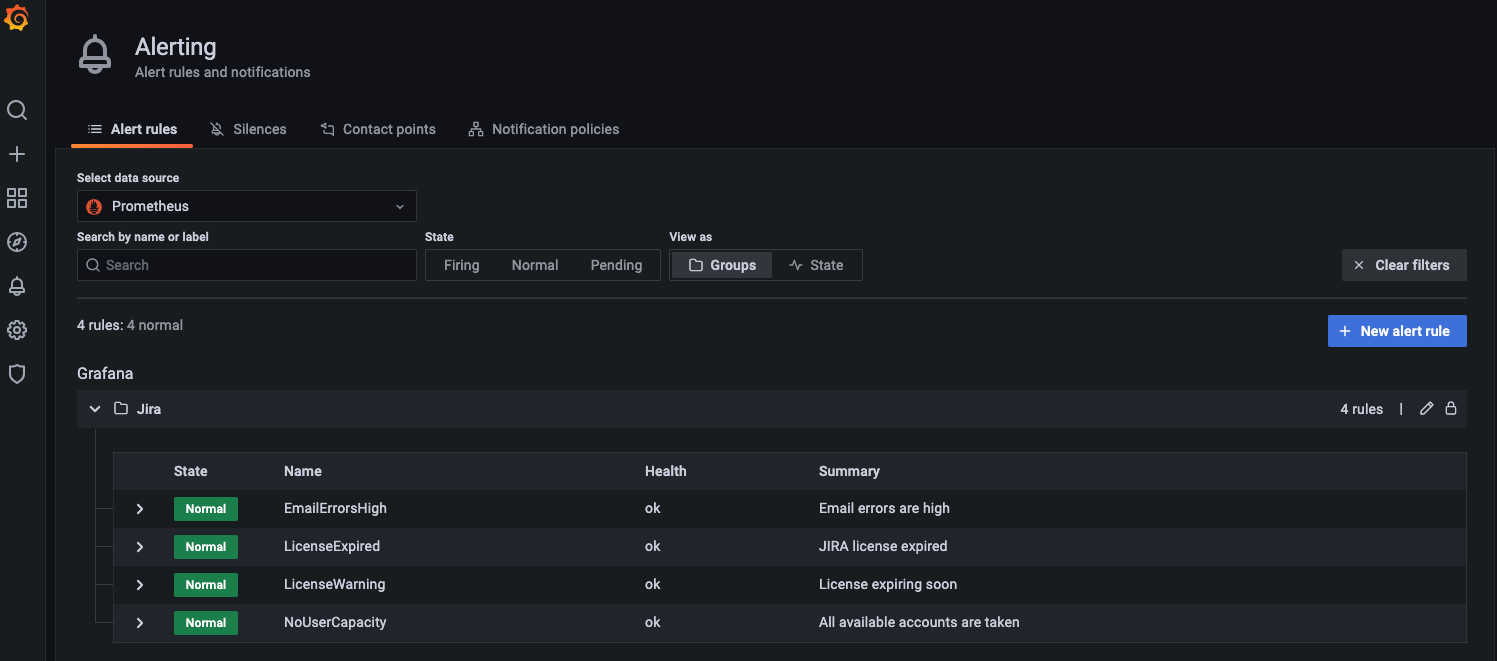
There are four preconfigured alerts:
- LicenseExpired alerts when the Jira license has expired.
- LicenseWarning warns when there are <7 days left until the JIRA license expires.
- NoUserCapacity alerts if there are no more user accounts available on the server.
- EmailErrorsHigh alerts if more than 1% of emails fail to send.
Get started
The Jira integration is available now for Grafana Cloud users. If you’re not already using Grafana Cloud, we have new free and paid plans to suit every use case — sign up now for free. It’s the easiest way to get started observing metrics, logs, traces, and dashboards.
For more information on monitoring on Grafana Cloud and Jira, check out our docs or join the #integrations channel in the Grafana Community Slack.
Let us know what you think
Stay tuned for future content on how to best utilize the Grafana Cloud Jira integration. And tell us what you’d like to see! You can chat with the Cloud Integrations team on our Community Slack.


