What’s new in Grafana Enterprise Metrics 1.4: Cross-cluster query federation and self-monitoring
We introduced Grafana Enterprise Metrics (GEM) last September to give centralized observability teams the ability to provide a multi-tenanted, horizontally scalable Prometheus-as-a-Service experience for their end users. Since then, we’ve continued to make improvements and introduce new functionality. In this blog, I wanted to take a deeper dive into two of the exciting new features released with GEM 1.4.
Cross-cluster query federation
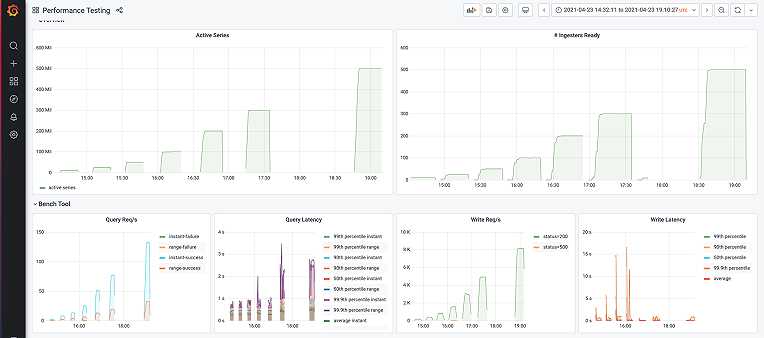
A single GEM cluster can support ingesting and querying hundreds of millions of unique time series (see Jacob Lisi’s blog post for more detail). However, even though one cluster may be large enough to hold all of your metrics, there are reasons why you still might maintain several clusters.
- Prod and Dev clusters: Many operators maintain a development cluster in parallel to their production cluster. The dev cluster gives them an environment to test out changes before rolling them out to production.
- Limited blast radius: GEM has a multitude of features designed to make it resilient to machine failure or spikes in load, including shuffle sharding, zone-aware replication, and configurable global and per-tenant ingest and query limits. However, even with those protections in place, outages can happen. Therefore, some observability teams choose to split their metrics across several clusters to ensure that even if one cluster goes down, users will still have some access to metrics. Other teams maintain multiple clusters, each with the same metrics, to ensure redundancy in case one fails.
- Data privacy: Due to compliance and privacy requirements, some observability teams are not allowed to store metrics outside of the country or region in which they were generated. In this situation, they must stand up one cluster per geography they support.
To meet these needs, we created a way to query multiple GEM clusters at once — a feature we refer to as “cross-cluster query federation.” It relies on a new GEM component known as the “federation frontend,” which utilizes the Prometheus remote_read and labels APIs.
Designed to be run as a standalone component, the federation frontend accepts PromQL queries and forwards them on to all GEM clusters that have been configured as its targets. It then aggregates the responses and returns that result to the user.
What’s particularly neat about this component is that while it was initially envisioned to aggregate results across GEM clusters, it works for any Prometheus-compatible API. That means you could query Thanos, Cortex, Prometheus, and GEM metrics all at once. For Grafana Labs, this is an exciting feature because it opens up the possibility of hybrid metrics setups, where a customer might have some metrics in Grafana Cloud and some in their own on-prem GEM cluster.
Configuration for the federation frontend is quite simple. Here’s what it would look like for the hybrid metrics setup I just described:
target: federation-frontend # Run the federation frontend as a standalone module
federation:
  proxy_targets:
    - name: internal-gem-cluster
      url: http://gem/prometheus
      basic_auth:
        username: <instance-id>
        password: <token>
    - name: grafana-cloud
      url: https://prometheus-us-central1.grafana.net/api/prom
      basic_auth:
        username: <gcloud-id>
        password: <gcloud-token>
We’re excited to see how our customers use this feature, and are already thinking about next steps, such as how to enable discovery of target clusters dynamically, rather than requiring the user to specify them. Similarly, we may add more flexibility around how we handle the scenario where a subset of clusters fail to return data - today we mark the entire query as failed.
For more on cross-cluster query federation, check out the documentation page.
Out-of-the-box self-monitoring
A classic observability question is: Who watches the watchers? Here at Grafana Labs, we take this question seriously and have written several blog posts about it, including “Best practices for metamonitoring the Grafana Agent" and “Metamonitoring Prometheus servers.”
We believe Cortex and GEM are no exception, and so we built GEM’s self-monitoring feature to give users a way to understand the health of their metrics cluster with minimal setup and external dependencies. This was a tall challenge since there are a variety of choices to make when it comes to deploying GEM, like whether you’re using single binary mode vs. microservices or running on Kubernetes vs. virtual machines vs. bare metal.
Our goal was to have self-monitoring work out of the box regardless of your deployment architecture and I’m proud to say we got pretty close. Below I’ve pasted the maximum amount of config you need. Users deploying with single binary mode don’t even need the distributor_client section.
instrumentation:
enabled: true
distributor_client:
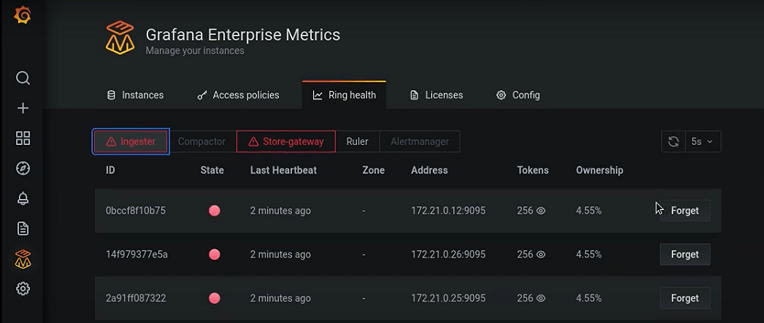
address: dns:///distributor.enterprise-metrics.svc.cluster.local:9095With this feature enabled, users will see GEM system health metrics appear in an automatically provisioned __system__ tenant. This keeps them separated from an organization’s other metrics data. Furthermore, upon installation, GEM’s Grafana plugin will set up the data source and dashboards needed to visualize those health metrics.
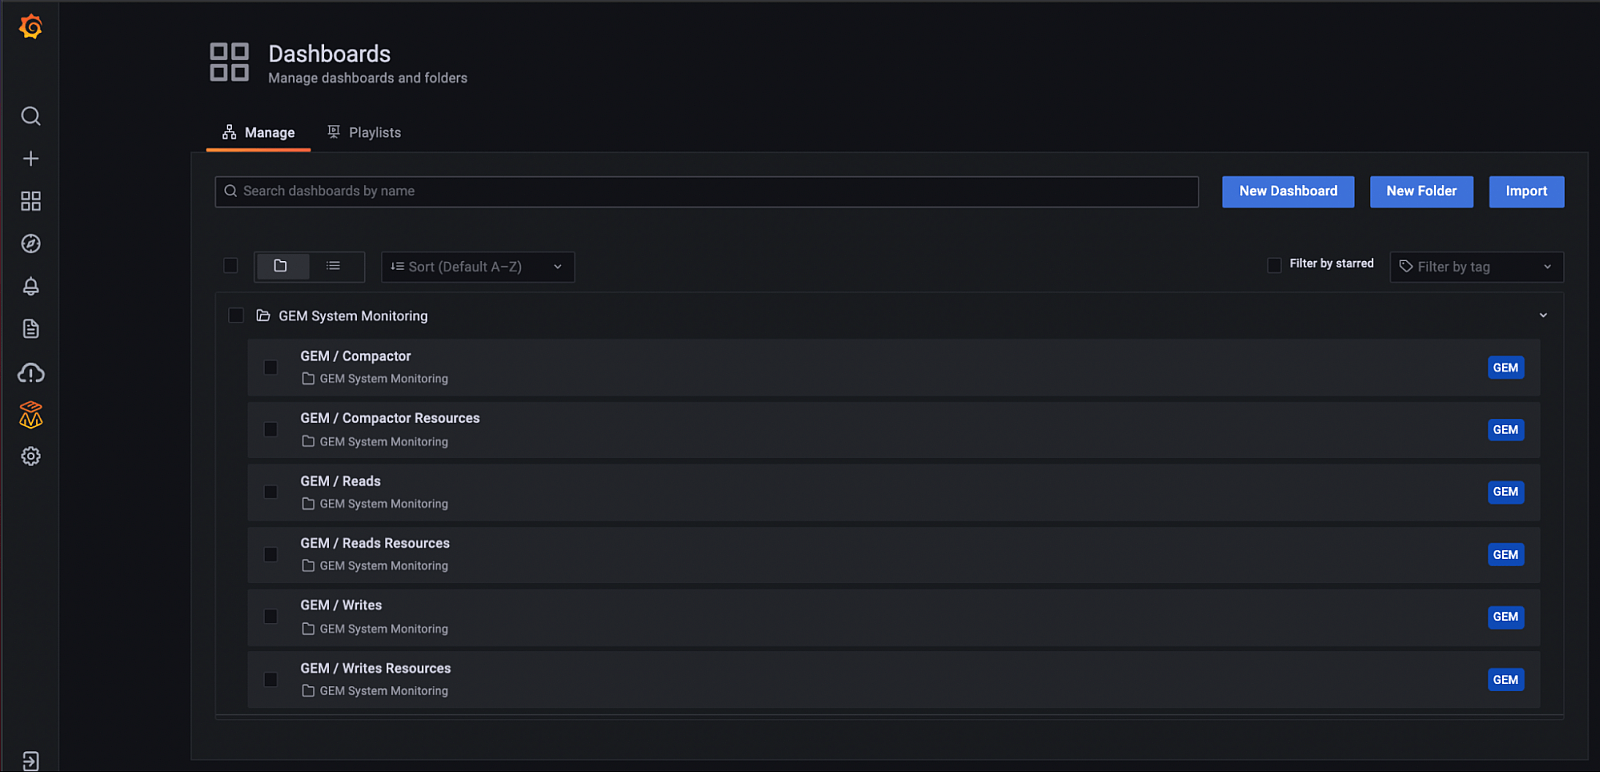
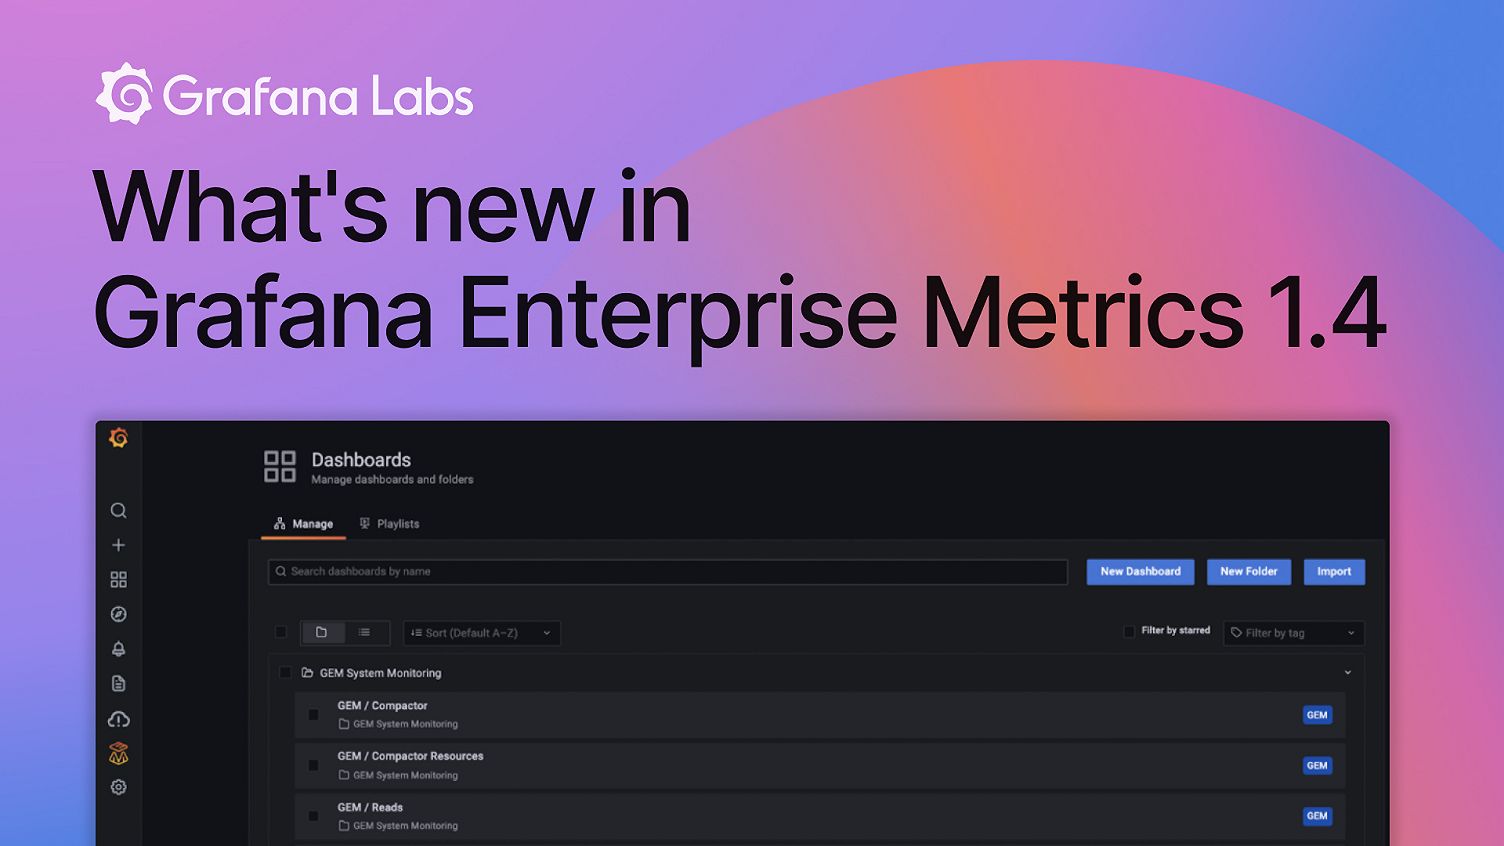
The self-monitoring feature automatically installs a folder with dashboards for understanding system performance based on best practices developed by Grafana Labs engineers.
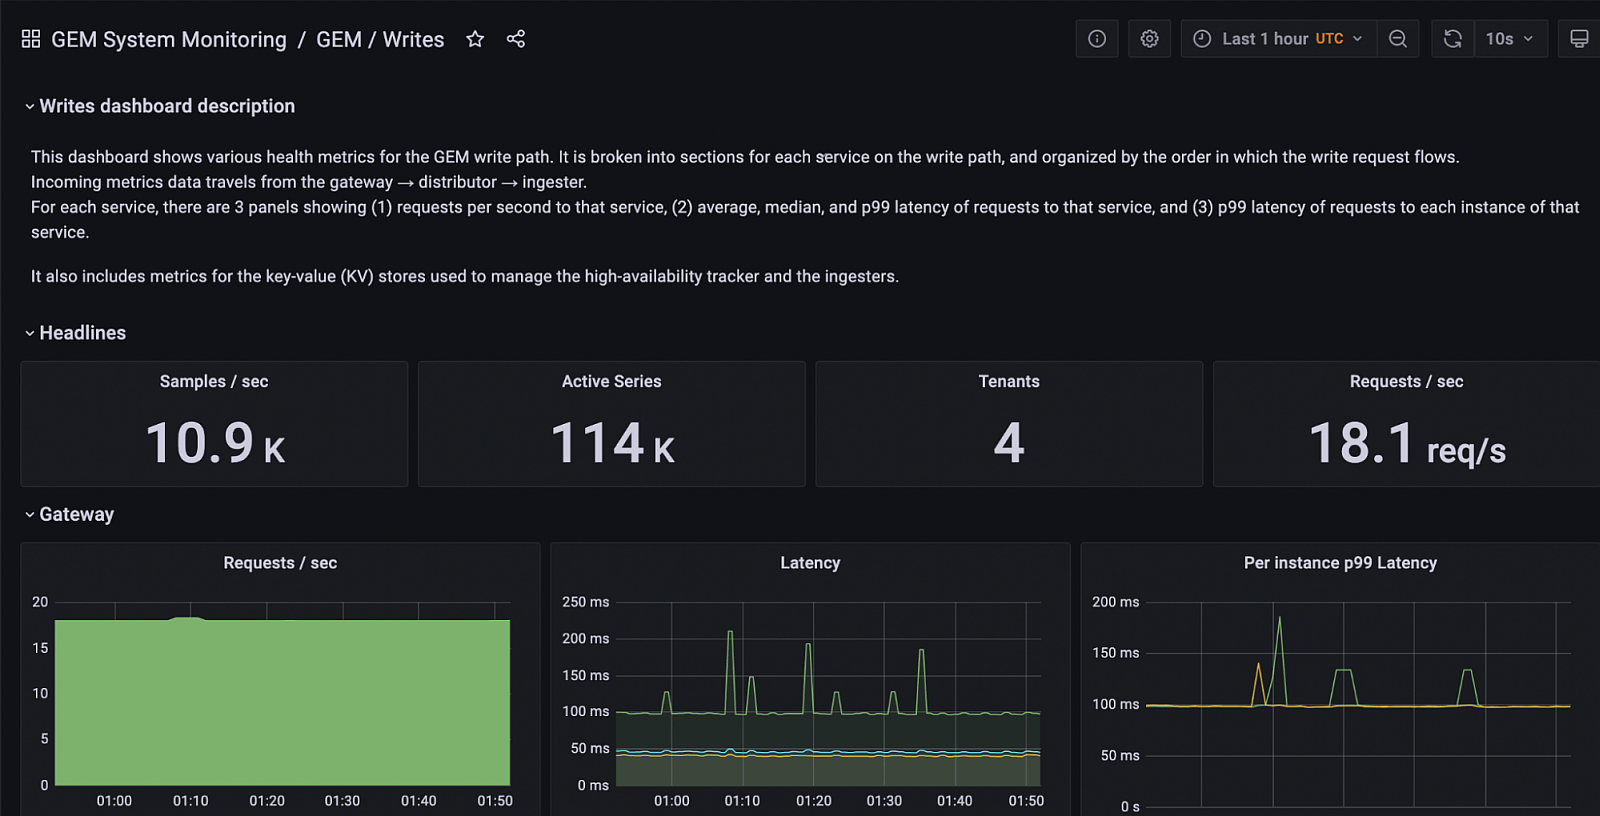
A screenshot of the GEM Writes dashboard, which shows the health of the metrics write path (i.e., ingestion path).
For the details of how self-monitoring works under the hood, check out our documentation.
Learn more
And that’s a wrap on GEM 1.4!
If you’d like to learn more about Grafana Enterprise Metrics, you can watch the “Running Prometheus-as-a-service with Grafana Enterprise Metrics” webinar on demand. You can also read more about GEM in the docs, and contact us if you’d like to try it out!