

What's new in Grafana Cloud for July 2021: Traces, live streaming, Kubernetes and Docker integrations, and more
If you’re not already familiar with it, Grafana Cloud is the easiest way to get started observing metrics (Prometheus and Graphite), logs (Grafana Loki), traces (Grafana Tempo), and dashboards. We have free and paid Grafana Cloud plans to suit every use case — you can sign up for free now.
Here are the latest features you should know about!
Grafana Cloud Traces allows you to easily integrate traces with metrics, logs, and dashboards
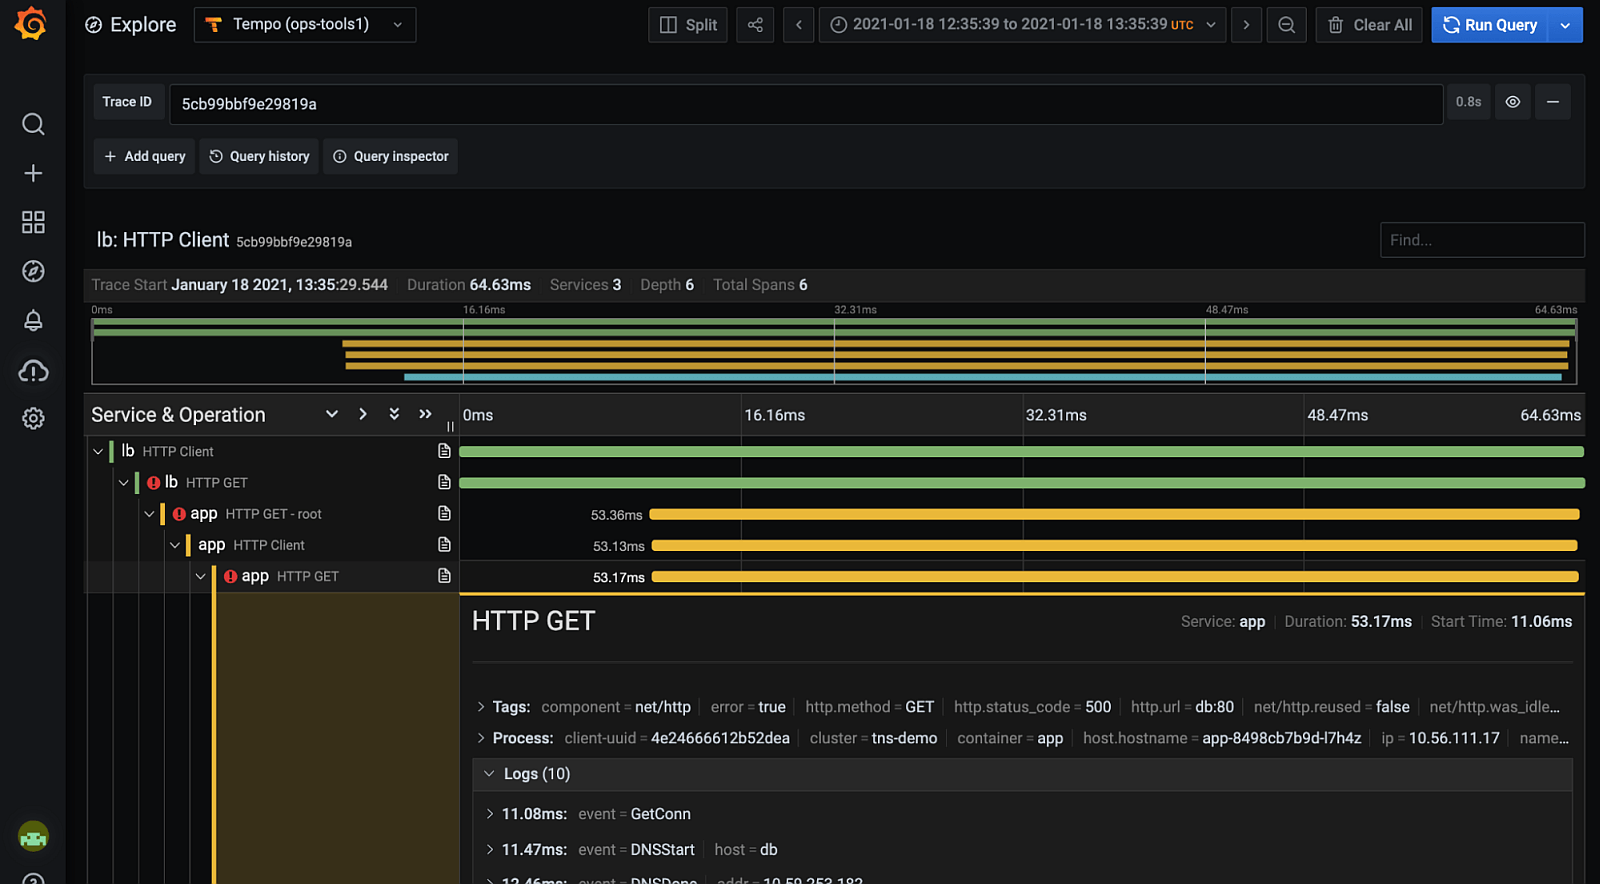
Launched last October, Grafana Tempo provides a new, radically different take on distributed tracing, focusing on the efficient and scalable storage of traces using only object storage. At GrafanaCONline last month, we announced that the project is now GA with the release of v1.0.
With Grafana Tempo, you can dive deeper into your observability data and pinpoint specific traces in order to answer questions like: “Why was this customer’s query slow?” “An intermittent bug showed up again. Can I see the exact trace?” By discovering traces through logs and exemplars, and storing the traces by ID in Tempo, you gain more visibility into your applications while simultaneously reducing your infrastructure spend.
Built on Tempo, Grafana Cloud Traces is now generally available for all Grafana Cloud users so you can integrate traces with metrics, logs, and dashboards in our fully managed observability stack. You can analyze up to 50GB of traces at no cost in the free tier of Grafana Cloud.
Learn more and get started:
Get Grafana 8.0 with Grafana Cloud so you can access new visualizations, live streaming capabilities, and more
With Grafana 8.0, our goal was to provide new and improved ways to visualize data so you can get to work faster and enjoy more responsive interactions with your dashboards. 8.0 includes library panels that can be used and updated across multiple dashboards; new and improved visualizations including state timeline; advanced security and authentication features; improved startup and load performance; Grafana Live for real-time streaming; and more!
There’s supposed to be a video here, but for some reason there isn’t. Either we entered the id wrong (oops!), or Vimeo is down. If it’s the latter, we’d expect they’ll be back up and running soon. In the meantime, check out our blog!
Learn more and get started:
Get preconfigured dashboards for your services with new Cloud integrations
Grafana Cloud integrations bundle the Grafana Agent, tailored Grafana dashboards, and sane alerting defaults, so you can get started quickly observing your services. Check out our newest integrations:
- Kubernetes integration
- RabbitMQ integration
- NGINX integration
- HAProxy integration
- Docker integration
- JIRA integration
See the full list of integrations here.
Learn more and get started:
New data source plugins enable you to visualize your existing data, no matter where it’s stored, using a highly available, fully managed Grafana service
Using Grafana Cloud’s fully managed, dedicated Grafana service, you can visualize observability metrics from existing data sources running in your environment and managed data endpoints, built into Grafana Cloud. This service runs the same open source Grafana platform deployed by thousands of DevOps and SREs, but is managed and optimized by Grafana maintainers and contributors, so you don’t have to worry about downtime, upgrades, and high availability for your metrics visualization platform.
Here are the most recent plugins to check out:
Learn more:
The updated synthetic monitoring plugin has a new way to view checks
Customers with lots (as in hundreds) of checks didn’t like viewing checks in a paginated list, because it’s hard to determine their status at a glance. The new check visualization view will show all the checks at once and show their status.
There’s supposed to be a video here, but for some reason there isn’t. Either we entered the id wrong (oops!), or Vimeo is down. If it’s the latter, we’d expect they’ll be back up and running soon. In the meantime, check out our blog!
Learn more and get started:
ICYMI: The latest resources to help you optimize with Grafana Cloud
Cool use cases:
- Using Grafana Cloud to drive manufacturing plant efficiency
- Lean, mean, monitoring machine: Grafana at every scale
- How to connect and monitor your Raspberry Pi to Grafana Cloud
- Turn your home office into a NOC room with Philips Hue and Grafana
Tips and tricks:
- Intro to Prometheus and Grafana Cloud
- The future of Prometheus remote write
- How to set up and visualize synthetic monitoring at scale with Grafana Cloud
What’s coming next
Grafana Cloud alerting will soon have a much richer interface for managing and viewing your alerts. Last September, we introduced Prometheus-style alerting in Grafana Cloud, with a simple UI embedded right in your Grafana instance to manage alerts. We’re taking that one step further with a new system that brings forward even more alerting details but is now wrapped in a much richer interface for managing and viewing your alerts. This new, friendlier interface is more aligned with the easy-to-use experience that our users have come to love throughout the rest of Grafana.
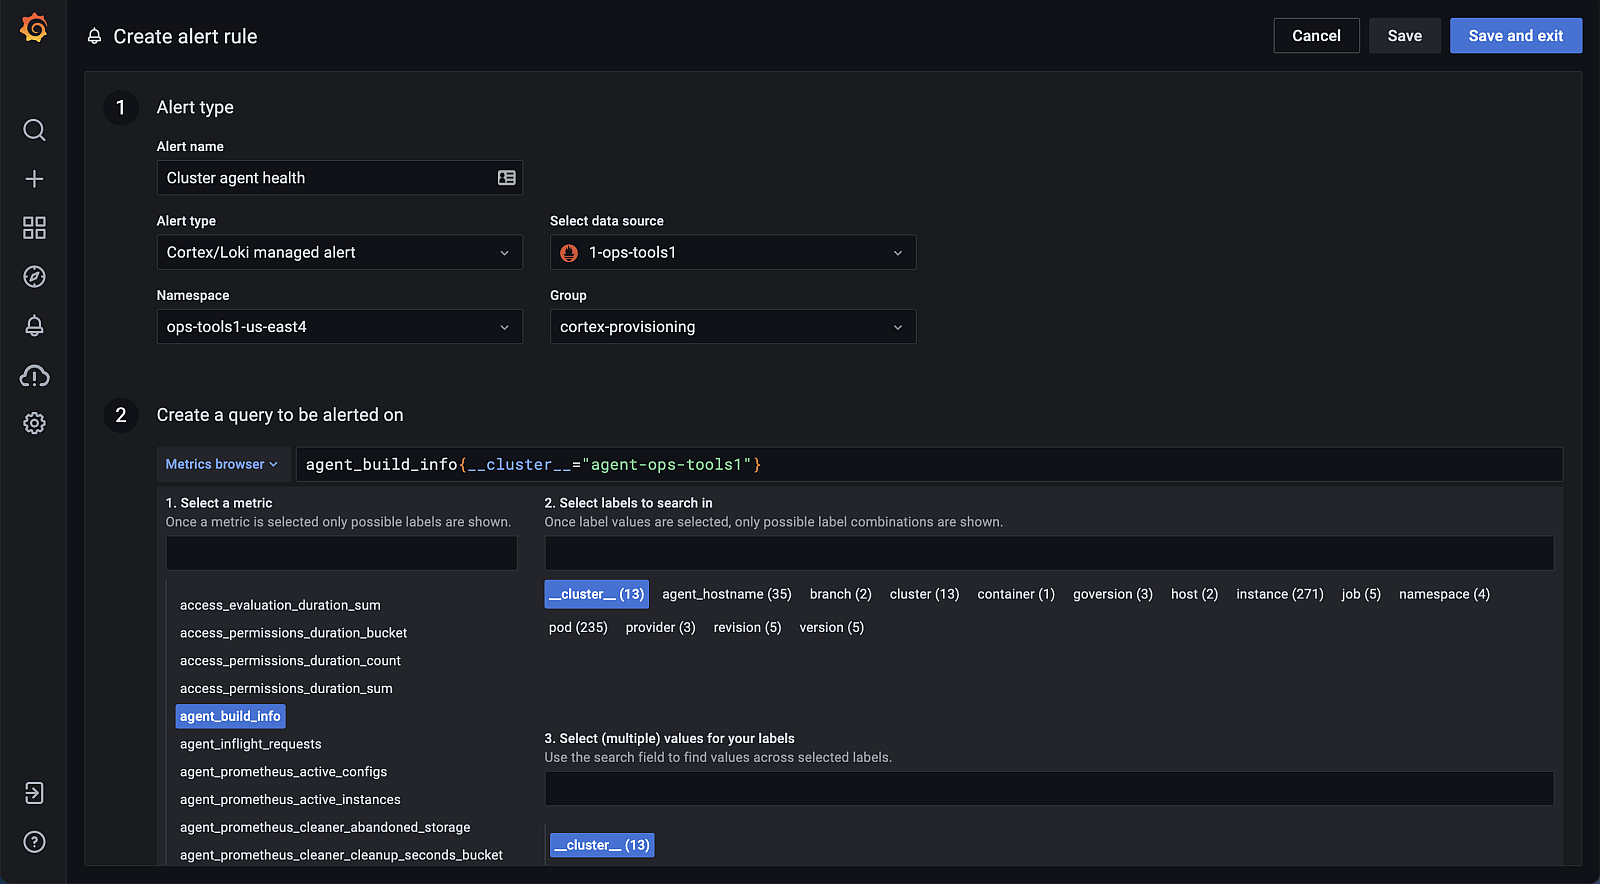
For Grafana Cloud users, this will be made available widely once it is officially available by default and moves beyond Feature Preview mode, in a subsequent Grafana 8.x release. Once this officially rolls out, all alerts will be automatically migrated, and the legacy Enterprise and Cloud Alerting plugins will be deprecated.
Learn more:


