
New in the Google Cloud Monitoring data source plugin for Grafana: sample dashboards, deep linking, more
More than two years ago, the Google team began collaborating with Grafana Labs to build a data source plugin for Google Cloud Monitoring (then known as Stackdriver). Today, Grafana ships with built-in support for Google Cloud Monitoring, allowing users to add it as a data source and quickly get started building dashboards for Google Cloud Monitoring metrics.
We’ve continued to make improvements on the plugin, and we’ll share in this blog post a few new features we’ve built.
Sample dashboards for GCP services
It’s always easier to modify than to create from scratch! We took the 15 of the most popular sample dashboards from the Google Cloud Monitoring dashboard samples library on GitHub, converted them into a Grafana-compatible format, then enabled users to install them from the dashboard list. With this sample library, you can easily import a sample, apply it to a test project, edit it, and save it as needed.

Deep link to Google Cloud Monitoring Metrics Explorer
Sometimes you need to switch between your Grafana interface and Google Cloud console for troubleshooting. But the context can be easily lost, and it can be hard to locate the same time series data. We introduced deep linking to Cloud Monitoring Metrics Explorer on Grafana dashboards. You can easily log into the GCP console through the deep linking and land right on the time series you want to further investigate.

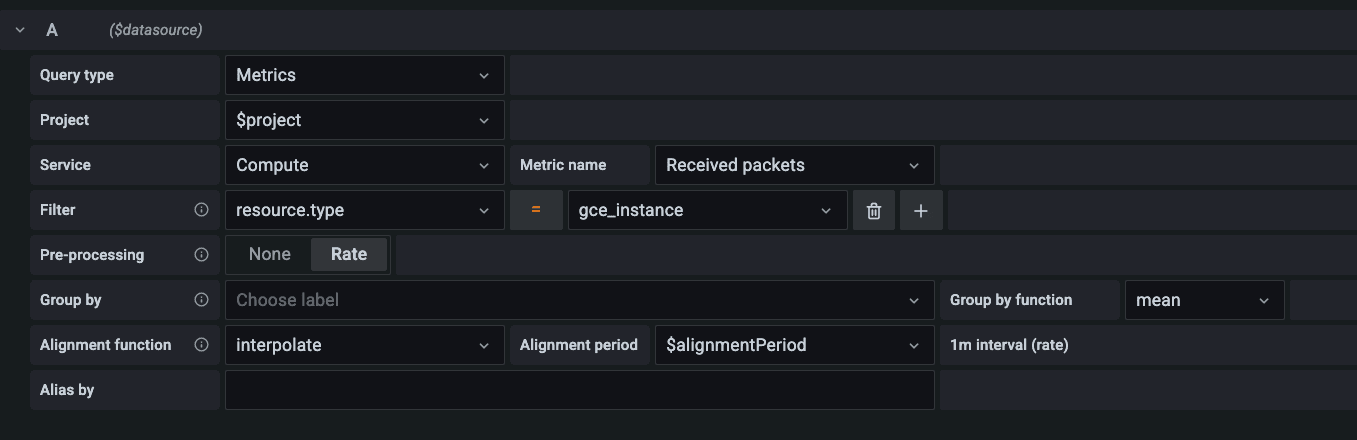
Improved query interface that aligns with new dashboard creation flow
Cloud Monitoring launched an improved dashboard creation flow at the end of 2020, along with a new concept of preprocessing for delta and cumulative metrics kinds. You can select preprocess delta metrics by the rate, and you can also select cumulative metrics kind as rate or as delta.
So you can choose to visualize your data by original format or in a format that can be easily transformed into a rate or a change in value.

Monitoring Query Language (MQL) interface enabled
Last year, Cloud Monitoring introduced the GA of Monitoring Query Language (MQL), a tool that can perform advanced calculations. We’ve now enabled the MQL editor on the plugin, so you can run your existing MQL query from the Grafana interface directly.

Conclusion
For more information about how to get started with the Google Cloud Monitoring native data source for Grafana, check out the documentation. We’d love to hear what other features you would like to see!
The easiest way to get started with Grafana dashboards, metrics, logs, and traces is Grafana Cloud, our fully managed composable observability stack. Check out the free and paid plans here.

