
How Grafana Cloud drives manufacturing plant efficiency at American Metal Processing
What makes a manufacturing plant efficient?
“Generally, it means that there’s no wasted materials, no wasted time, and no wasted energy,” said Grant Pinkos, President of American Metal Processing. “Unplanned downtime is minimal or nonexistent. And the processes that align the goals of sales, operations, quality, and finance are all together.”
During his GrafanaCONline talk, Pinkos described how the fully managed Grafana Cloud platform helps his 75-year-old heat treating company pursue that goal by simplifying data collection, identifying patterns, and predicting potential failures before they happen.
At AMP’s rotary heat treat facility — the largest in the country — customers’ parts are fed into a furnace where they are rotated for anywhere from 30 minutes to nine hours, after which they are moved to a quench tank. The conditions, temperature and gas atmosphere of the entire process must be closely monitored and tightly controlled.
“The signal chain that we’ve set up basically takes sensor data of various types,” said Pinkos. “It can be easily put into a time series database; we use Influx and Microsoft SQL. From there, we use Grafana Cloud to display it throughout the plant as well as on everyone’s mobile phone.”
The plant operates 24 hours a day. If something goes wrong during the 16 hours that no one is in the plant, this level of observability empowers workers to react accordingly in real time. “We’re only about 18 employees,” explained Pinkos. “And it’s really the perfect thing for us.”
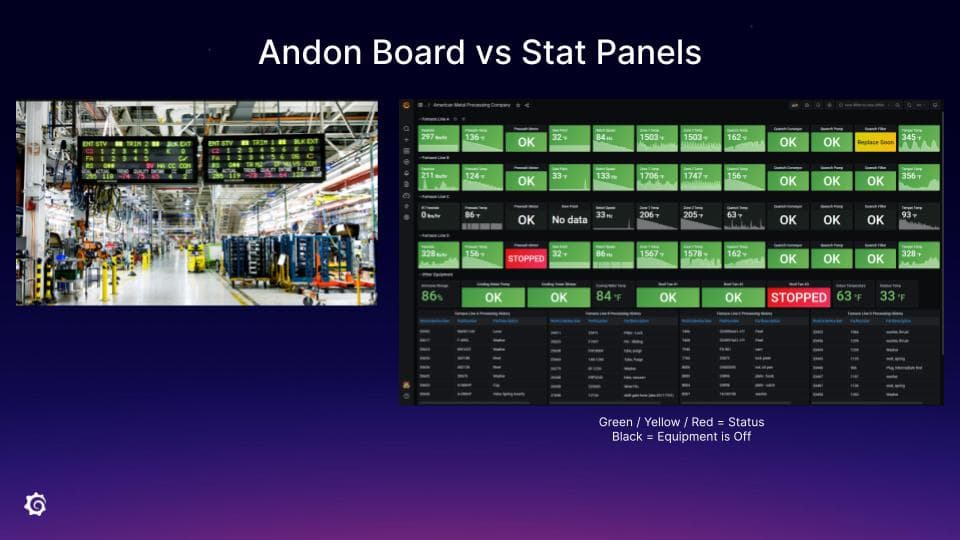
Introducing Grafana Cloud into the plant was a giant step forward from more dated methods of collecting and sharing data. “In traditional manufacturing environments, you’d see these large panels hanging from the ceiling that depict the status of the plant at that particular moment,” said Pinkos. Some of their most used Grafana dashboard features include stat panels, time graphs, and process variables with alerts.
At AMP, Pinkos’s team has found Grafana Cloud to be a flexible, cost-effective solution. As the plant’s needs change, the team can update the dashboards or tweak the emphasis placed on various data points. “We collect every parameter that we can, we display that data in convenient places where it will be viewed and used,” said Pinkos. “Then we look for the problems in that data to continuously improve our business.”
Ultimately, he added, “When we thought about using Grafana, we said, ‘What if the problems could be visualized as they’re happening, and not a month later? What if the trends could be detected, logged, and aggregated, so if something is spiking or falling, we could automatically see it? And when this does happen, view it as an opportunity for improvement?’”
Find out more about how Grafana Cloud transformed AMP’s plant management and more by watching the full GrafanaCONline talk here. All of the GrafanaCONline 2021 sessions are now available on demand.
Grafana Cloud is the easiest way to get started with dashboards, metrics, logs, and traces. You can sign up for a free trial here.

