GrafanaCONline Day 6 recap: The latest on Loki for logs, Grafana for monitoring high performance computing, the business of Grafana Labs, and more!
GrafanaCONline 2021 has ended! Thank you to everyone who tuned in and to all of our presenters. If you’d like to relive any moment, the videos are available on demand now!
If you didn’t get a chance to watch Thursday’s presentations, here’s what you missed from Day 6 of the conference:
Get more and spend less with Grafana Loki for logs
Software engineer Danny Kopping kicked off the session by explaining a few of Loki’s benefits: Its low cost, it has a query language that will be familiar to anyone who has used PromQL, and it’s deeply integrated into Grafana. Since Loki v2.0 was released last year, features have been added that include custom retention and deletion, the ability to scrape the Windows Event log with promtail and send it to Loki, and multiline logs. Kopping gave a demo of recording rules, an experimental feature that makes it possible to run metric queries on logs and produce real Prometheus metrics. Senior Software Engineer Cyril Tovena took over from there, to discuss LogQL (the Loki query language) and how to get more from your logs with it. He highlighted a few interesting use cases and ended with a look at the future of LogQL. Working at a large company? Product Manager Jen Villa discussed what it takes to deliver the Loki experience to your end user, either on your own or through Grafana Enterprise Logs. Software Engineer Levente Balogh provided a demo.
The session will be available on demand here.
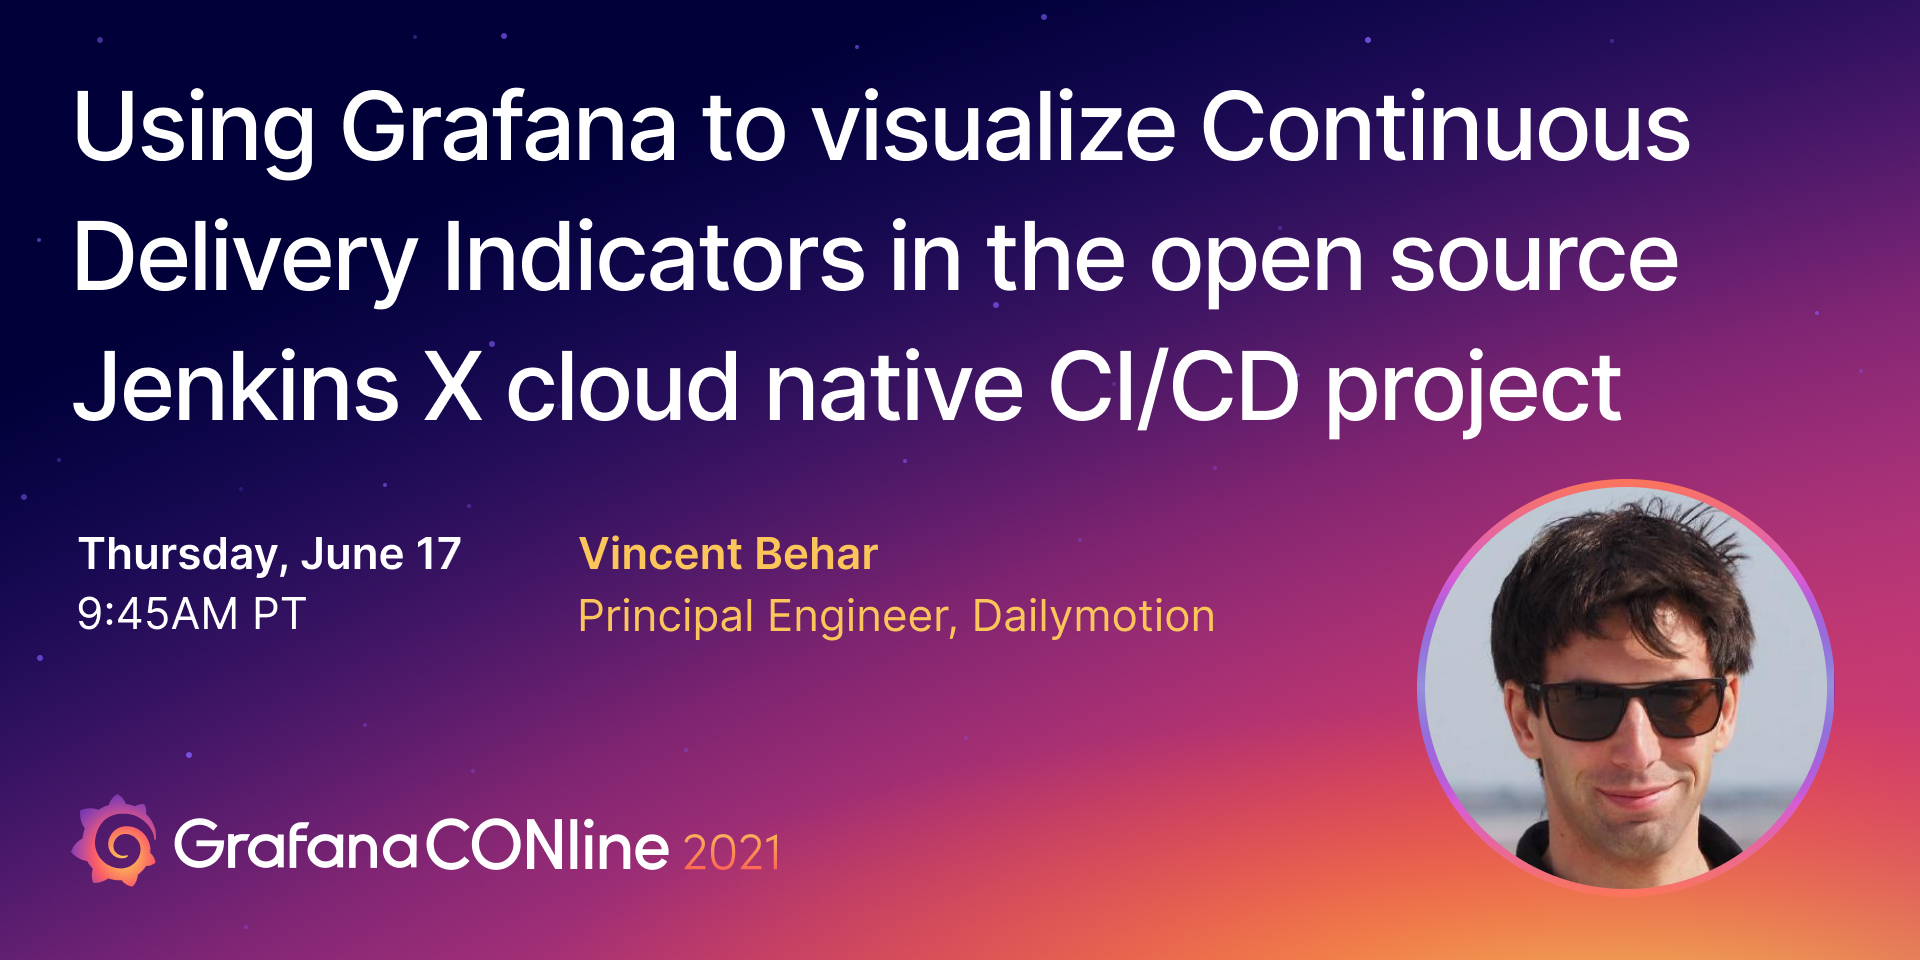
Using Grafana to visualize Continuous Delivery Indicators in the open source Jenkins X cloud native CI/CD project
Vincent Behar, Principal Engineer at Dailymotion and a contributor to the Jenkins X project, spoke about how his company uses Jenkins X — an open source, cloud native continuous delivery platform built on Kubernetes — with Grafana. He explained how they’re using Prometheus, Loki, and Tempo, and highlighted a few dashboards, including one that mixes multiple data sources. Behar discussed the importance of Continuous Delivery Indicators and what they measure, then shared how they collect, store, and visualize them. He also broke down how Dailymotion deploys Grafana with Helm and Kubernetes.
The session will be available on demand here.
Enhancing observability for High Performance Computing infrastructure with Grafana
J.D. Maloney, Senior HPC Storage Engineer from the National Center for Supercomputing Applications (NSCA), spoke about High Performance Computing (HPC) and how early in the pandemic, the NSCA allowed scientists and researchers to use their systems to simulate drug effectiveness and model the spread of COVID-19. He explained what the complex HPC infrastructure looks like, and how Grafana helps the NSCA’s users as well as the organization’s engineers. For example, the scientists use project storage dashboards so their research teams can see their storage utilization of the NSCA’s file systems and manage their allocation effectively. They also rely on queue utilization dashboards, job dashboards, and job size analysis — and he noted the feedback has been very positive. He explained how Grafana has helped the backend engineers centralize metrics and increase system visibility, and how it’s allowed them to have trend-based alerting. One of the key benefits he highlighted was having all of their data visible in one place rather than having to look at multiple tabs showing different vendors’ dashboards.

The session will be available on demand here.
Using the Grafana Stack to visualize and manage overall service health and alerts
Salesforce, a cloud-based software company, leverages Grafana’s dashboards, Prometheus, Loki, and plugins to monitor service health and drive the overall product availability insights across the company. Frances Zhao-Perez, Senior Director of Product Management, kicked off the presentation with an introduction to Salesforce’s observability portfolio, which includes using Grafana Labs’ cloud native solution to help manage low-latency alerting and help with auto-remediation and auto-scaling. Principal Software Engineer Pavan Rangavajhala then talked about how Salesforce derives service health insights using Grafana. He went through a service health analytics life cycle, noting that Salesforce has one single dashboard that works off around 5000+ distinct expressions and threshold configs that are configured by their service owners. He also explained how Grafana helps the company create dynamic and complex dashboards that can work at scale.
Lead Software Engineer Sanjana Chandrashekar then spoke about Salesforce’s hyperlocal observability, a backend set of open source and cloud native observability tools. Chandrashekar talked about why they developed automation tooling and the benefits that the tools offer in the context of different dashboards — namely templating, versioning, extensibility, and integrations.
Up next was Software Architect John O’Brien, who works in the area of performance. He walked through three Grafana dashboard use cases: trends, health checks, and performance monitoring.
The presentation concluded with Software Engineering Manager Joe Pallotta, who works on Salesforce’s Commerce Cloud. He demonstrated one of the primary dashboards they use to effectively monitor customer performance on the platform, and explained how they purposefully architected the dashboard to render key insights as quickly as possible.
The session will be available on demand here.
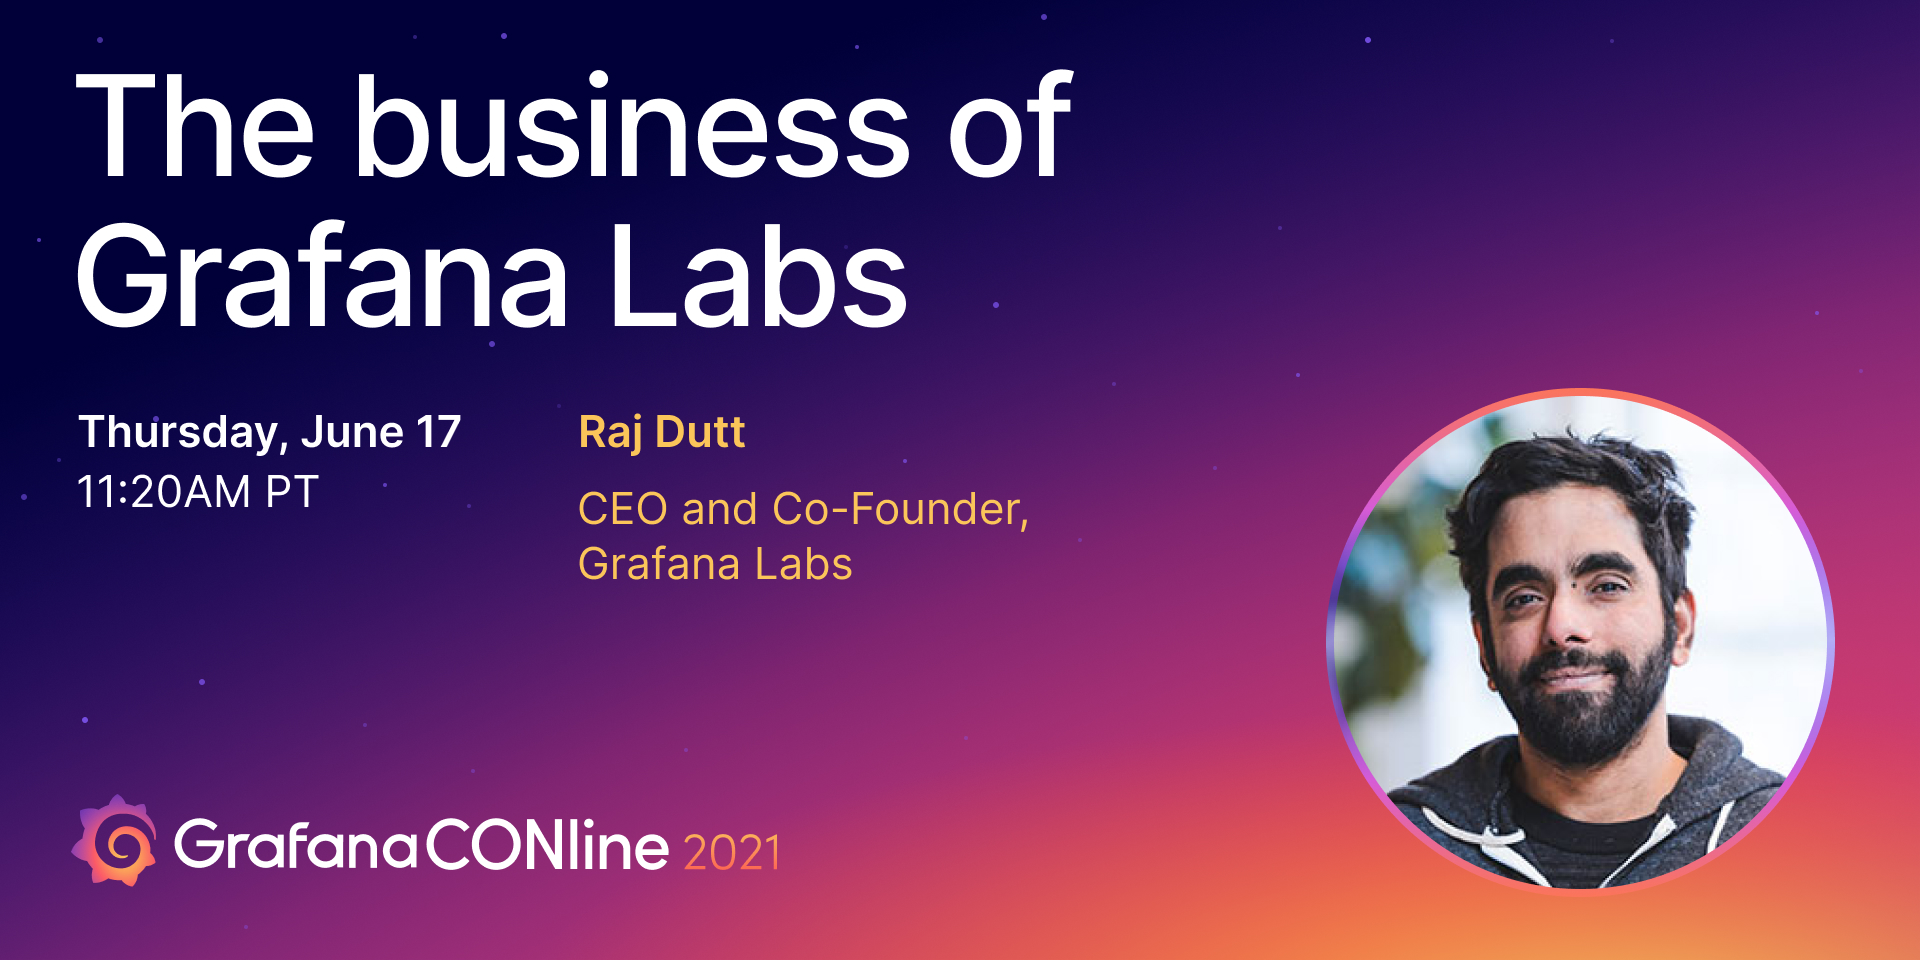
The business of Grafana Labs
Grafana Labs CEO and co-founder Raj Dutt closed out GrafanaCONline 2021 with an update on the company’s performance. He said it’s been “a banner year,” thanks to a growing team, accelerated adoption of Grafana Labs’ open source projects, revenue that’s trending nicely, and the growth of commercial products. He talked about a prediction made at the last GrafanaCONline that the company would have 200 team members by the end of 2020. Not only was that number met early, but today later there are about 400 Grafanistas all over the world. (And we’re still hiring!) Dutt shed light on the adoption of Grafana, Loki, and Tempo, and highlighted the company’s revenue growth, which has exceeded expectations. He discussed the evolving Grafana Stack and how Grafana is all about composability and choice, and noted the effort being put into Grafana Cloud and the Free Forever Plan.
Finally, he made a big announcement: Grafana Labs has acquired the load-testing startup k6. For years, Grafana Labs has been a fan of k6’s open source tool, which allows users to test software before it goes into production. As a result of this acquisition, Dutt said the Grafana community and customers can expect some interesting capabilities added to the stack.
The session will be available on demand here.
Revisit the full GrafanaCONline 2021 schedule here.
And don’t forget, you can always connect with the Grafana community and get the latest updates from the Grafana Labs team on Slack. Sign up here.
