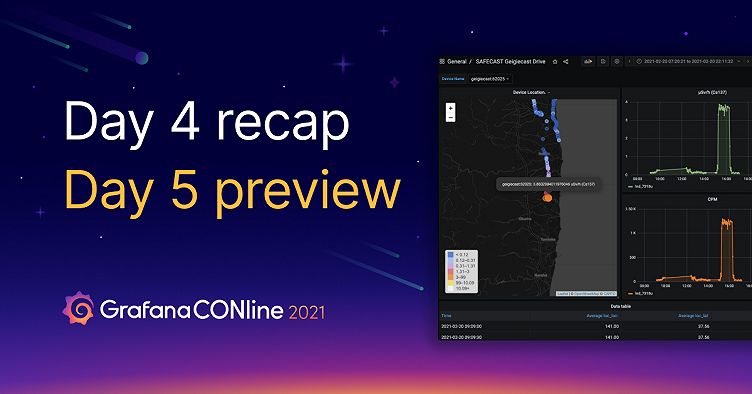
GrafanaCONline IoT Day recap: Real-time streaming in Grafana 8, fun DIY projects, Grafana for trains, plants, and more
Week two of GrafanaCONline 2021 is going strong! To catch the live sessions — or to watch all the videos on demand after GrafanaCONline ends on June 17 — register here.
If you didn’t get a chance to watch yesterday’s presentations, here’s what you missed from Day 4 of the conference:
IoT in Grafana: Real-time streaming, new visualizations, and more, oh my!
Grafana is typically used for large IT infrastructure projects, but plenty of people have discovered it’s a great tool for monitoring physical equipment, too. Grafana Labs VP of Applications Ryan McKinley showcased the fundamental changes being made in Grafana to support industrial and IoT projects. Those changes include live streaming, new visualizations, and basic platform improvements (such as reducing processing and making services as lazy as possible). McKinley showed examples of dashboards and highlighted the headline feature for IoT in Grafana 8.0: Grafana Live, the core platform used to broadcast real time events and data to dashboards. He also explained how to stream data from sensors in Grafana 8.0 before Software Engineer Atif Ali stepped in to provide demos. The session ended with a preview of what’s coming in Grafana 8.1+.
The session will be available on demand here.
Easy DIY IoT projects with Grafana
Grafana Labs Senior Engineering Manager Ed Welch and Software Engineer Ivana Huckova shared some of their favorite IoT projects that require minimal effort and technical skills. (If you can put together LEGOs and copy and paste code, you’re on your way.) Welch gave a quick overview of IoT and Arduino, an open source electronics platform, and some practical advice: Order extra parts and expect to break things. Their projects include room comfort monitoring, sourdough starter monitoring, time tracking, and a pet tracker using Grafana Cloud. They also showed off how to keep tabs on a burning candle — and even extinguish it from across an ocean. Find out more about all of their projects here.
The session will be available on demand here.
Creating value through IoT train sensor data with Grafana
Ever considered trains to be data centers on wheels? That’s how they’re seen by Martin Klimmek, Head of Digital Development and Operations at Siemens Mobility UK, and Data Platform Engineer Haluk Tutuk from Periscube, Ltd, a Siemens Mobility UK cloud solutions partner. Siemens has had a longstanding passion for observability in the rail domain and Klimmek explained how these days, Siemens Mobility strives to make it easier to work with data across their network of developers, customers, and domain engineers. In order to work proactively, the company also wants to increase its power to use data to describe, explain, and predict, and Grafana helps them do that. Klimmek highlighted a few of the company’s use cases, including how Siemens Mobility is using Grafana for capacity planning — something that’s been especially important in the time of social distancing. Tutuk then gave an overview of the company’s data ingestion stack (which consumes more than 1 million data points each day) and infrastructure solution architecture, which includes Grafana Enterprise.

The session will be available on demand here.
Using Grafana Cloud to drive manufacturing plant efficiency
In this presentation, Grant Pinkos, President of American Metal Processing, revealed how the 75-year-old heat treating company uses Grafana Cloud to monitor its manufacturing plant and ensure it’s running efficiently. Pinkos noted that some of the benefits of Grafana are that it makes data collection simple, identifies patterns and predictive failures, and gets rid of dated methods of collecting data and sharing it. He illustrated the signal chain they use to monitor the company’s furnace, and discussed how having 24/7 visibility (in the plant and through mobile phones) helps their 18-person team stay on top of what’s happening and react accordingly. Pinkos then shared some of their most-used Grafana dashboard features, including stat panels, time graphs, and process variables with alerts.
The session will be available on demand here.
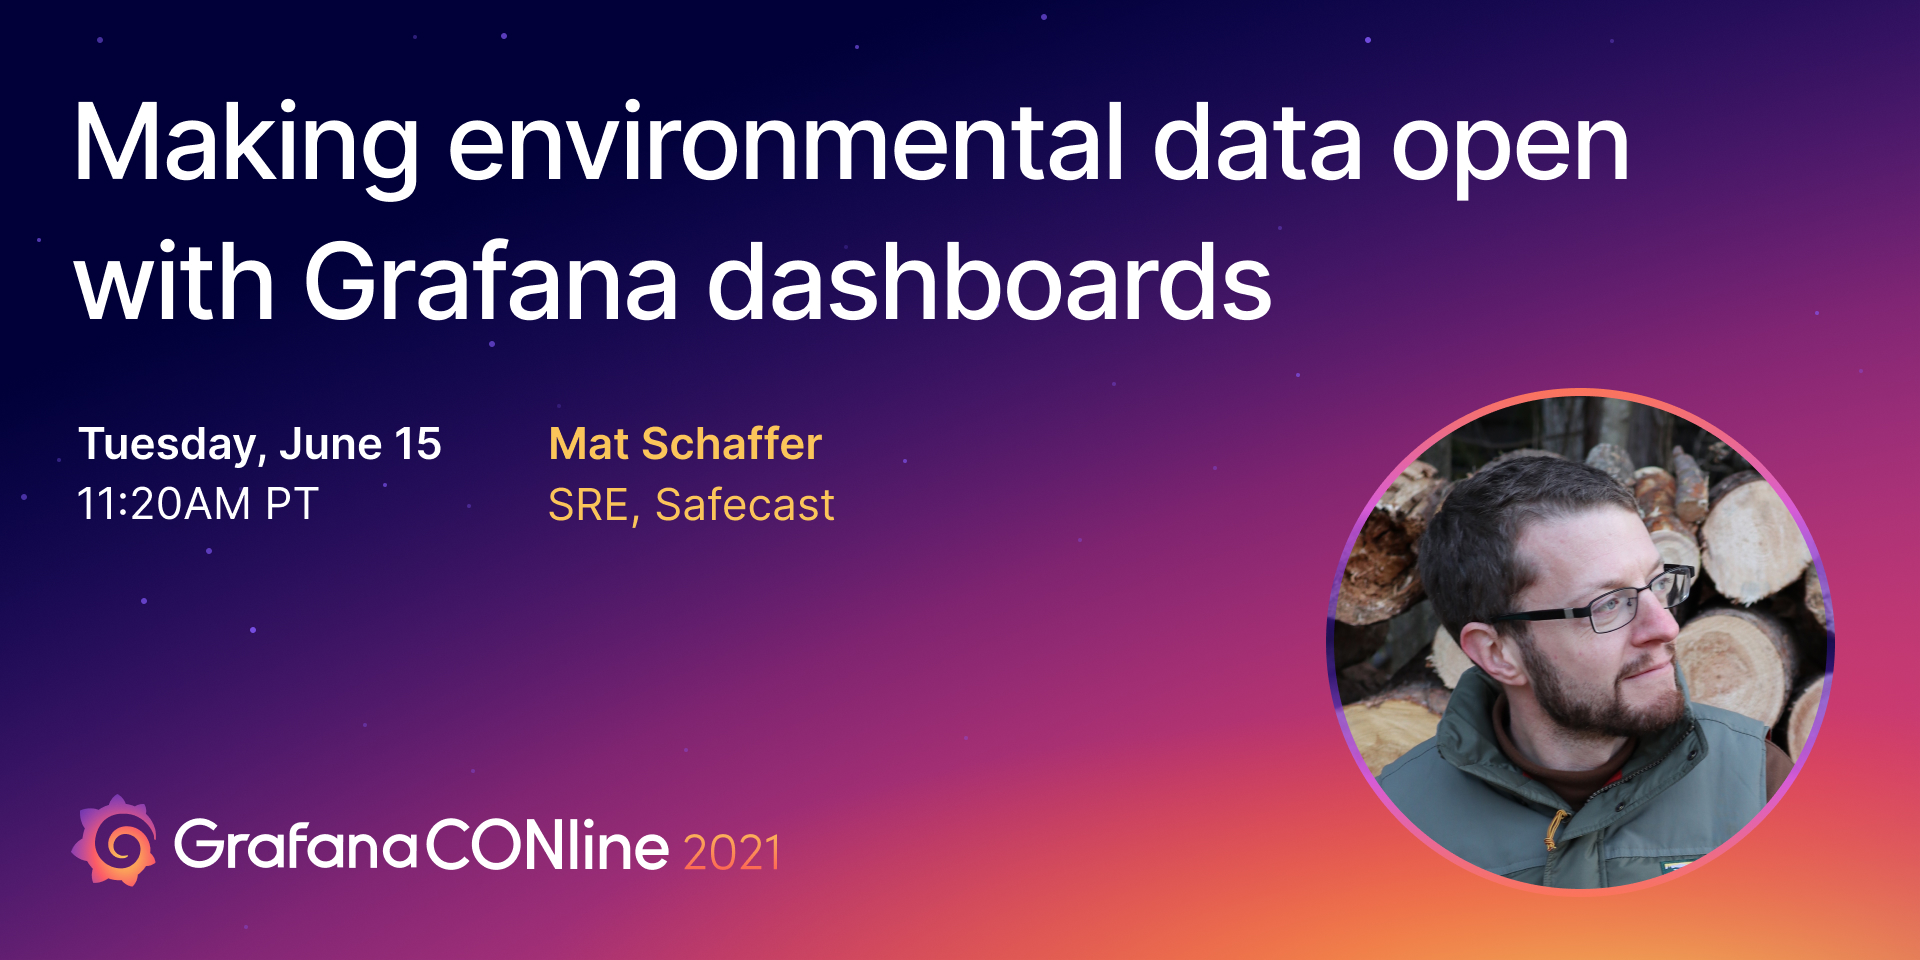
Making environmental data open with Grafana dashboards
Mat Schaffer, a volunteer Site Reliability Engineer for Safecast, began his presentation with a simple question: Are you safe? You may have the physical protection of four walls, but he explained there are many things you might not be able to see, such as environmental sources of toxicity. After the meltdown of Japan’s Fukushima Daiichi Nuclear Power Plant in 2011, there was no trustworthy radiation information available to the public — and not enough sensors to record the data, either — so a group of volunteers formed Safecast.org and created their own monitoring system. A project that started with duct tape and old phones now has the largest open source database of recorded background radiation in history, and they’ve collected more than 160 million data points so far. Schaffer showed off some of the sensors they use for data collection (they can be installed in cars or outdoors) and outlined how their data ingestion infrastructure works. He then gave a demo of how Safecast uses various Grafana dashboards to visualize real-time data from sensors around the world.
The session will be available on demand here.
Panel: Careers in open source
Grafana Labs Senior Community Manager Sam Coren led a discussion with four Grafana Labs team members: Senior Engineering Manager Myrle Krantz, Software Engineers Uchechukwu Obasi and Vicky Lee, and Senior Software Engineer and Prometheus maintainer Goutham Veeramacheneni. They took on a somewhat controversial topic: getting paid to open source. The group began by discussing the very different paths they each took to Grafana Labs. Veeramacheneni opened up about the struggle that comes with contributing to open source for the first time, which led to a chat about the value of mentorship. Coren then turned the discussion to making non-code contributions to open source projects, in areas such as organizing events and conferences, and community-building. The group also talked about the differences between working in an open source versus a closed source world, the benefits of sharing and feedback that come with the open source community, and how open source has changed their lives.
(Interested in working at Grafana Labs? We’re hiring! Visit our careers page to check out the open positions.)

The session will be available on demand here.
Today’s sessions
What’s next for alerting in Grafana with Myrle Krantz, Oana Mangiurea, Sofia Papagiannaki, Josue Abreu, and Kyle Brandt from Grafana Labs at 9:00am PT / 12:00pm ET / 16:00 UTC
Dashboards as code, simplified with Jessica Brown, Malcolm Holmes, Sam Boyer, and Ying Wang from Grafana Labs at 9:45am PT / 12:45pm ET / 16:45 UTC
How to set up and visualize synthetic monitoring at scale with Grafana Cloud with Yashvardhan Kukreja from Grofers at 10:30am PT / 1:30pm ET / 17:30 UTC
Using Grafana to inform the public of Covid’s economic impact in near-real time with Dénes Csala from Lancaster University at 10:55am PT / 1:55pm ET / 17:55 UTC
Grafana onboard the SOFIA airborne astronomical observatory with Ronan Higgings from the University of Cologne at 11:20am PT / 2:20pm ET / 18:20 UTC
Building a 360-degree observability platform with the Grafana Stack with Boris Gdalevich from KKR at 11:45am PT/ 2:45pm ET / 18:45 UTC
Check out the full GrafanaCONline 2021 schedule here.
And don’t forget you can connect with the Grafana community and get the latest updates from the Grafana Labs team during the event on Slack. Sign up here and join the #grafanaconline channel.
